| Param | Original file | Final file |
|---|---|---|
| Filename | modeM0/AS1A08_007T01_9000003362_22724cztM0_level2.evt | modeM0/AS1A08_007T01_9000003362_22724cztM0_level2_quad_clean.evt |
| Size (bytes) | 435,260,160 | 98,156,160 |
| Size | 415.1 MB | 93.6 MB |
| Events in quadrant A | 3,058,398 | 657,040 |
| Events in quadrant B | 3,194,437 | 661,605 |
| Events in quadrant C | 3,113,350 | 631,013 |
| Events in quadrant D | 3,426,700 | 622,629 |
| Mode SS | |||
|---|---|---|---|
| Quadrant | BADHDUFLAG | Total packets | Discarded packets |
| A | 0 | 116 | 0 |
| B | 0 | 116 | 0 |
| C | 0 | 116 | 0 |
| D | 0 | 116 | 0 |
| Mode M0 | |||
|---|---|---|---|
| Quadrant | BADHDUFLAG | Total packets | Discarded packets |
| A | 0 | 12542 | 1 |
| B | 0 | 12895 | 1 |
| C | 0 | 12786 | 1 |
| D | 0 | 13758 | 1 |
| Mode M9 | |||
|---|---|---|---|
| Quadrant | BADHDUFLAG | Total packets | Discarded packets |
| A | 0 | 13 | 0 |
| B | 0 | 13 | 0 |
| C | 0 | 13 | 0 |
| D | 0 | 13 | 0 |
| Quadrant | Total seconds | Saturated seconds | Saturation percentage |
|---|---|---|---|
| A | 5729 | 70 | 1.221854% |
| B | 5730 | 96 | 1.675393% |
| C | 5730 | 105 | 1.832461% |
| D | 5730 | 112 | 1.954625% |
Noise dominated data is calculated using 1-second bins in cleaned event files. If a bin has >2000 counts, and if more than 50% of those come from <1% of pixels, then it is considered to be noise-dominated and hence unusable.
| Quadrant | # 1 sec bins | Bins with >0 counts | Bins with >2000 counts | High rate bins dominated by noise | Noise dominated (total time) | Noise dominated (detector-on time) | Marked lightcurve |
|---|---|---|---|---|---|---|---|
| A | 7019 | 5730 | 0 | 0 | 0.00% | 0.00% | 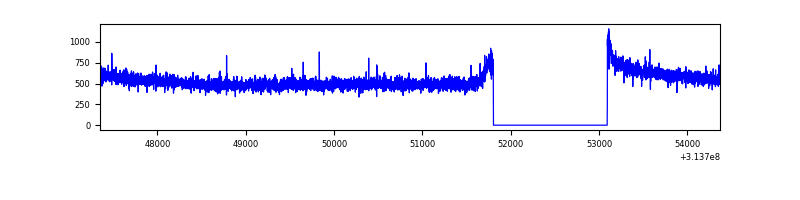 |
| B | 7020 | 5731 | 24 | 24 | 0.34% | 0.42% | 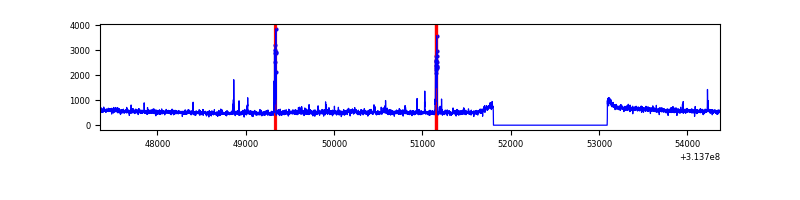 |
| C | 7020 | 5731 | 0 | 0 | 0.00% | 0.00% | 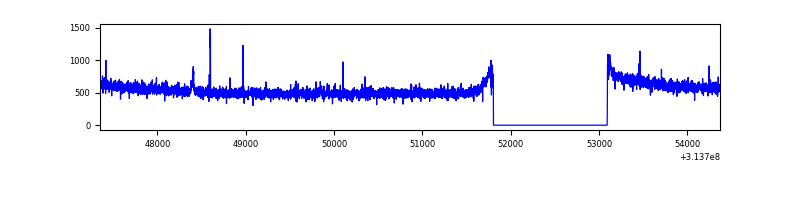 |
| D | 7020 | 5731 | 47 | 47 | 0.67% | 0.82% | 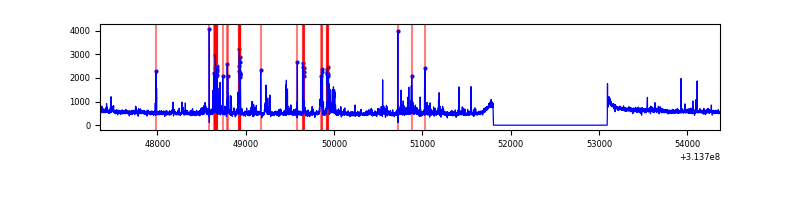 |
Top three noisy pixels from each quadrant. If the there are fewer than three noisy pixels in the level2.evt file, extra rows are filled as -1
| Pixel properties | Quadrant properties | ||||||
|---|---|---|---|---|---|---|---|
| Quadrant | DetID | PixID | Counts | Sigma | Mean | Median | Sigma |
| A | 13 | 254 | 9805 | 57.77 | 792 | 778 | 156.3 |
| A | 0 | 226 | 7149 | 40.77 | 792 | 778 | 156.3 |
| A | 12 | 194 | 5849 | 32.45 | 792 | 778 | 156.3 |
| B | 0 | 245 | 67822 | 470.49 | 777 | 762 | 142.5 |
| B | 0 | 228 | 57656 | 399.17 | 777 | 762 | 142.5 |
| B | 0 | 190 | 21650 | 146.55 | 777 | 762 | 142.5 |
| C | 14 | 238 | 121116 | 695.13 | 760 | 766 | 173.1 |
| C | 10 | 22 | 18910 | 104.8 | 760 | 766 | 173.1 |
| C | 0 | 207 | 10679 | 57.25 | 760 | 766 | 173.1 |
| D | 12 | 233 | 130025 | 695.77 | 778 | 757 | 185.8 |
| D | 1 | 52 | 105027 | 561.22 | 778 | 757 | 185.8 |
| D | 9 | 85 | 87243 | 465.5 | 778 | 757 | 185.8 |
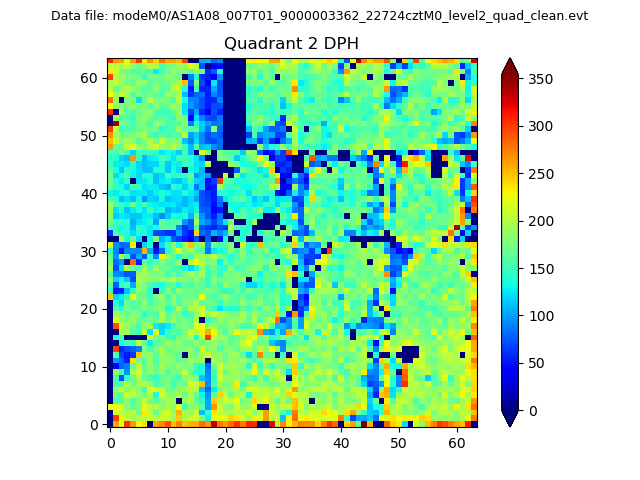
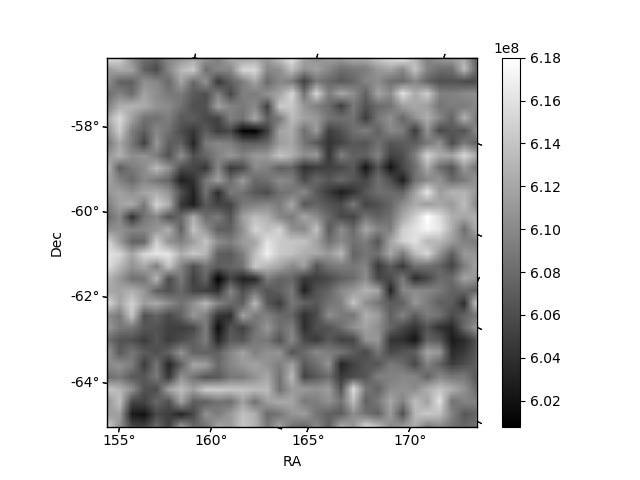
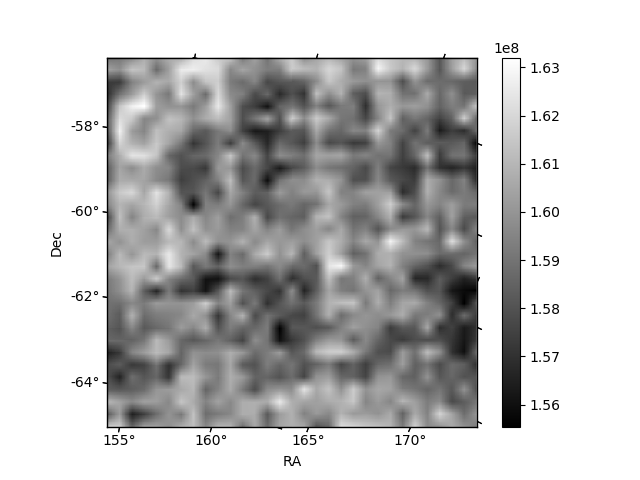
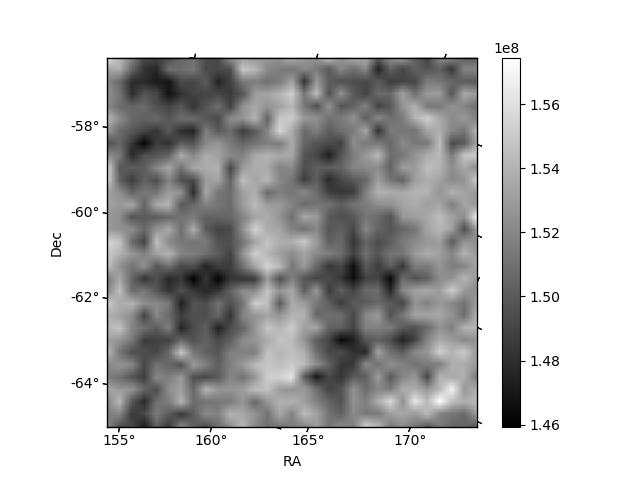
Histogram calculated using DETX and DETY for each event in the final _common_clean file
| Quadrant A | 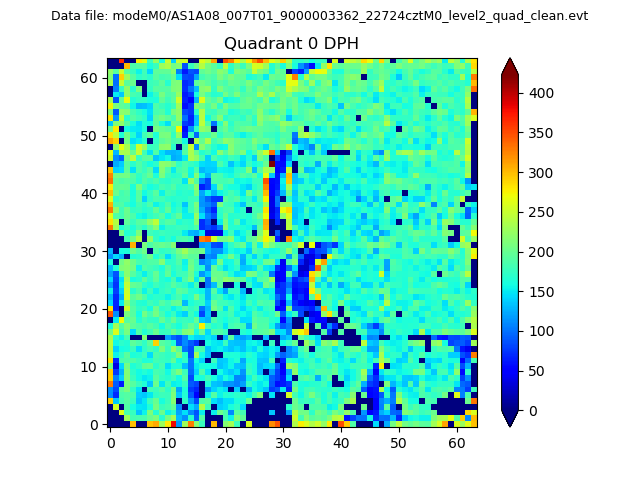 |
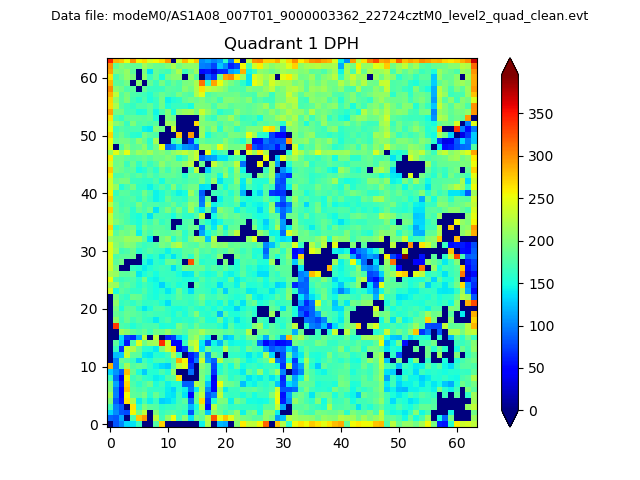 |
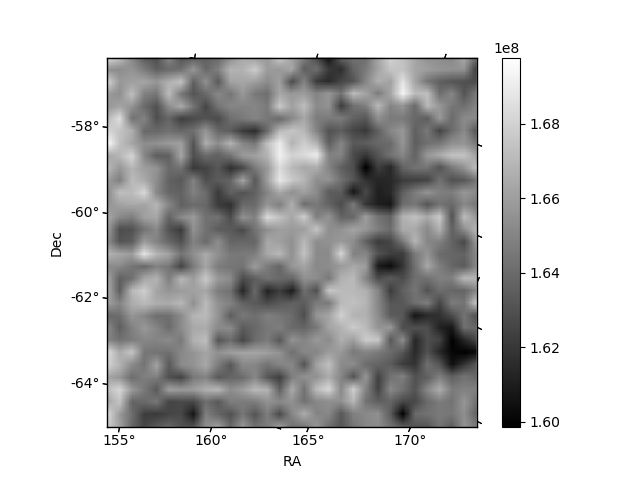
Quadrant B |
|---|---|---|---|
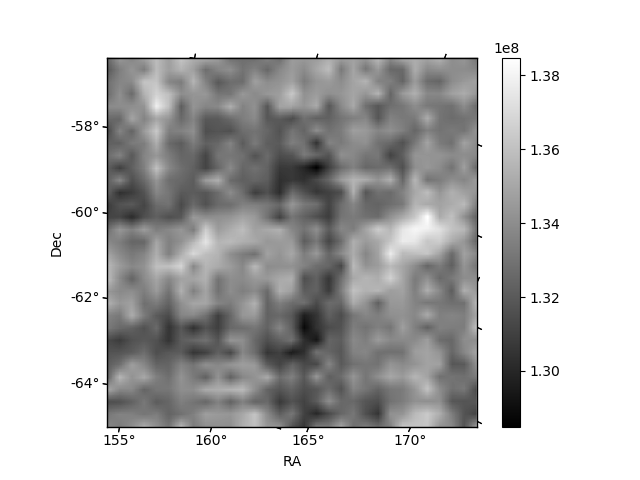
| Quadrant D | 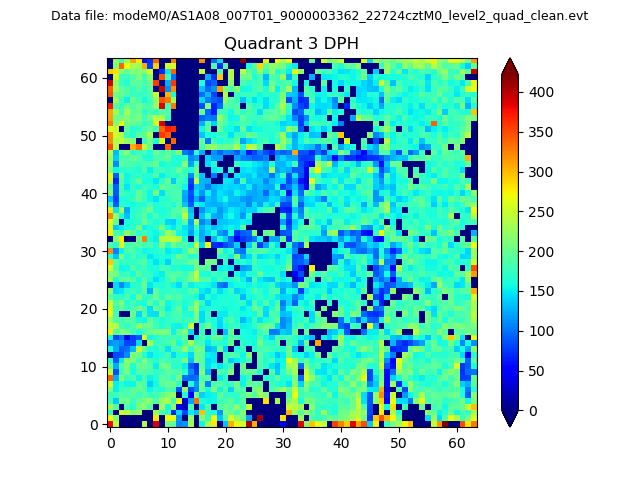 |
 |
Quadrant C |
| Plot type | Count rate plots | Images |
|---|---|---|
| Comparison with Poisson distribution Blue bars denote a histogram of data divided into 1 sec bins. Red curve is a Poisson curve with rate = median count rate of data. |
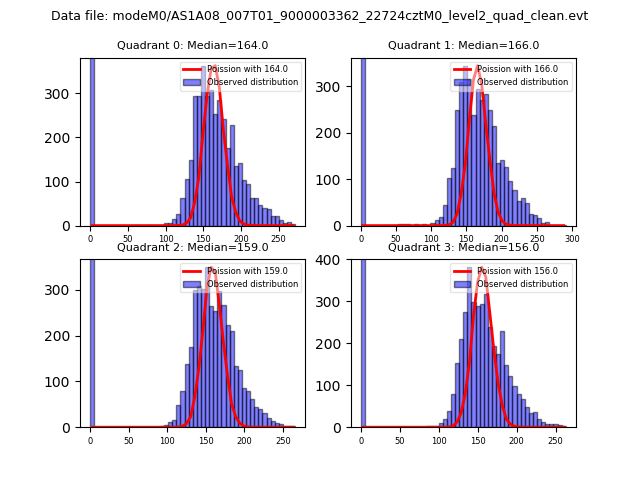 |
 |
| Quadrant-wise count rates Data is divided into 100 sec bins |
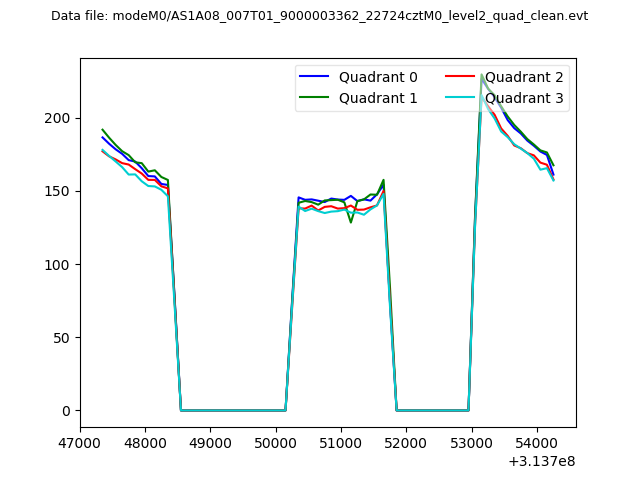 |
|
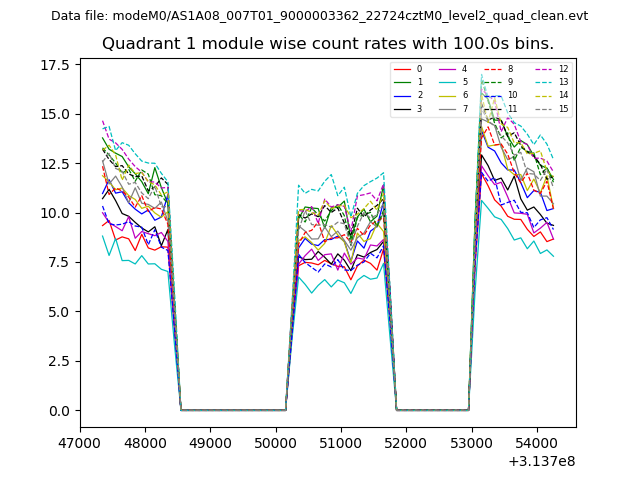
| Module-wise count rates for Quadrant A Data is divided into 100 sec bins |
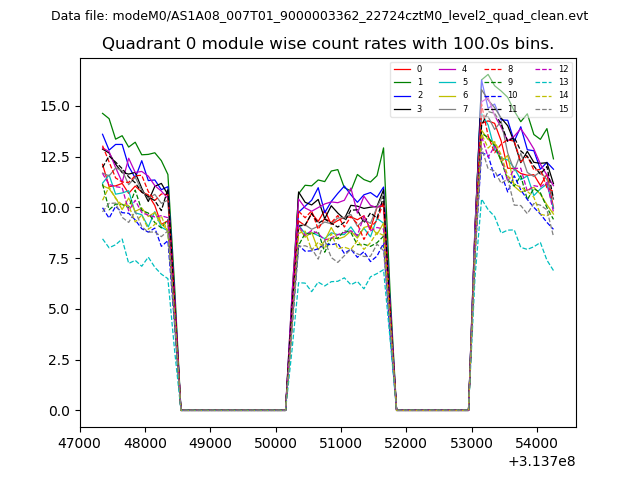 |
 |
| Module-wise count rates for Quadrant B Data is divided into 100 sec bins |
 |
 |
| Module-wise count rates for Quadrant C Data is divided into 100 sec bins |
 |
 |
| Module-wise count rates for Quadrant D Data is divided into 100 sec bins |
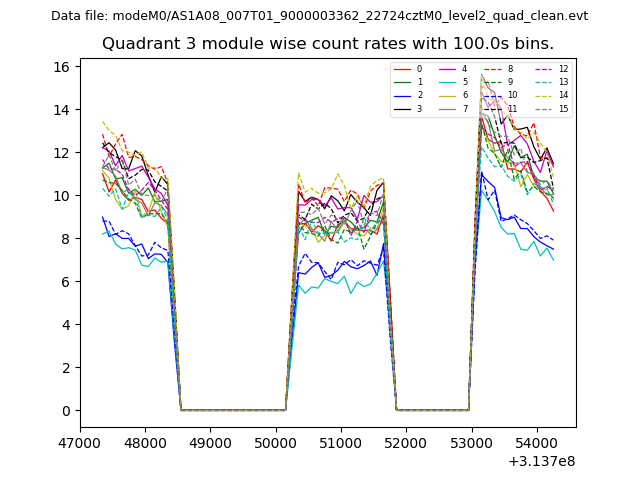 |
 |
| Parameter | Plot |
|---|---|
| CZT HV Monitor | 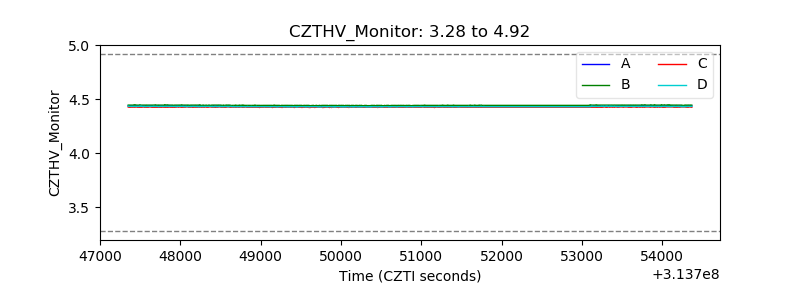 |
| D_VDD | 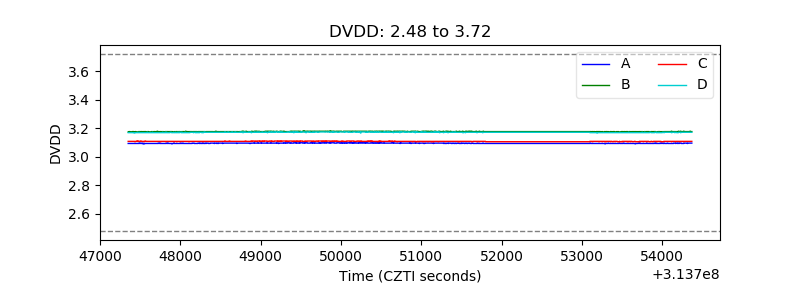 |
| Temperature 1 | 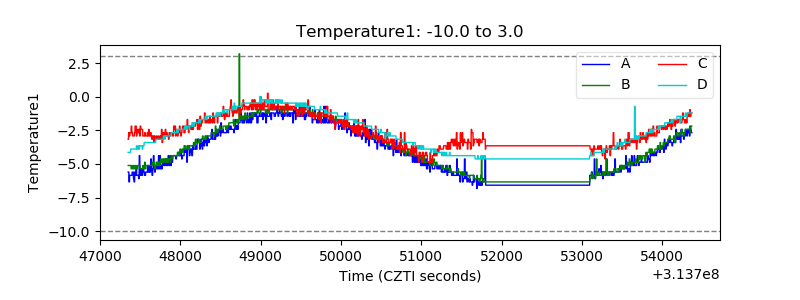 |
| Veto HV Monitor | 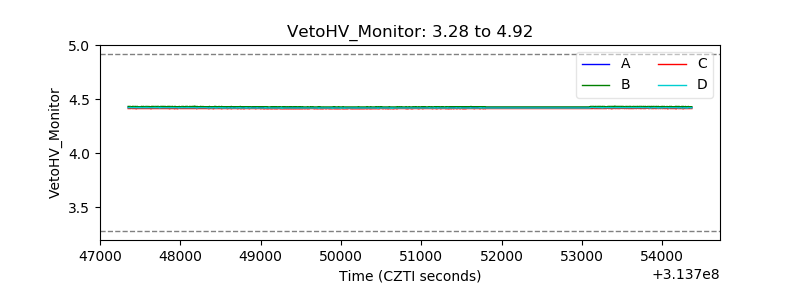 |
| Veto LLD | 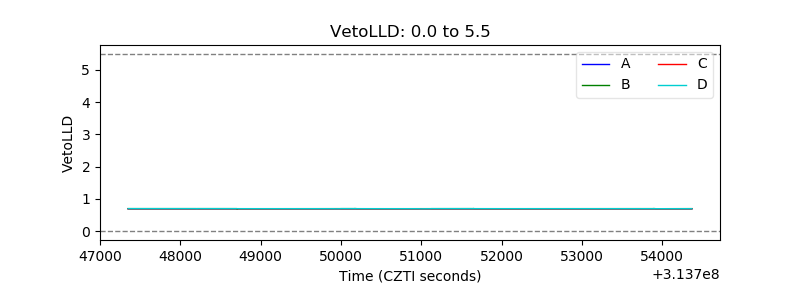 |
| Alpha Counter | 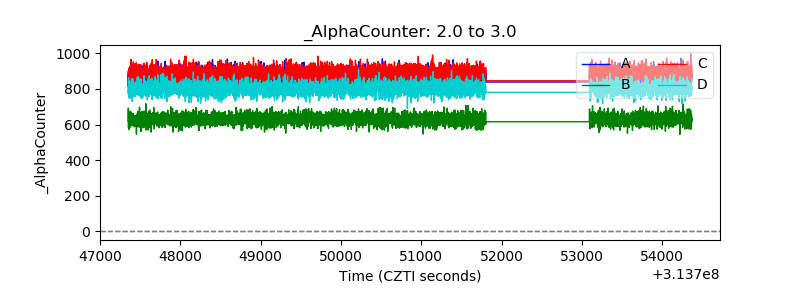 |
| _CPM_Rate | 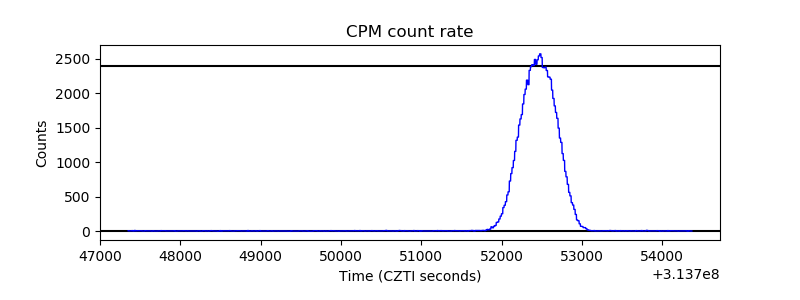 |
| CZT Counter | 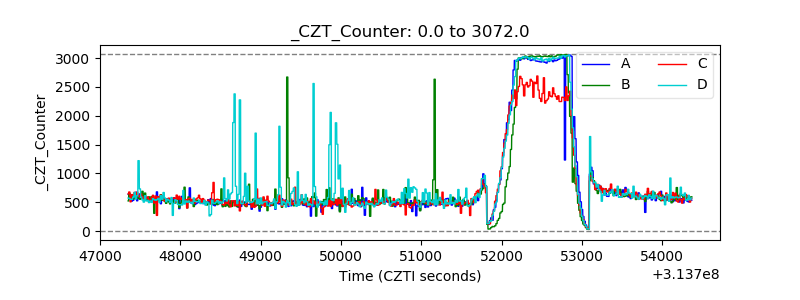 |
| +2.5 Volts monitor |  |
| +5 Volts monitor |  |
| _ROLL_ROT | 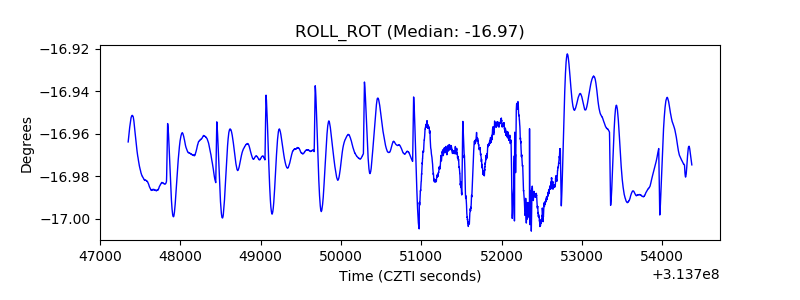 |
| _Roll_DEC | 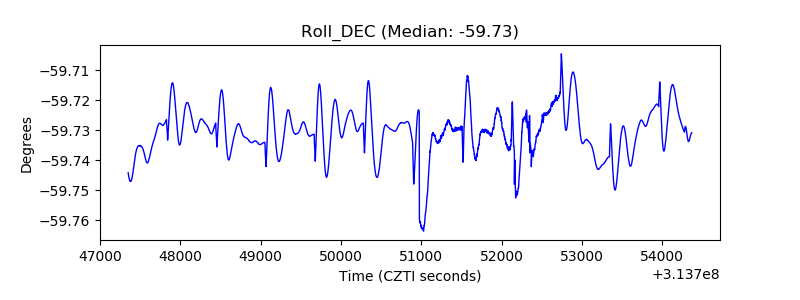 |
| _Roll_RA | 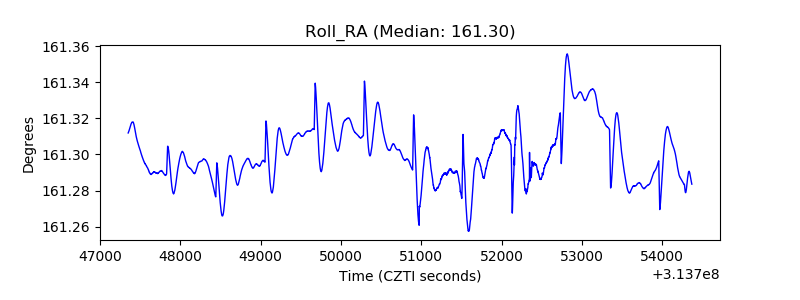 |
| Veto Counter | 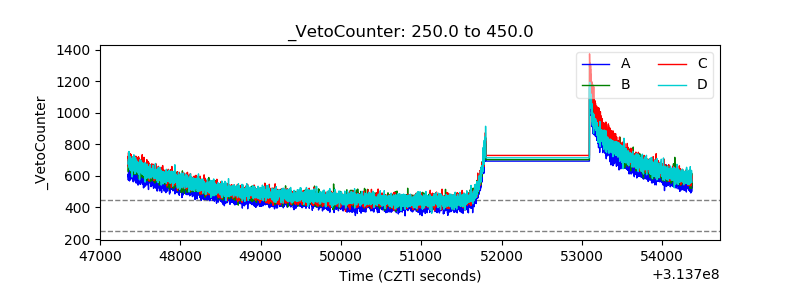 |