| Param | Original file | Final file |
|---|---|---|
| Filename | modeM0/AS1A08_007T01_9000003362_22725cztM0_level2.evt | modeM0/AS1A08_007T01_9000003362_22725cztM0_level2_quad_clean.evt |
| Size (bytes) | 522,630,720 | 84,504,960 |
| Size | 498.4 MB | 80.6 MB |
| Events in quadrant A | 3,205,924 | 569,827 |
| Events in quadrant B | 3,289,454 | 575,186 |
| Events in quadrant C | 3,260,626 | 540,944 |
| Events in quadrant D | 5,671,155 | 459,678 |
| Mode SS | |||
|---|---|---|---|
| Quadrant | BADHDUFLAG | Total packets | Discarded packets |
| A | 0 | 122 | 0 |
| B | 0 | 122 | 0 |
| C | 0 | 122 | 0 |
| D | 0 | 122 | 0 |
| Mode M0 | |||
|---|---|---|---|
| Quadrant | BADHDUFLAG | Total packets | Discarded packets |
| A | 0 | 13059 | 1 |
| B | 0 | 13283 | 1 |
| C | 0 | 13191 | 1 |
| D | 0 | 20754 | 1 |
| Mode M9 | |||
|---|---|---|---|
| Quadrant | BADHDUFLAG | Total packets | Discarded packets |
| A | 0 | 13 | 0 |
| B | 0 | 13 | 0 |
| C | 0 | 13 | 0 |
| D | 0 | 13 | 0 |
| Quadrant | Total seconds | Saturated seconds | Saturation percentage |
|---|---|---|---|
| A | 5904 | 77 | 1.304201% |
| B | 5905 | 84 | 1.422523% |
| C | 5905 | 118 | 1.998307% |
| D | 5905 | 939 | 15.901778% |
Noise dominated data is calculated using 1-second bins in cleaned event files. If a bin has >2000 counts, and if more than 50% of those come from <1% of pixels, then it is considered to be noise-dominated and hence unusable.
| Quadrant | # 1 sec bins | Bins with >0 counts | Bins with >2000 counts | High rate bins dominated by noise | Noise dominated (total time) | Noise dominated (detector-on time) | Marked lightcurve |
|---|---|---|---|---|---|---|---|
| A | 7249 | 5905 | 0 | 0 | 0.00% | 0.00% | 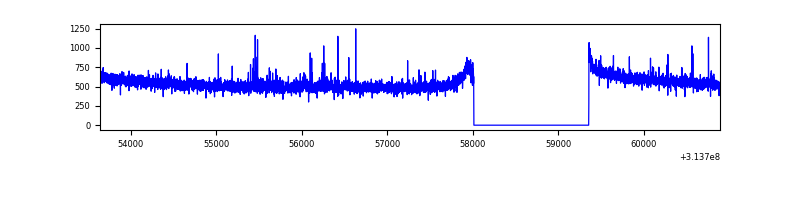 |
| B | 7250 | 5906 | 0 | 0 | 0.00% | 0.00% | 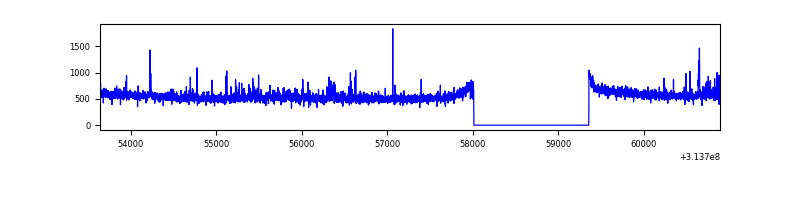 |
| C | 7250 | 5906 | 1 | 1 | 0.01% | 0.02% | 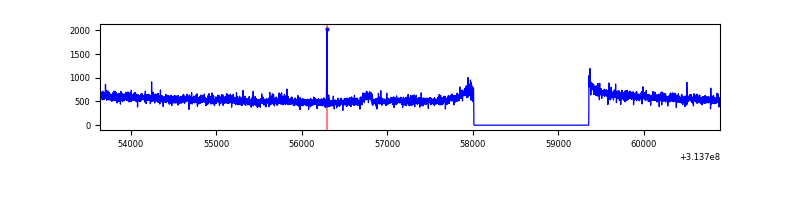 |
| D | 7250 | 5906 | 729 | 729 | 10.06% | 12.34% | 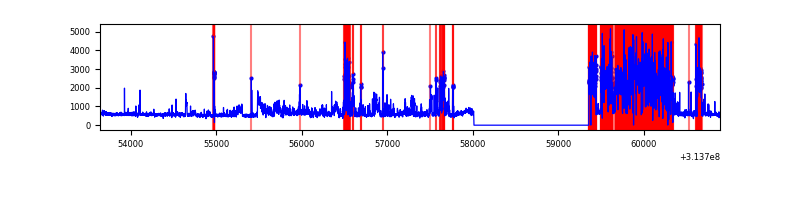 |
Top three noisy pixels from each quadrant. If the there are fewer than three noisy pixels in the level2.evt file, extra rows are filled as -1
| Pixel properties | Quadrant properties | ||||||
|---|---|---|---|---|---|---|---|
| Quadrant | DetID | PixID | Counts | Sigma | Mean | Median | Sigma |
| A | 10 | 17 | 20745 | 122.42 | 824 | 808 | 162.9 |
| A | 13 | 254 | 10787 | 61.27 | 824 | 808 | 162.9 |
| A | 0 | 226 | 7452 | 40.79 | 824 | 808 | 162.9 |
| B | 0 | 228 | 34847 | 227.75 | 812 | 796 | 149.5 |
| B | 0 | 190 | 31208 | 203.41 | 812 | 796 | 149.5 |
| B | 0 | 197 | 21967 | 141.6 | 812 | 796 | 149.5 |
| C | 14 | 238 | 125975 | 699.67 | 783 | 792 | 178.9 |
| C | 0 | 207 | 38032 | 208.14 | 783 | 792 | 178.9 |
| C | 10 | 91 | 35809 | 195.72 | 783 | 792 | 178.9 |
| D | 1 | 52 | 2453454 | 14206.91 | 730 | 711 | 172.6 |
| D | 12 | 227 | 362348 | 2094.69 | 730 | 711 | 172.6 |
| D | 12 | 233 | 26362 | 148.58 | 730 | 711 | 172.6 |
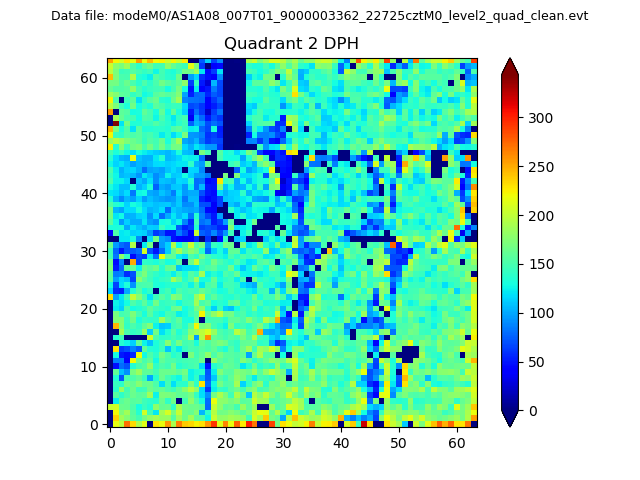
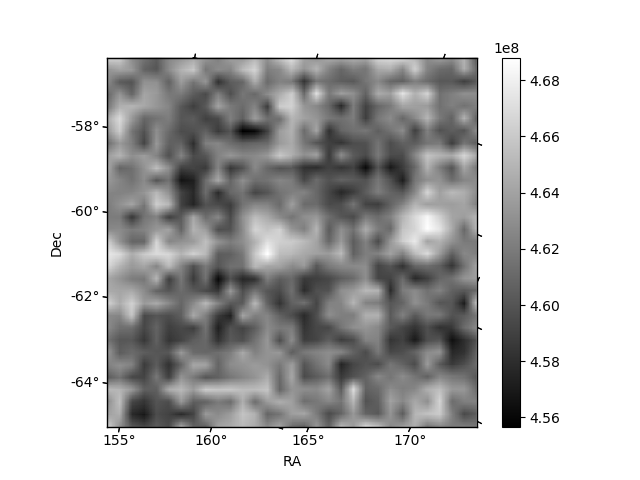
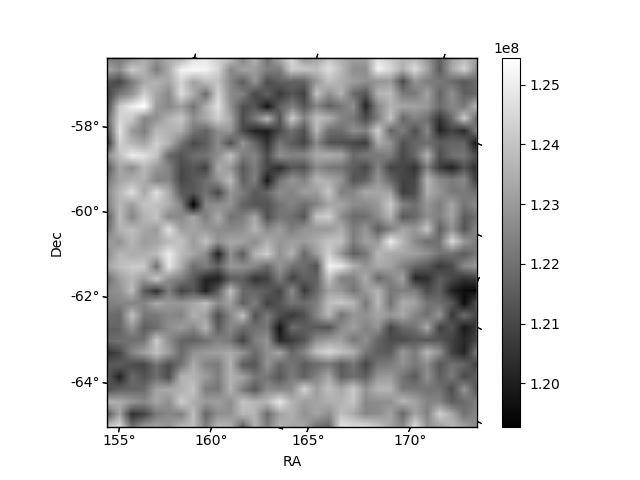
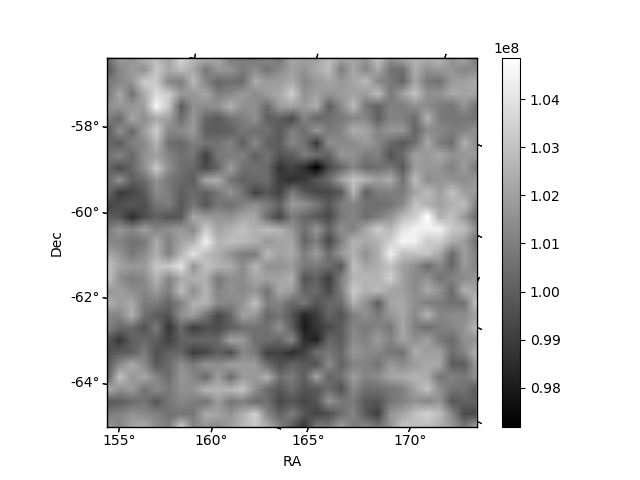
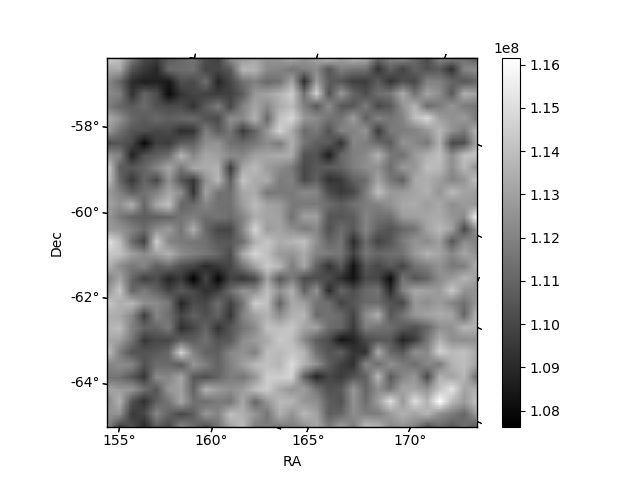
Histogram calculated using DETX and DETY for each event in the final _common_clean file
| Quadrant A | 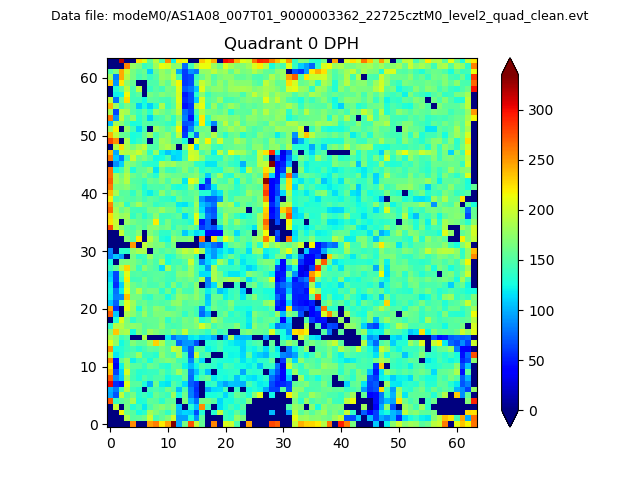 |
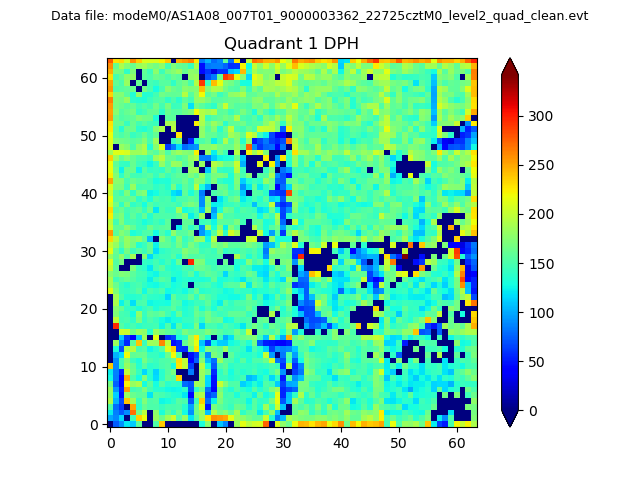 |
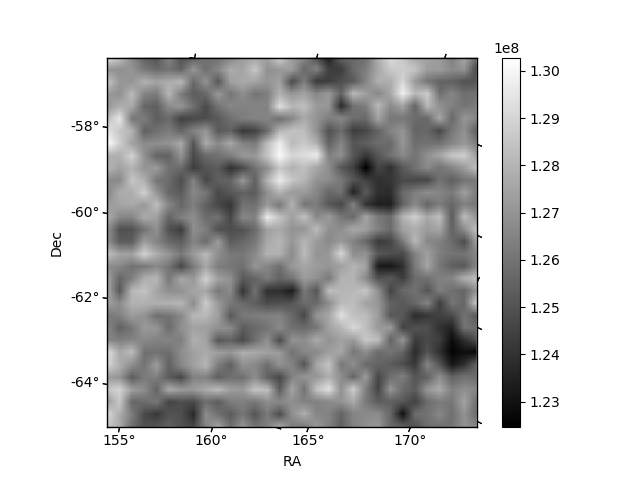
Quadrant B |
|---|---|---|---|
| Quadrant D | 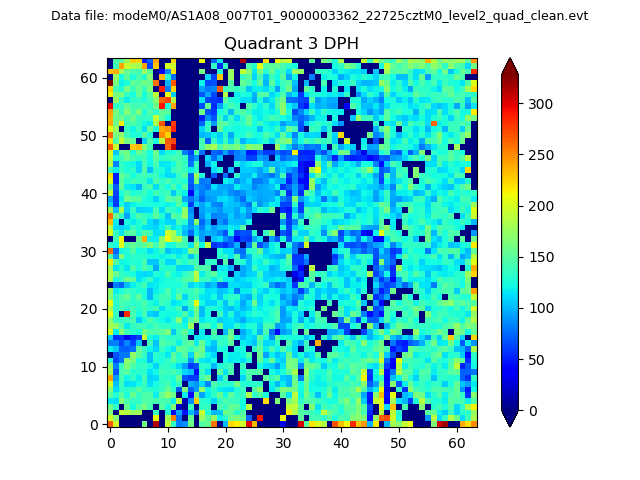 |
 |
Quadrant C |
| Plot type | Count rate plots | Images |
|---|---|---|
| Comparison with Poisson distribution Blue bars denote a histogram of data divided into 1 sec bins. Red curve is a Poisson curve with rate = median count rate of data. |
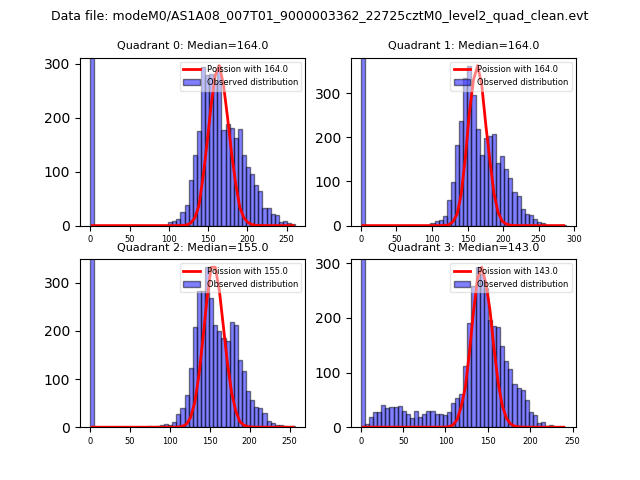 |
 |
| Quadrant-wise count rates Data is divided into 100 sec bins |
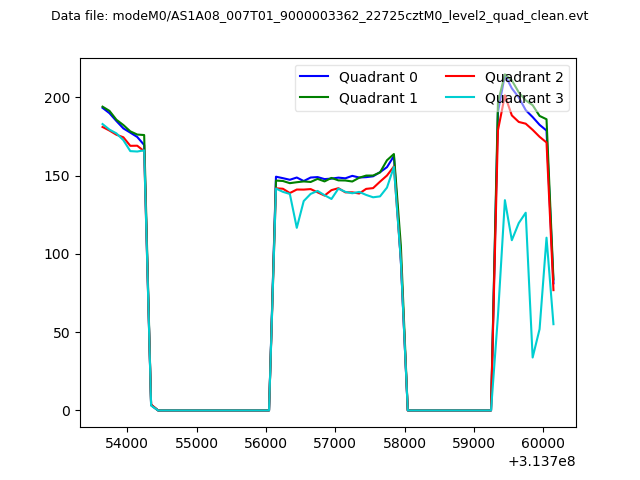 |
|
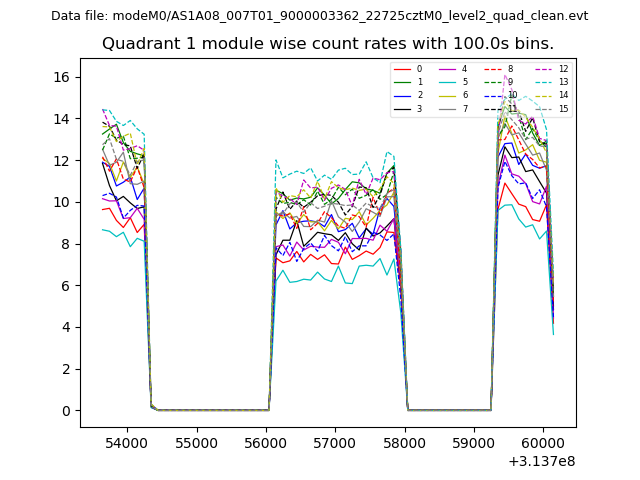
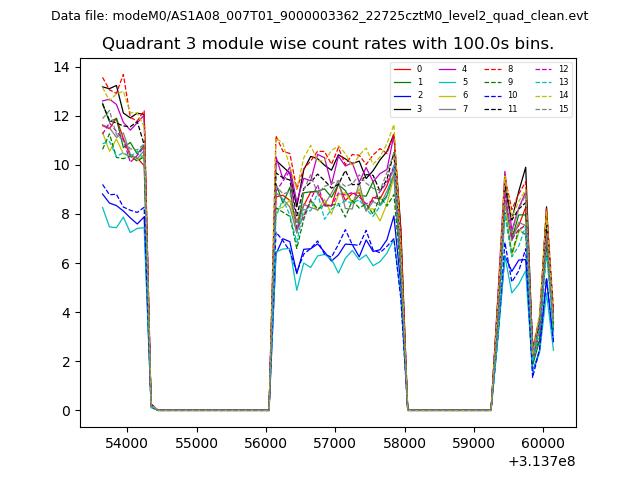
| Module-wise count rates for Quadrant A Data is divided into 100 sec bins |
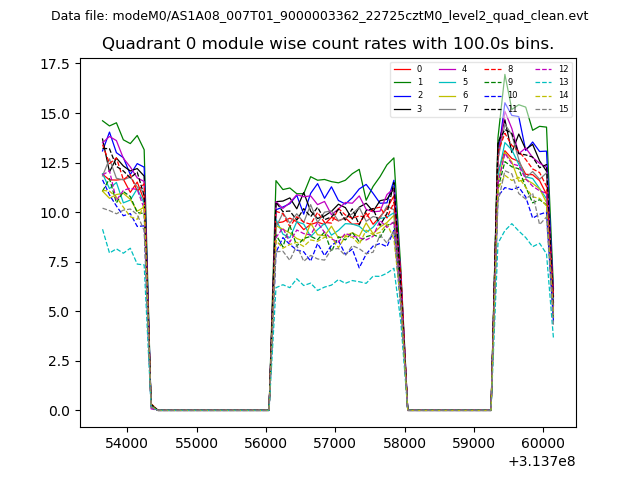 |
 |
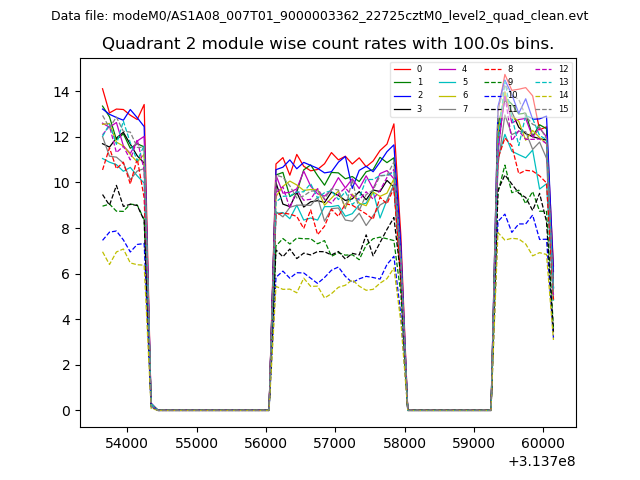
| Module-wise count rates for Quadrant B Data is divided into 100 sec bins |
 |
 |
| Module-wise count rates for Quadrant C Data is divided into 100 sec bins |
 |
 |
| Module-wise count rates for Quadrant D Data is divided into 100 sec bins |
 |
 |
| Parameter | Plot |
|---|---|
| CZT HV Monitor | 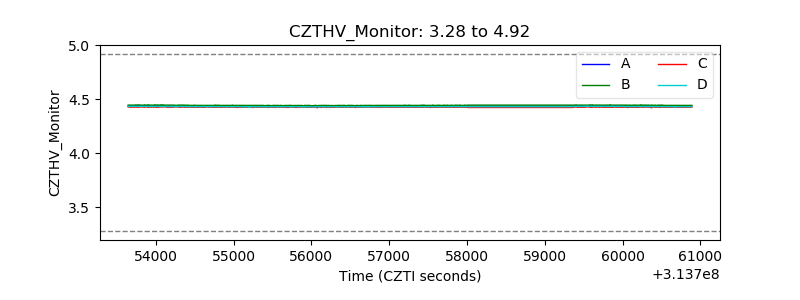 |
| D_VDD | 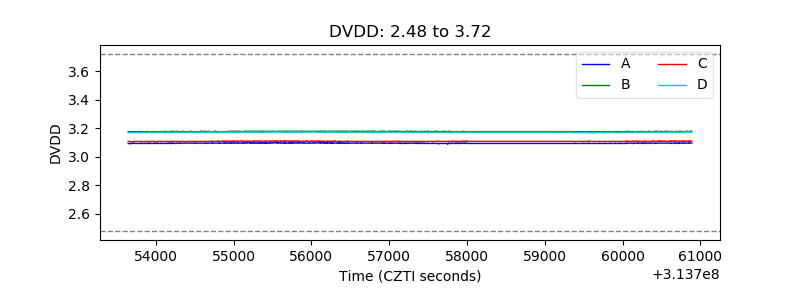 |
| Temperature 1 | 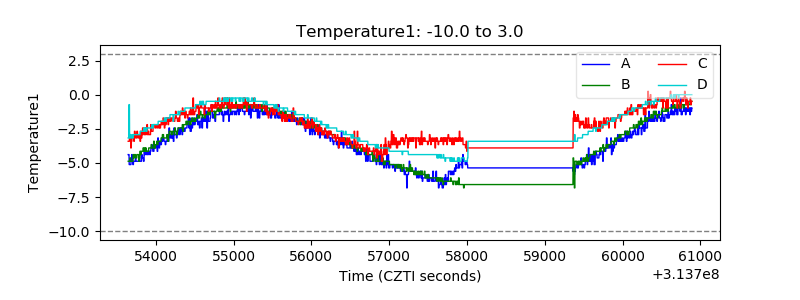 |
| Veto HV Monitor | 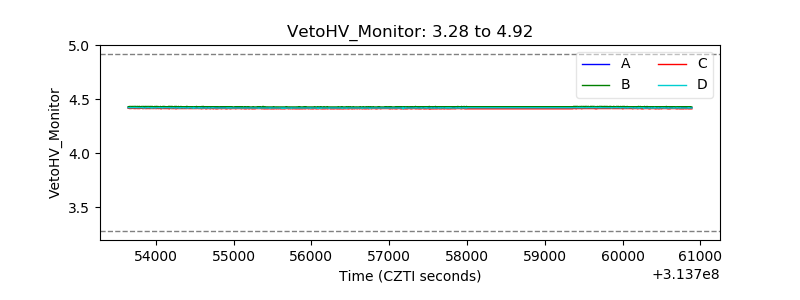 |
| Veto LLD | 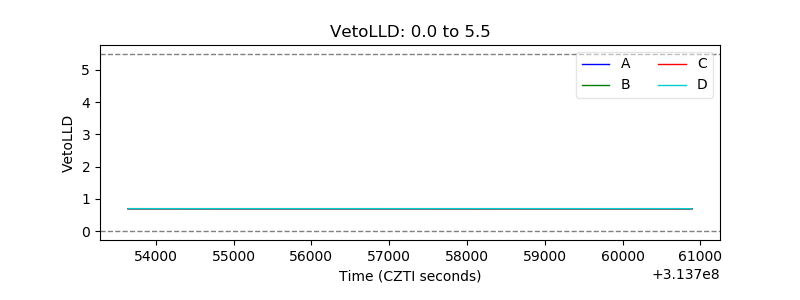 |
| Alpha Counter | 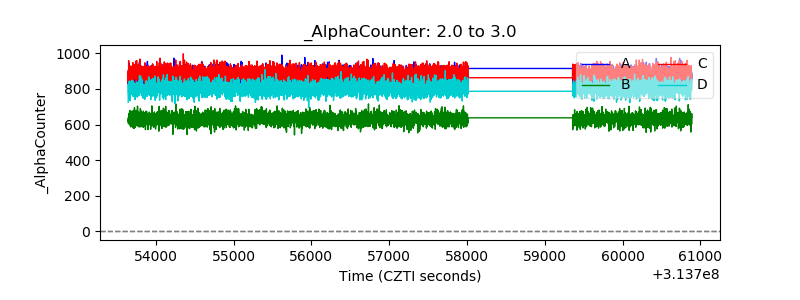 |
| _CPM_Rate | 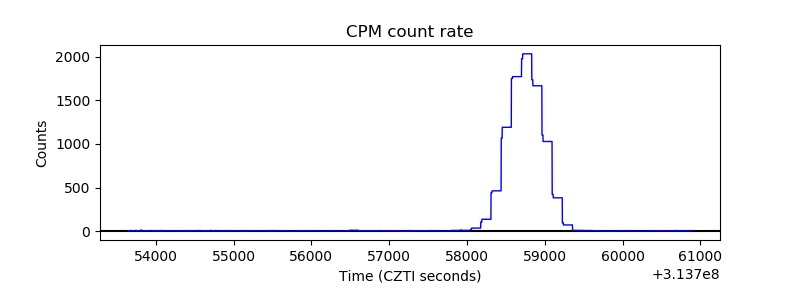 |
| CZT Counter | 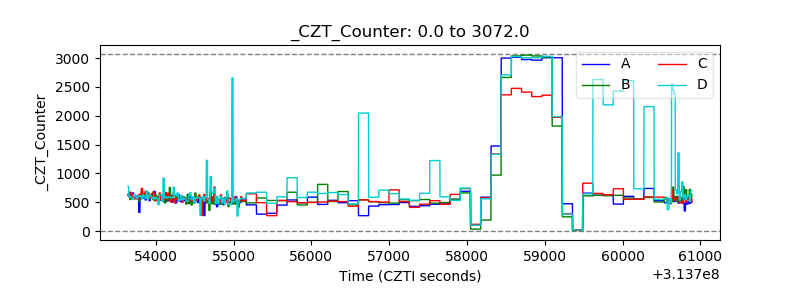 |
| +2.5 Volts monitor | 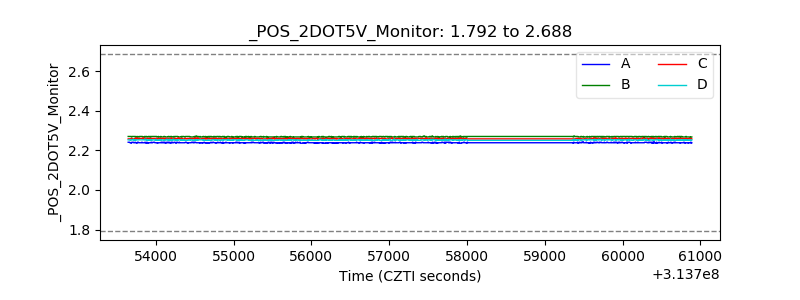 |
| +5 Volts monitor |  |
| _ROLL_ROT | 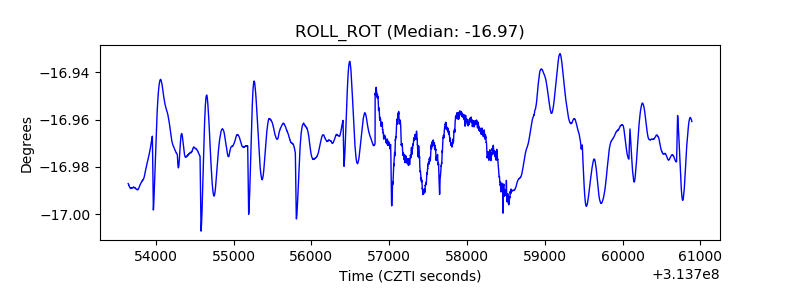 |
| _Roll_DEC | 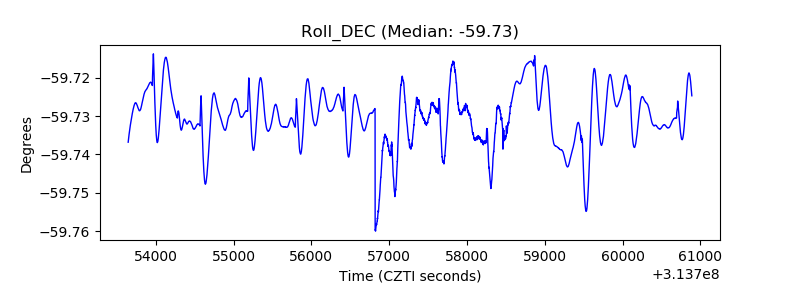 |
| _Roll_RA | 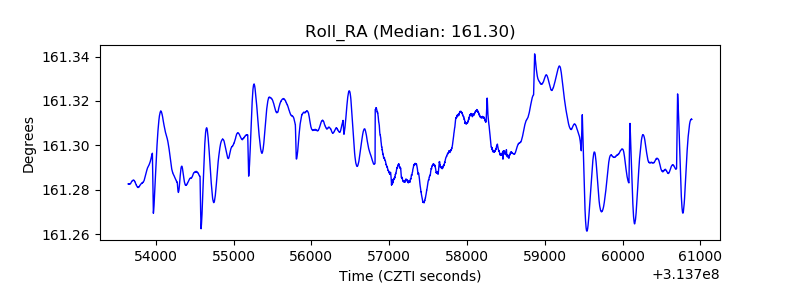 |
| Veto Counter | 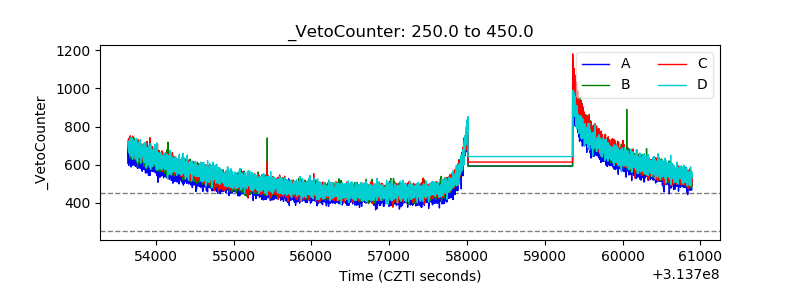 |