| Param | Original file | Final file |
|---|---|---|
| Filename | modeM0/AS1A08_007T01_9000003362_22726cztM0_level2.evt | modeM0/AS1A08_007T01_9000003362_22726cztM0_level2_quad_clean.evt |
| Size (bytes) | 503,265,600 | 74,514,240 |
| Size | 480.0 MB | 71.1 MB |
| Events in quadrant A | 3,458,682 | 476,747 |
| Events in quadrant B | 3,358,274 | 483,557 |
| Events in quadrant C | 3,201,934 | 454,399 |
| Events in quadrant D | 4,811,844 | 418,591 |
| Mode SS | |||
|---|---|---|---|
| Quadrant | BADHDUFLAG | Total packets | Discarded packets |
| A | 0 | 124 | 0 |
| B | 0 | 124 | 0 |
| C | 0 | 124 | 0 |
| D | 0 | 124 | 0 |
| Mode M0 | |||
|---|---|---|---|
| Quadrant | BADHDUFLAG | Total packets | Discarded packets |
| A | 0 | 13876 | 0 |
| B | 0 | 13516 | 0 |
| C | 0 | 13024 | 0 |
| D | 0 | 18235 | 0 |
| Mode M9 | |||
|---|---|---|---|
| Quadrant | BADHDUFLAG | Total packets | Discarded packets |
| A | 0 | 14 | 0 |
| B | 0 | 14 | 0 |
| C | 0 | 14 | 0 |
| D | 0 | 14 | 0 |
| Quadrant | Total seconds | Saturated seconds | Saturation percentage |
|---|---|---|---|
| A | 6060 | 79 | 1.303630% |
| B | 6061 | 79 | 1.303415% |
| C | 6061 | 106 | 1.748886% |
| D | 6061 | 525 | 8.661937% |
Noise dominated data is calculated using 1-second bins in cleaned event files. If a bin has >2000 counts, and if more than 50% of those come from <1% of pixels, then it is considered to be noise-dominated and hence unusable.
| Quadrant | # 1 sec bins | Bins with >0 counts | Bins with >2000 counts | High rate bins dominated by noise | Noise dominated (total time) | Noise dominated (detector-on time) | Marked lightcurve |
|---|---|---|---|---|---|---|---|
| A | 7390 | 6062 | 0 | 0 | 0.00% | 0.00% | 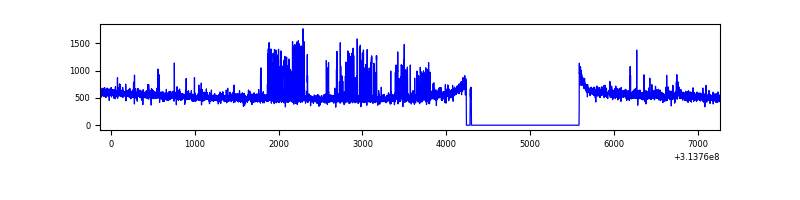 |
| B | 7391 | 6063 | 0 | 0 | 0.00% | 0.00% | 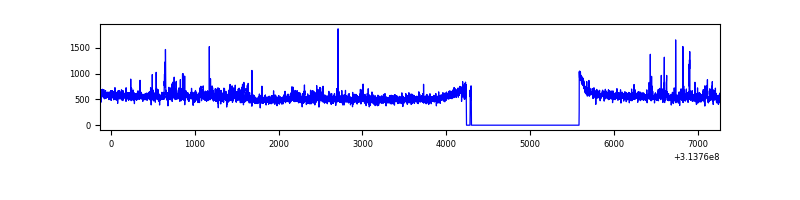 |
| C | 7391 | 6063 | 1 | 1 | 0.01% | 0.02% | 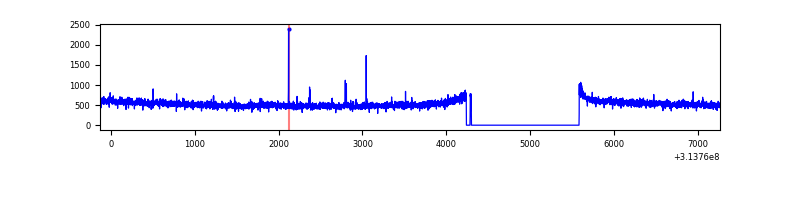 |
| D | 7391 | 6063 | 392 | 392 | 5.30% | 6.47% | 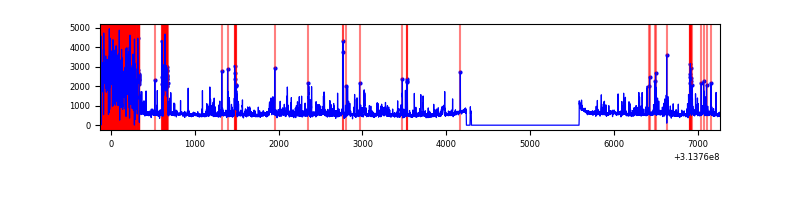 |
Top three noisy pixels from each quadrant. If the there are fewer than three noisy pixels in the level2.evt file, extra rows are filled as -1
| Pixel properties | Quadrant properties | ||||||
|---|---|---|---|---|---|---|---|
| Quadrant | DetID | PixID | Counts | Sigma | Mean | Median | Sigma |
| A | 10 | 17 | 265764 | 1619.78 | 828 | 813 | 163.6 |
| A | 13 | 254 | 10632 | 60.03 | 828 | 813 | 163.6 |
| A | 0 | 226 | 7475 | 40.73 | 828 | 813 | 163.6 |
| B | 0 | 228 | 61969 | 413.64 | 815 | 798 | 147.9 |
| B | 0 | 197 | 48478 | 322.41 | 815 | 798 | 147.9 |
| B | 0 | 190 | 32346 | 213.33 | 815 | 798 | 147.9 |
| C | 14 | 238 | 126108 | 700.77 | 780 | 788 | 178.8 |
| C | 10 | 22 | 11718 | 61.12 | 780 | 788 | 178.8 |
| C | 10 | 91 | 10203 | 52.64 | 780 | 788 | 178.8 |
| D | 1 | 52 | 1601011 | 8780.49 | 763 | 743 | 182.3 |
| D | 12 | 233 | 135401 | 738.85 | 763 | 743 | 182.3 |
| D | 13 | 172 | 60982 | 330.52 | 763 | 743 | 182.3 |
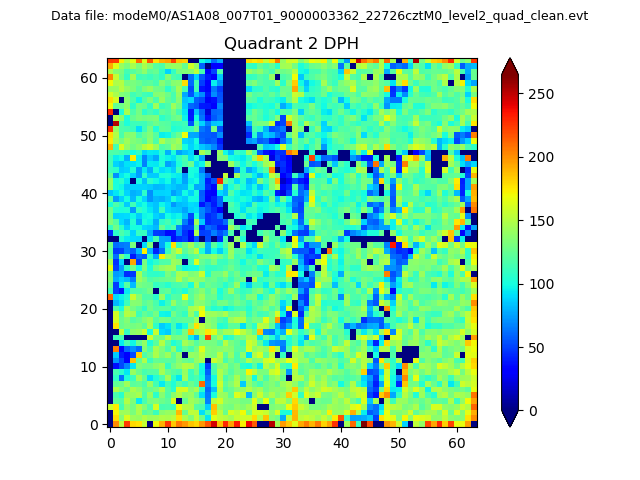
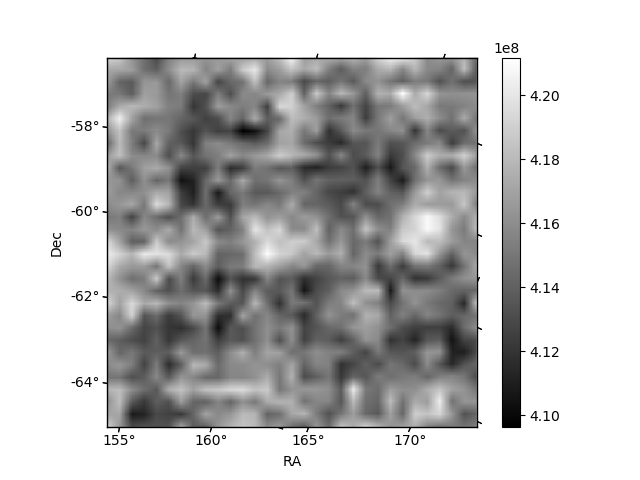
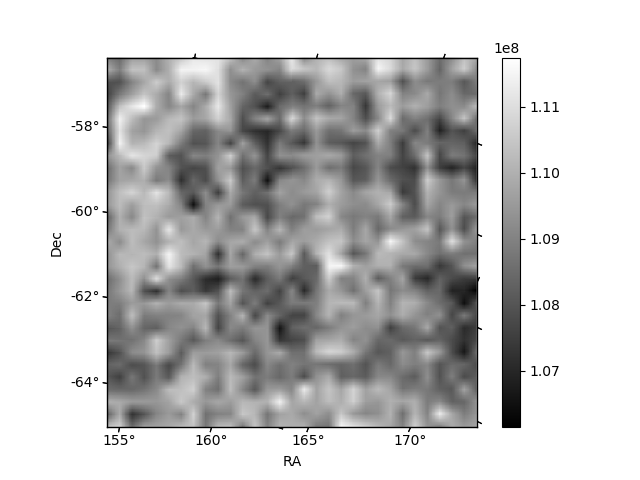
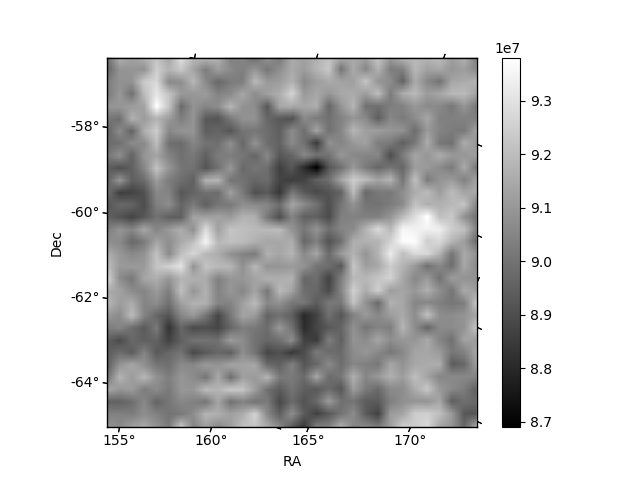
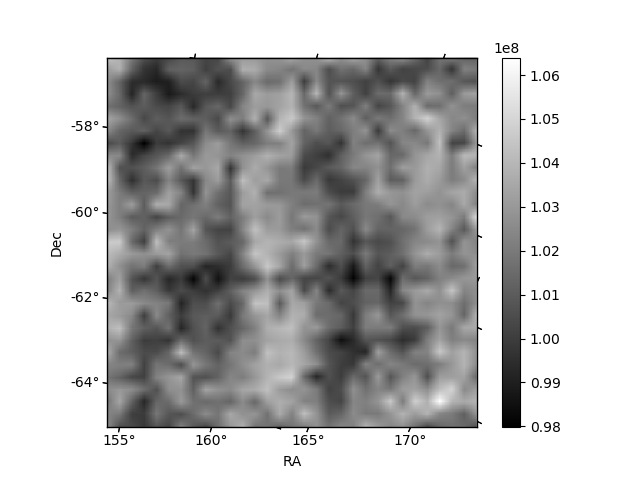
Histogram calculated using DETX and DETY for each event in the final _common_clean file
| Quadrant A | 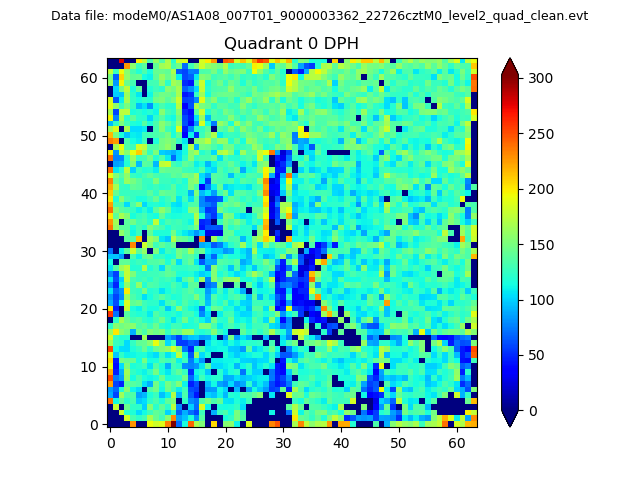 |
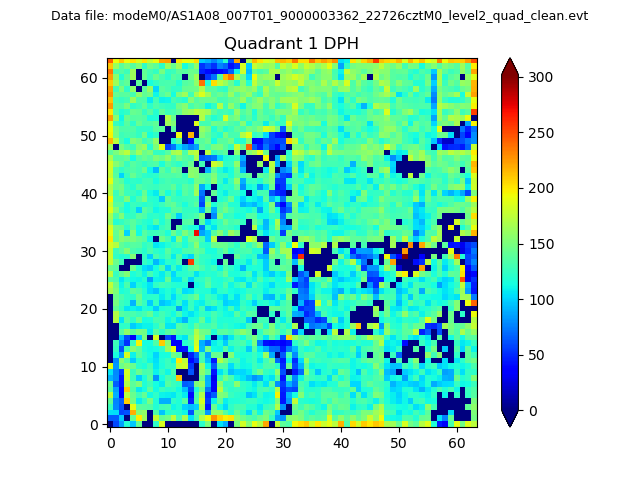 |
Quadrant B |
|---|---|---|---|
| Quadrant D | 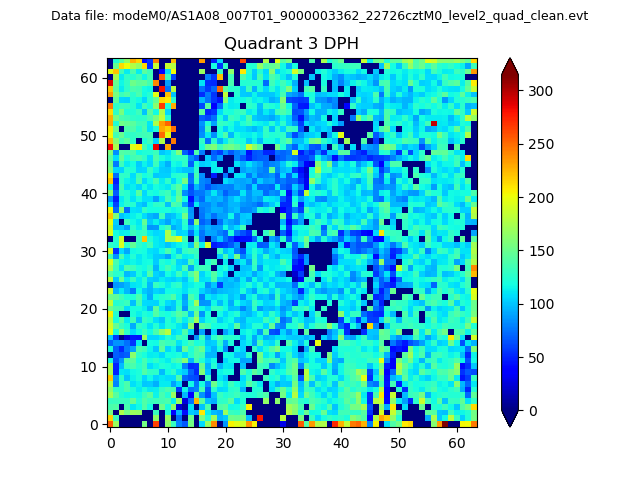 |
 |
Quadrant C |
| Plot type | Count rate plots | Images |
|---|---|---|
| Comparison with Poisson distribution Blue bars denote a histogram of data divided into 1 sec bins. Red curve is a Poisson curve with rate = median count rate of data. |
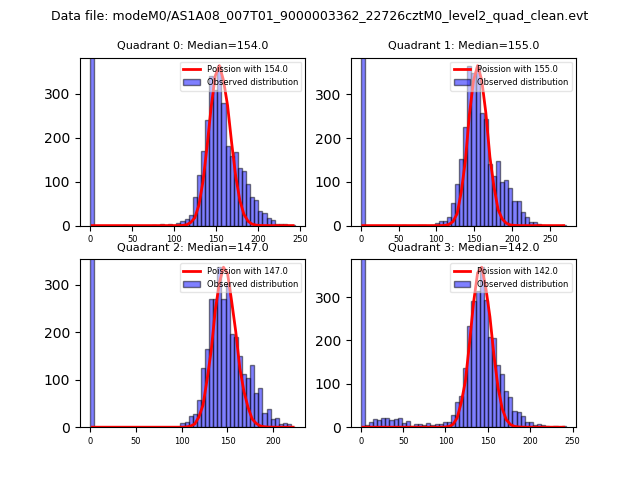 |
 |
| Quadrant-wise count rates Data is divided into 100 sec bins |
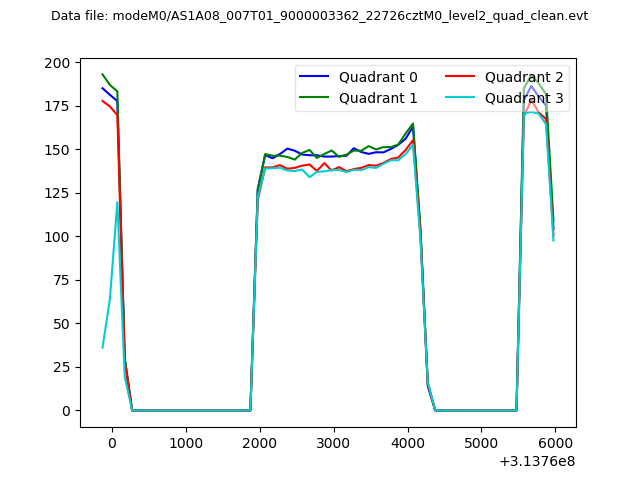 |
|
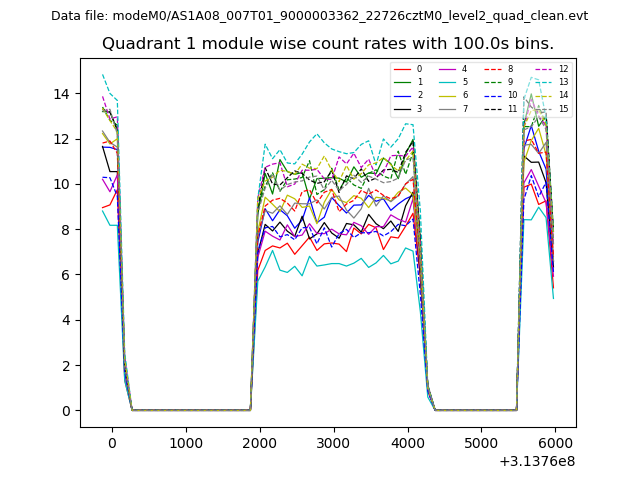
| Module-wise count rates for Quadrant A Data is divided into 100 sec bins |
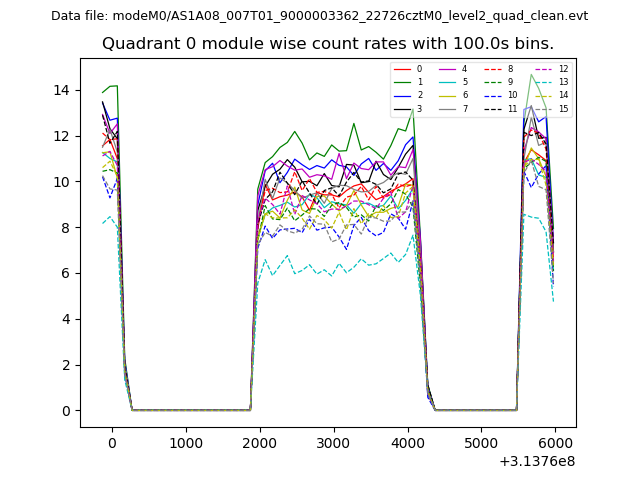 |
 |
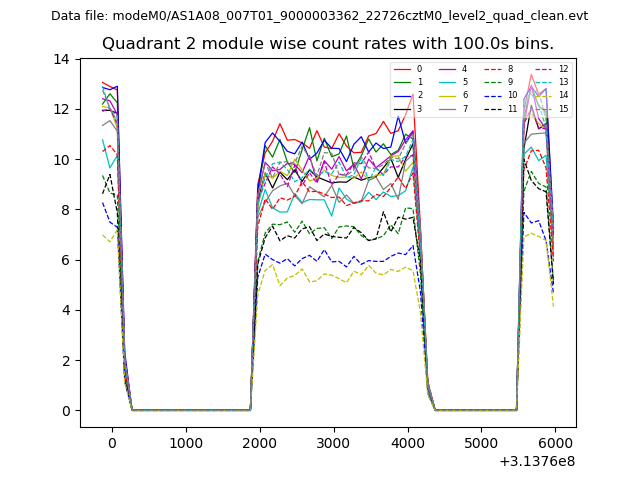
| Module-wise count rates for Quadrant B Data is divided into 100 sec bins |
 |
 |
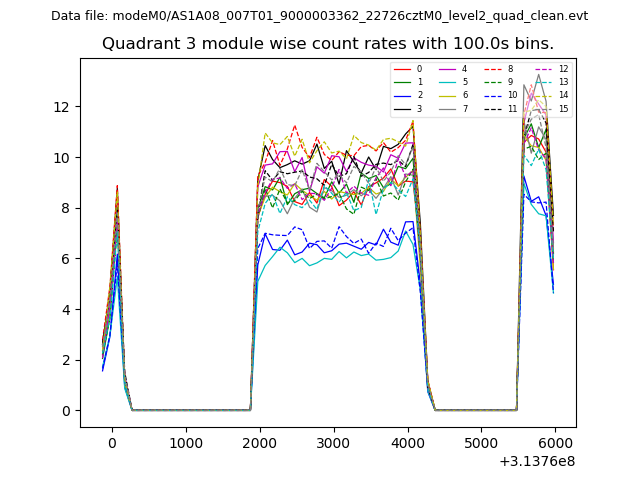
| Module-wise count rates for Quadrant C Data is divided into 100 sec bins |
 |
 |
| Module-wise count rates for Quadrant D Data is divided into 100 sec bins |
 |
 |
| Parameter | Plot |
|---|---|
| CZT HV Monitor | 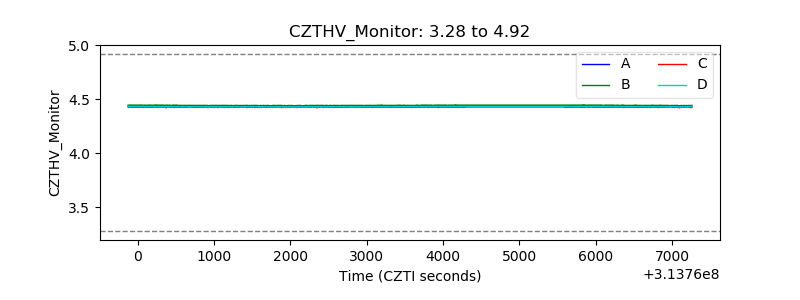 |
| D_VDD | 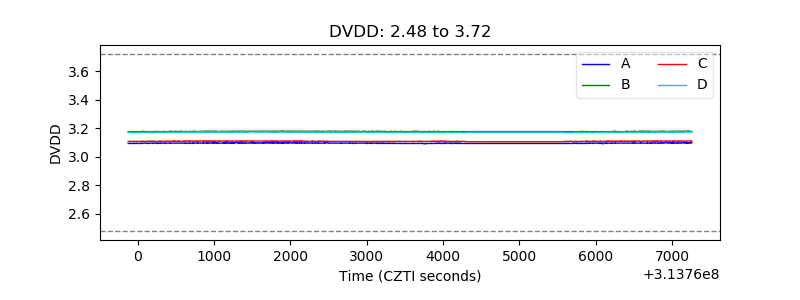 |
| Temperature 1 | 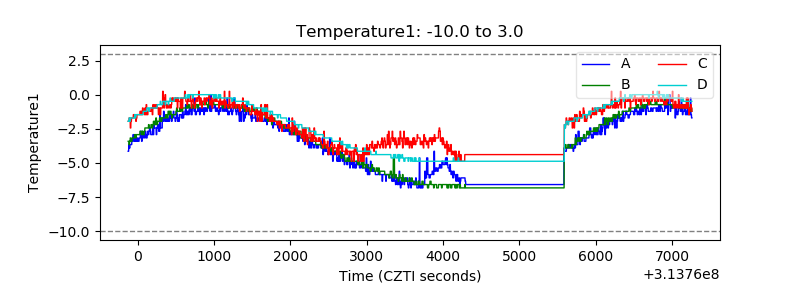 |
| Veto HV Monitor | 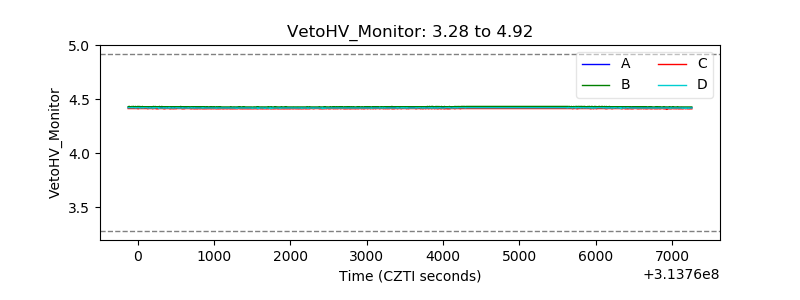 |
| Veto LLD | 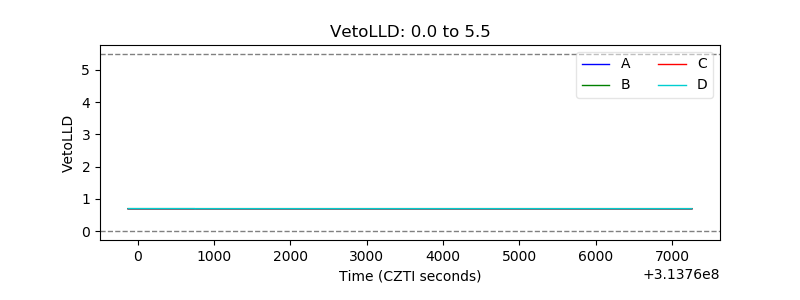 |
| Alpha Counter | 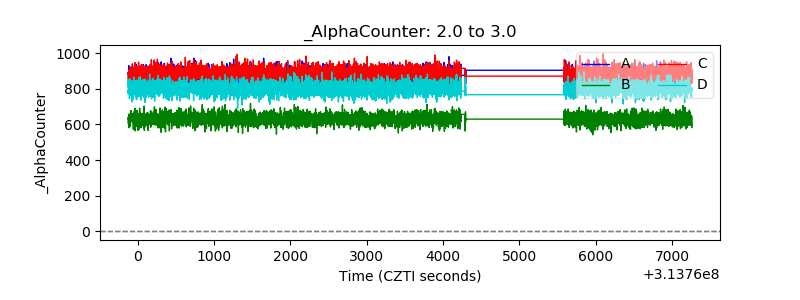 |
| _CPM_Rate | 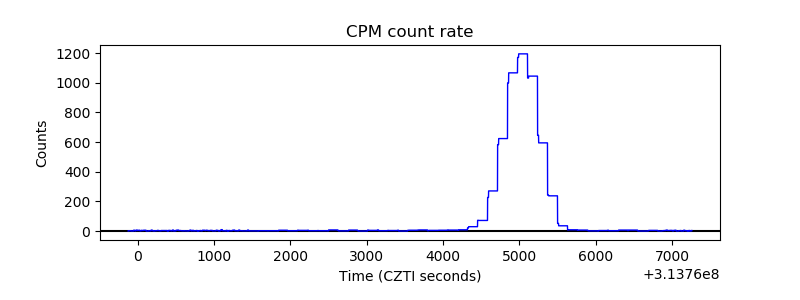 |
| CZT Counter | 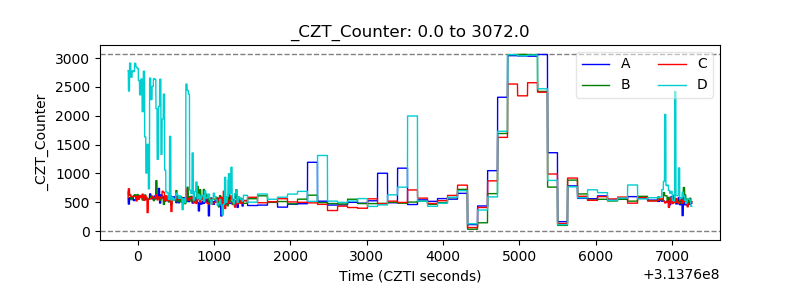 |
| +2.5 Volts monitor |  |
| +5 Volts monitor |  |
| _ROLL_ROT | 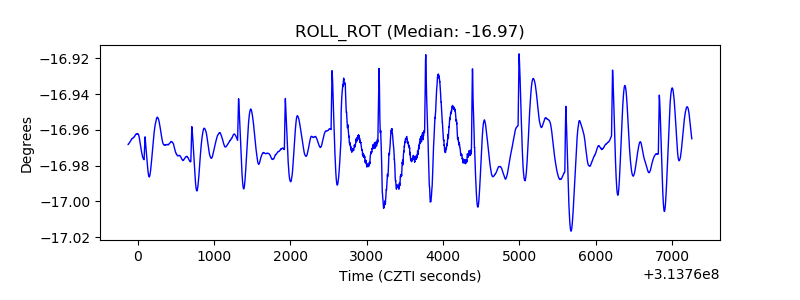 |
| _Roll_DEC | 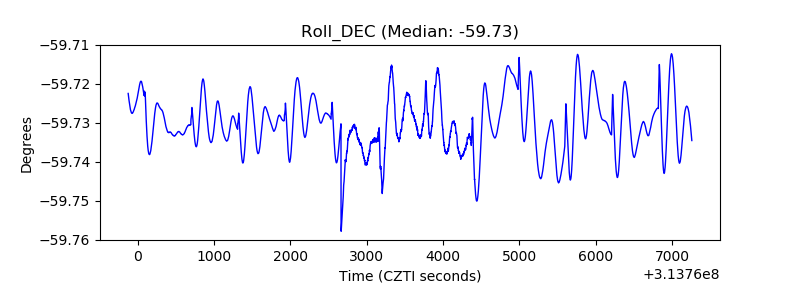 |
| _Roll_RA | 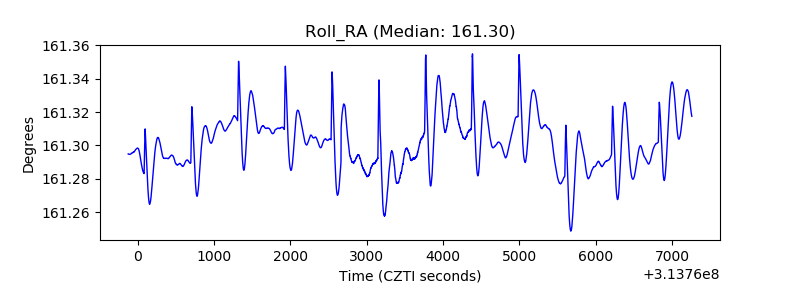 |
| Veto Counter | 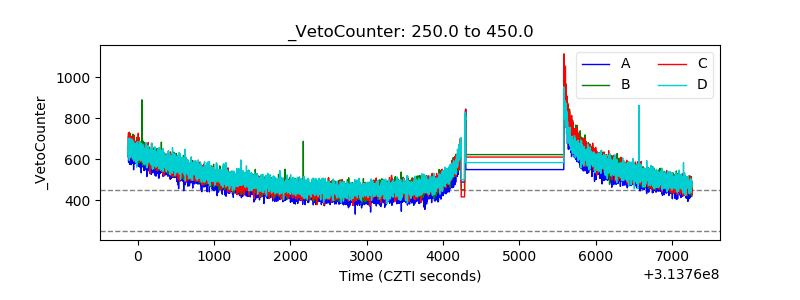 |