| Param | Original file | Final file |
|---|---|---|
| Filename | modeM0/AS1A08_007T01_9000003362_22728cztM0_level2.evt | modeM0/AS1A08_007T01_9000003362_22728cztM0_level2_quad_clean.evt |
| Size (bytes) | 501,445,440 | 82,258,560 |
| Size | 478.2 MB | 78.4 MB |
| Events in quadrant A | 3,419,905 | 513,993 |
| Events in quadrant B | 3,573,507 | 513,147 |
| Events in quadrant C | 3,490,099 | 490,024 |
| Events in quadrant D | 4,225,686 | 484,470 |
| Mode SS | |||
|---|---|---|---|
| Quadrant | BADHDUFLAG | Total packets | Discarded packets |
| A | 0 | 144 | 0 |
| B | 0 | 144 | 0 |
| C | 0 | 144 | 0 |
| D | 0 | 144 | 0 |
| Mode M0 | |||
|---|---|---|---|
| Quadrant | BADHDUFLAG | Total packets | Discarded packets |
| A | 0 | 14535 | 2 |
| B | 0 | 14929 | 3 |
| C | 0 | 14785 | 2 |
| D | 0 | 17084 | 2 |
| Mode M9 | |||
|---|---|---|---|
| Quadrant | BADHDUFLAG | Total packets | Discarded packets |
| A | 0 | 8 | 0 |
| B | 0 | 9 | 0 |
| C | 0 | 9 | 0 |
| D | 0 | 9 | 0 |
| Quadrant | Total seconds | Saturated seconds | Saturation percentage |
|---|---|---|---|
| A | 7020 | 88 | 1.253561% |
| B | 7019 | 112 | 1.595669% |
| C | 7019 | 132 | 1.880610% |
| D | 7019 | 187 | 2.664197% |
Noise dominated data is calculated using 1-second bins in cleaned event files. If a bin has >2000 counts, and if more than 50% of those come from <1% of pixels, then it is considered to be noise-dominated and hence unusable.
| Quadrant | # 1 sec bins | Bins with >0 counts | Bins with >2000 counts | High rate bins dominated by noise | Noise dominated (total time) | Noise dominated (detector-on time) | Marked lightcurve |
|---|---|---|---|---|---|---|---|
| A | 7800 | 7022 | 0 | 0 | 0.00% | 0.00% | 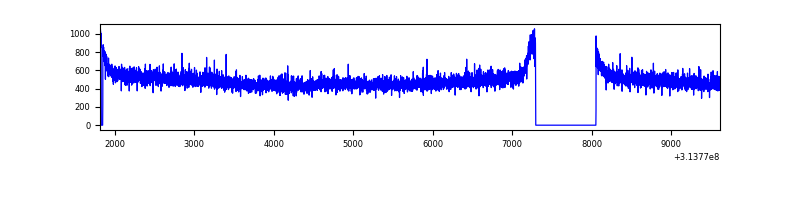 |
| B | 7799 | 7021 | 1 | 1 | 0.01% | 0.01% | 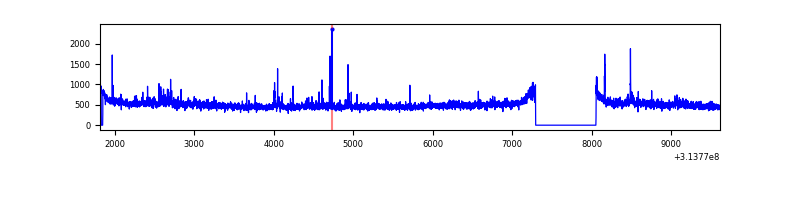 |
| C | 7799 | 7021 | 11 | 11 | 0.14% | 0.16% |  |
| D | 7799 | 7021 | 93 | 93 | 1.19% | 1.32% | 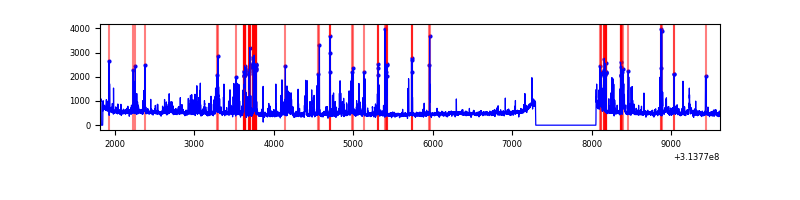 |
Top three noisy pixels from each quadrant. If the there are fewer than three noisy pixels in the level2.evt file, extra rows are filled as -1
| Pixel properties | Quadrant properties | ||||||
|---|---|---|---|---|---|---|---|
| Quadrant | DetID | PixID | Counts | Sigma | Mean | Median | Sigma |
| A | 13 | 254 | 12391 | 65.55 | 883 | 863 | 175.9 |
| A | 10 | 17 | 10736 | 56.14 | 883 | 863 | 175.9 |
| A | 0 | 226 | 7894 | 39.98 | 883 | 863 | 175.9 |
| B | 0 | 245 | 44541 | 267.3 | 875 | 855 | 163.4 |
| B | 0 | 190 | 42842 | 256.91 | 875 | 855 | 163.4 |
| B | 0 | 228 | 28630 | 169.95 | 875 | 855 | 163.4 |
| C | 14 | 238 | 133579 | 682.43 | 839 | 844 | 194.5 |
| C | 10 | 22 | 41120 | 207.07 | 839 | 844 | 194.5 |
| C | 10 | 23 | 40126 | 201.96 | 839 | 844 | 194.5 |
| D | 1 | 52 | 459588 | 2203.41 | 858 | 834 | 208.2 |
| D | 12 | 233 | 205514 | 983.09 | 858 | 834 | 208.2 |
| D | 13 | 172 | 147877 | 706.25 | 858 | 834 | 208.2 |
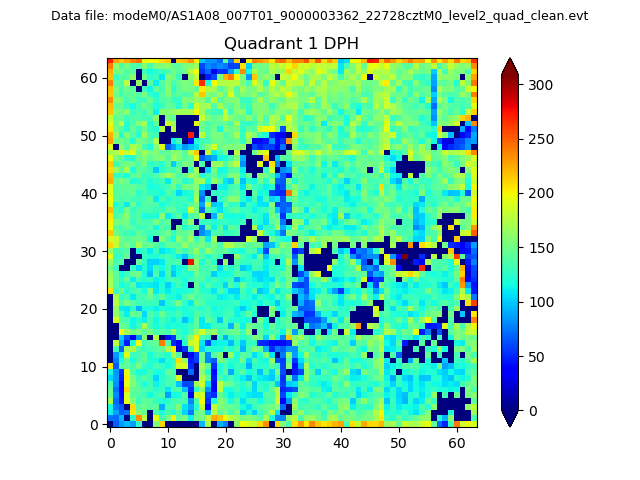
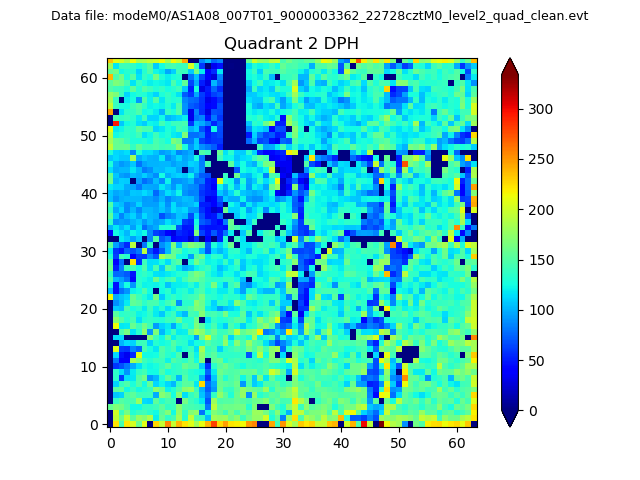
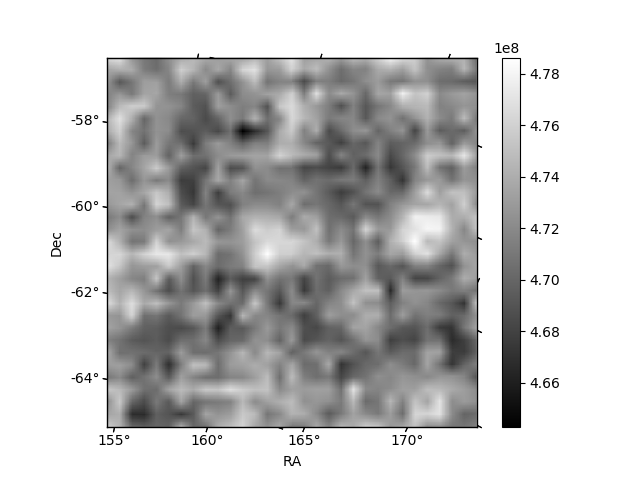
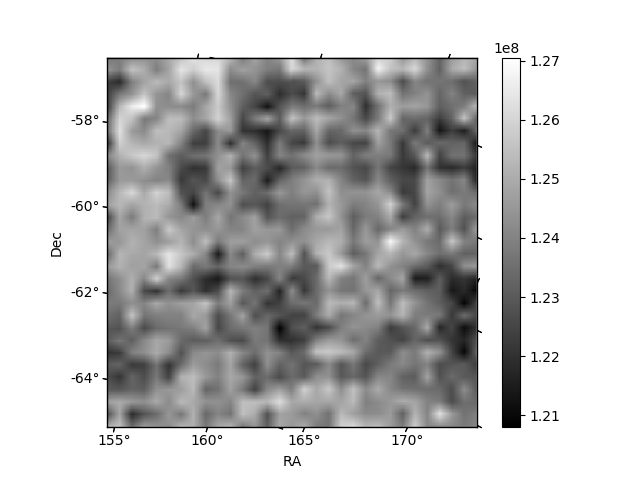
Histogram calculated using DETX and DETY for each event in the final _common_clean file
| Quadrant A | 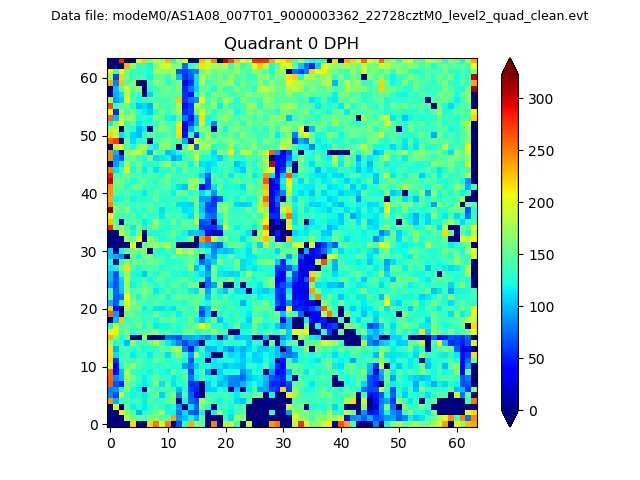 |
 |
Quadrant B |
|---|---|---|---|
| Quadrant D | 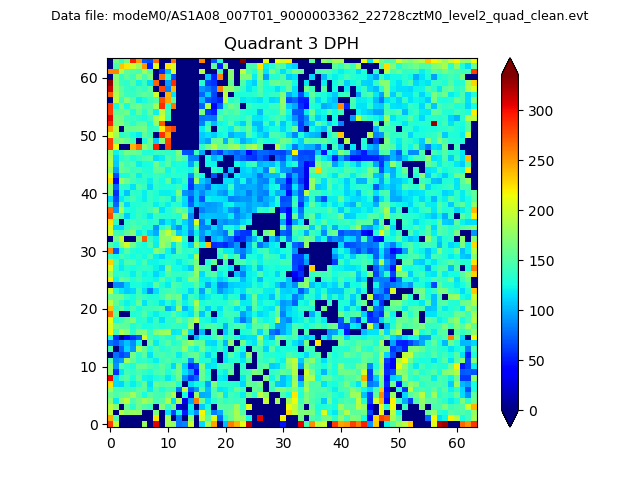 |
 |
Quadrant C |
| Plot type | Count rate plots | Images |
|---|---|---|
| Comparison with Poisson distribution Blue bars denote a histogram of data divided into 1 sec bins. Red curve is a Poisson curve with rate = median count rate of data. |
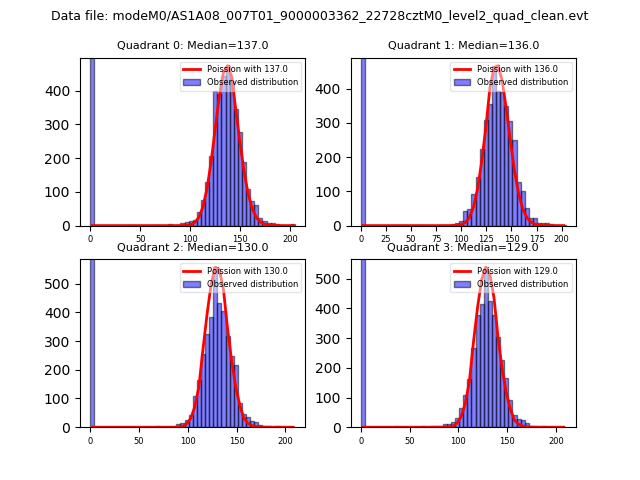 |
 |
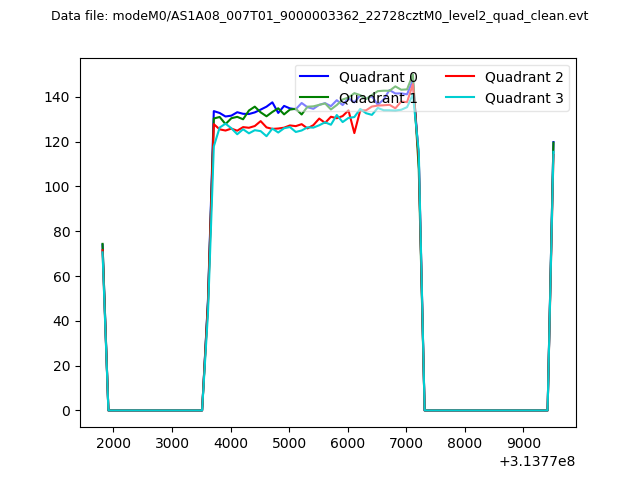
| Quadrant-wise count rates Data is divided into 100 sec bins |
 |
|
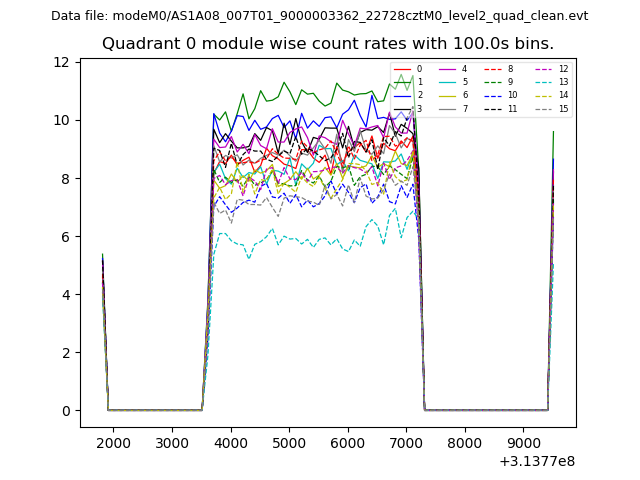
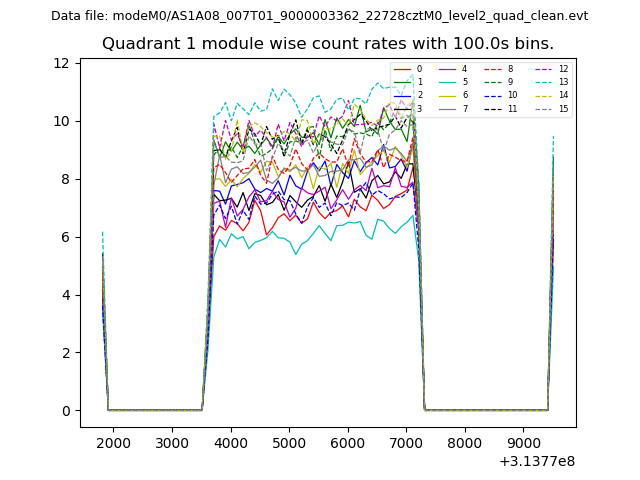
| Module-wise count rates for Quadrant A Data is divided into 100 sec bins |
 |
 |
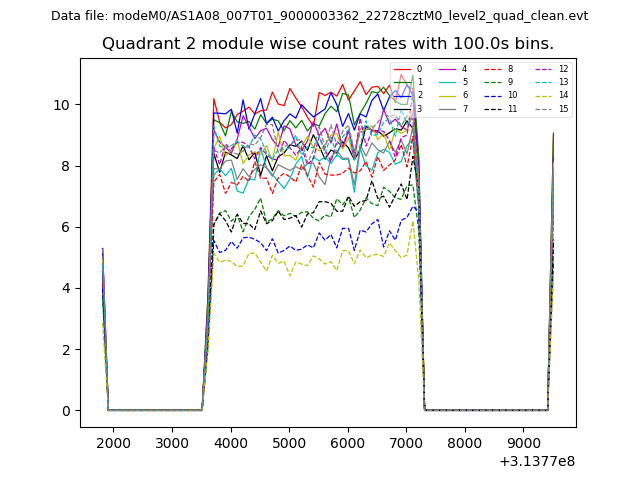
| Module-wise count rates for Quadrant B Data is divided into 100 sec bins |
 |
 |
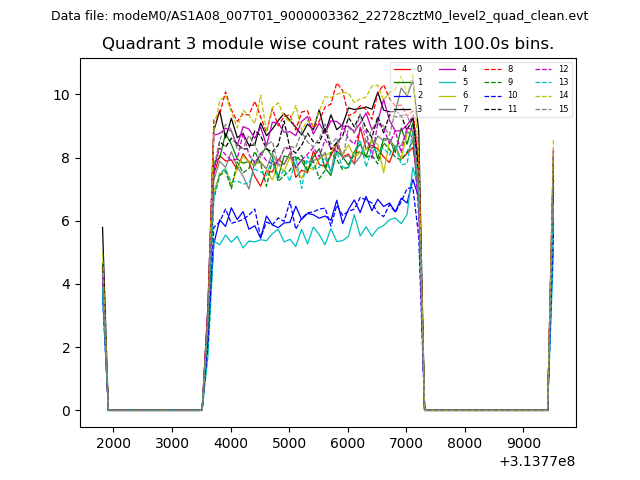
| Module-wise count rates for Quadrant C Data is divided into 100 sec bins |
 |
 |
| Module-wise count rates for Quadrant D Data is divided into 100 sec bins |
 |
 |
| Parameter | Plot |
|---|---|
| CZT HV Monitor |  |
| D_VDD | 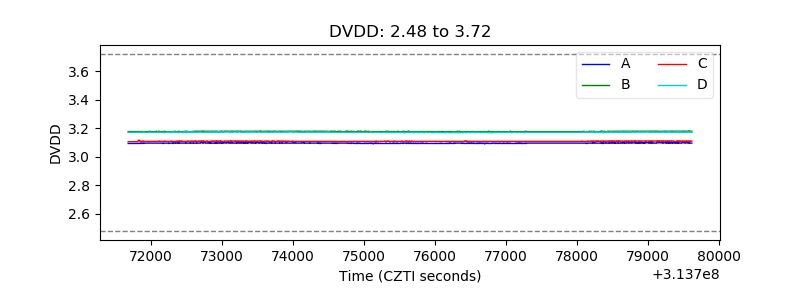 |
| Temperature 1 | 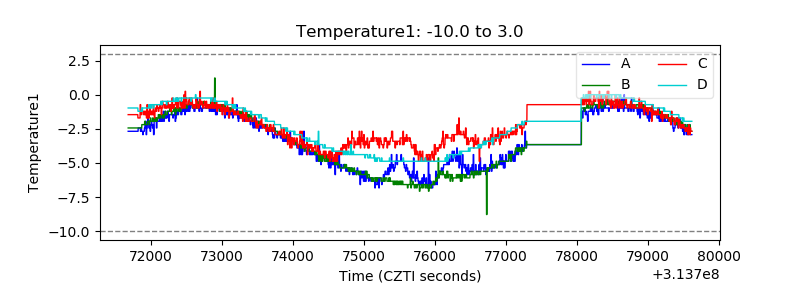 |
| Veto HV Monitor | 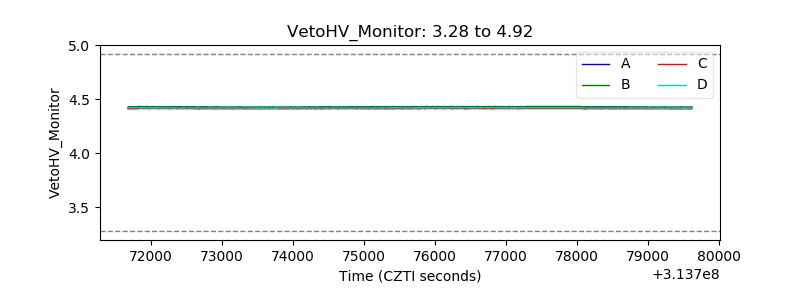 |
| Veto LLD | 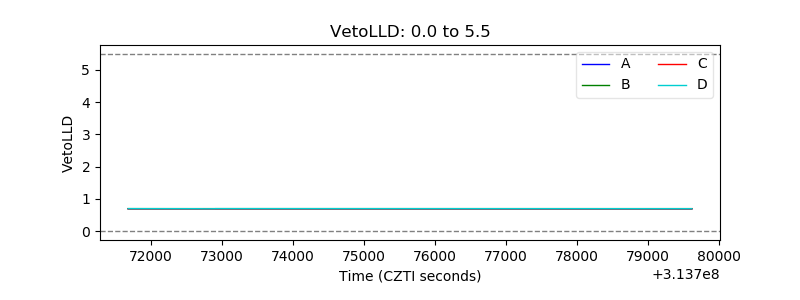 |
| Alpha Counter | 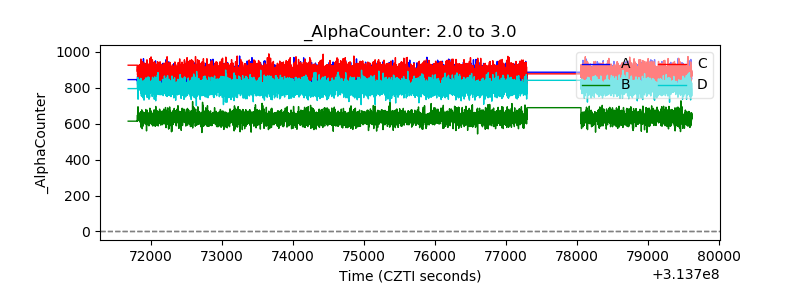 |
| _CPM_Rate | 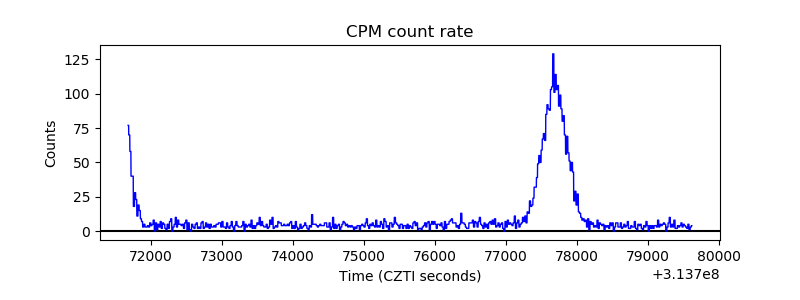 |
| CZT Counter | 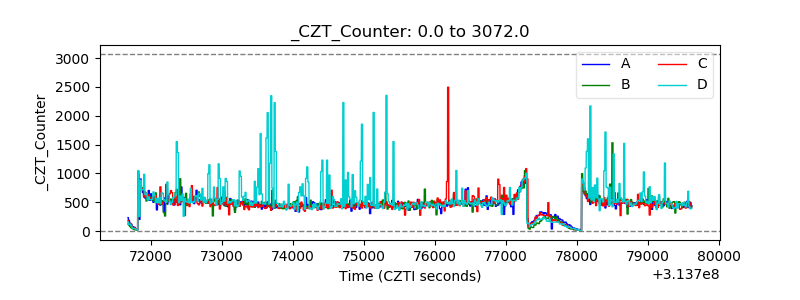 |
| +2.5 Volts monitor |  |
| +5 Volts monitor |  |
| _ROLL_ROT | 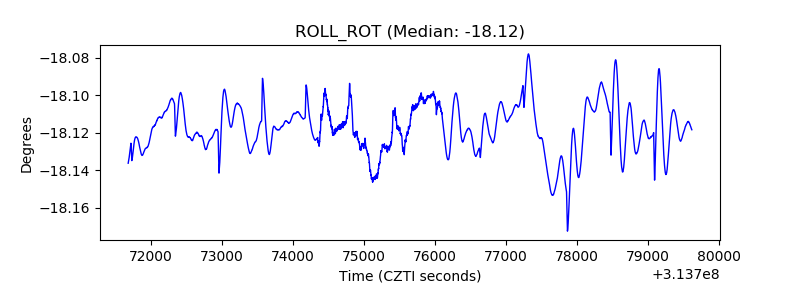 |
| _Roll_DEC | 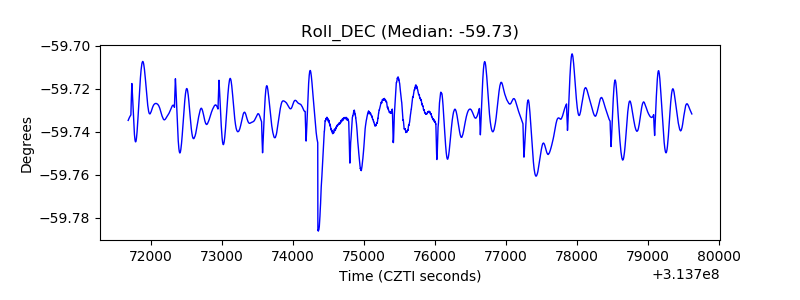 |
| _Roll_RA | 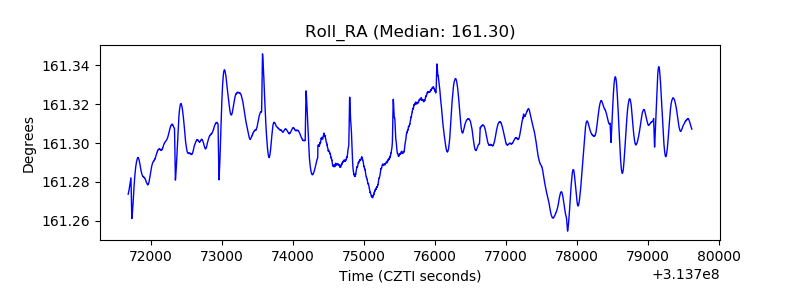 |
| Veto Counter | 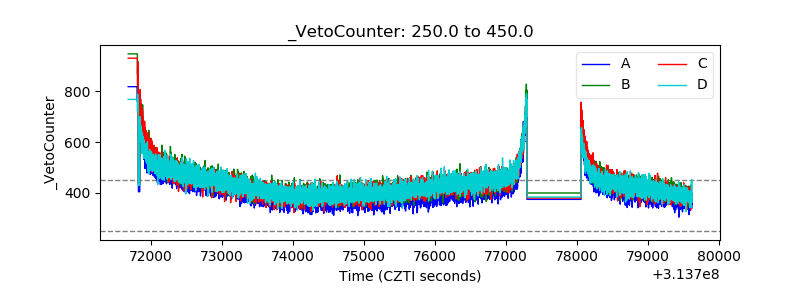 |