| Param | Original file | Final file |
|---|---|---|
| Filename | modeM0/AS1A08_007T01_9000003362_22729cztM0_level2.evt | modeM0/AS1A08_007T01_9000003362_22729cztM0_level2_quad_clean.evt |
| Size (bytes) | 560,295,360 | 90,676,800 |
| Size | 534.3 MB | 86.5 MB |
| Events in quadrant A | 3,518,507 | 572,880 |
| Events in quadrant B | 3,674,706 | 575,166 |
| Events in quadrant C | 3,542,038 | 549,277 |
| Events in quadrant D | 5,734,581 | 537,129 |
| Mode SS | |||
|---|---|---|---|
| Quadrant | BADHDUFLAG | Total packets | Discarded packets |
| A | 0 | 150 | 0 |
| B | 0 | 150 | 0 |
| C | 0 | 150 | 0 |
| D | 0 | 150 | 0 |
| Mode M0 | |||
|---|---|---|---|
| Quadrant | BADHDUFLAG | Total packets | Discarded packets |
| A | 0 | 15189 | 3 |
| B | 0 | 15558 | 2 |
| C | 0 | 15266 | 2 |
| D | 0 | 22043 | 2 |
| Mode M9 | |||
|---|---|---|---|
| Quadrant | BADHDUFLAG | Total packets | Discarded packets |
| A | 0 | 3 | 0 |
| B | 0 | 3 | 0 |
| C | 0 | 3 | 0 |
| D | 0 | 3 | 0 |
| Quadrant | Total seconds | Saturated seconds | Saturation percentage |
|---|---|---|---|
| A | 7344 | 122 | 1.661220% |
| B | 7345 | 153 | 2.083050% |
| C | 7345 | 142 | 1.933288% |
| D | 7345 | 580 | 7.896528% |
Noise dominated data is calculated using 1-second bins in cleaned event files. If a bin has >2000 counts, and if more than 50% of those come from <1% of pixels, then it is considered to be noise-dominated and hence unusable.
| Quadrant | # 1 sec bins | Bins with >0 counts | Bins with >2000 counts | High rate bins dominated by noise | Noise dominated (total time) | Noise dominated (detector-on time) | Marked lightcurve |
|---|---|---|---|---|---|---|---|
| A | 7644 | 7345 | 0 | 0 | 0.00% | 0.00% | 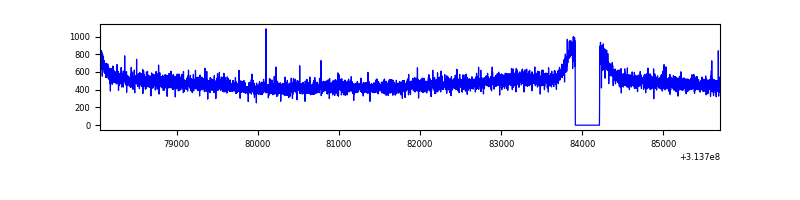 |
| B | 7645 | 7346 | 2 | 2 | 0.03% | 0.03% | 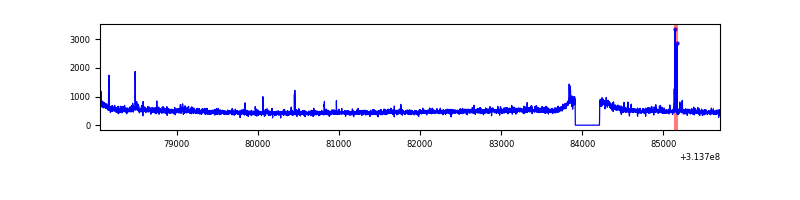 |
| C | 7645 | 7346 | 0 | 0 | 0.00% | 0.00% | 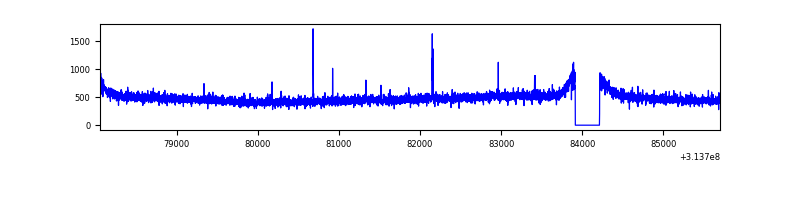 |
| D | 7645 | 7346 | 318 | 318 | 4.16% | 4.33% | 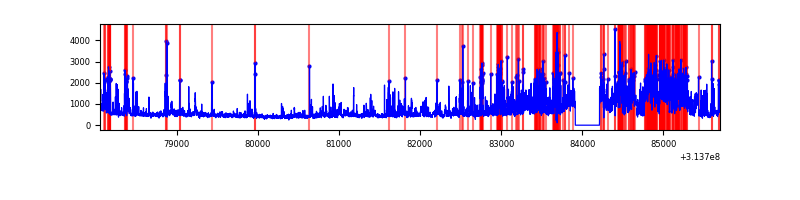 |
Top three noisy pixels from each quadrant. If the there are fewer than three noisy pixels in the level2.evt file, extra rows are filled as -1
| Pixel properties | Quadrant properties | ||||||
|---|---|---|---|---|---|---|---|
| Quadrant | DetID | PixID | Counts | Sigma | Mean | Median | Sigma |
| A | 13 | 254 | 12600 | 63.96 | 911 | 889 | 183.1 |
| A | 0 | 226 | 7861 | 38.08 | 911 | 889 | 183.1 |
| A | 3 | 137 | 7256 | 34.77 | 911 | 889 | 183.1 |
| B | 0 | 197 | 41600 | 237.56 | 903 | 880 | 171.4 |
| B | 0 | 228 | 37335 | 212.68 | 903 | 880 | 171.4 |
| B | 0 | 190 | 26908 | 151.85 | 903 | 880 | 171.4 |
| C | 14 | 238 | 135391 | 665.46 | 867 | 871 | 202.1 |
| C | 10 | 22 | 20019 | 94.72 | 867 | 871 | 202.1 |
| C | 13 | 61 | 6112 | 25.93 | 867 | 871 | 202.1 |
| D | 1 | 52 | 1727596 | 8164.13 | 867 | 841 | 211.5 |
| D | 12 | 233 | 498596 | 2353.4 | 867 | 841 | 211.5 |
| D | 12 | 227 | 76162 | 356.12 | 867 | 841 | 211.5 |
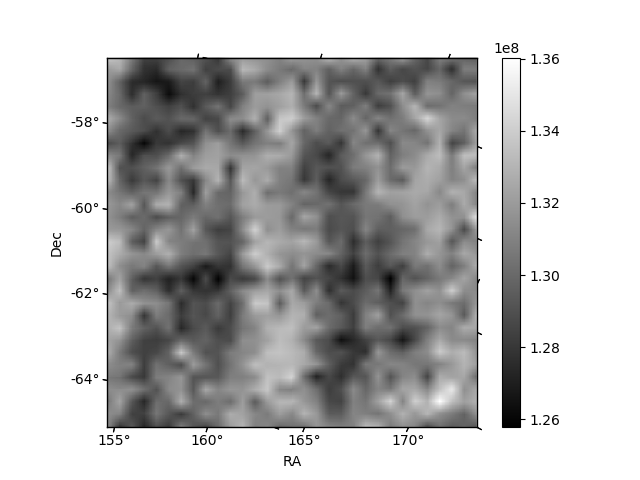
Histogram calculated using DETX and DETY for each event in the final _common_clean file
| Quadrant A | 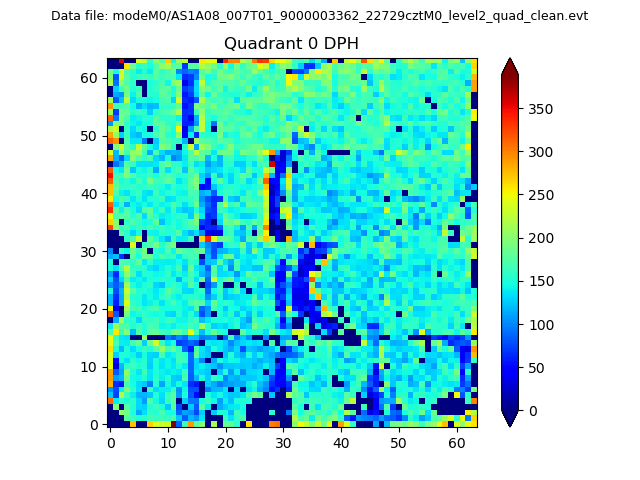 |
 |
Quadrant B |
|---|---|---|---|
| Quadrant D | 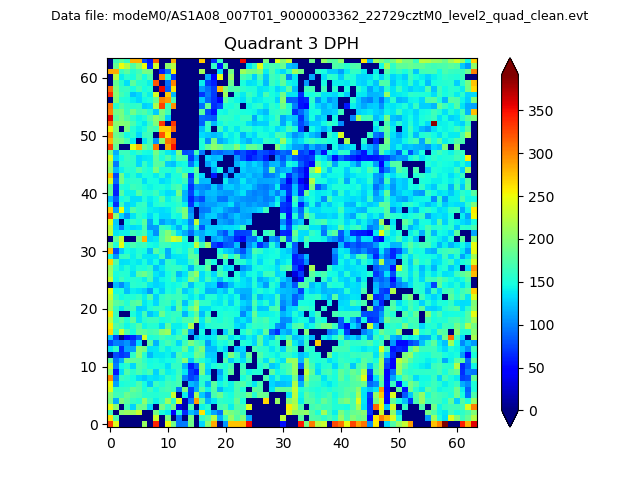 |
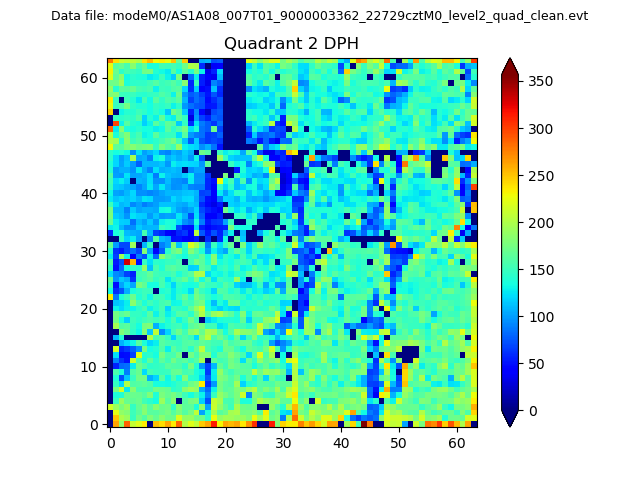 |
Quadrant C |
| Plot type | Count rate plots | Images |
|---|---|---|
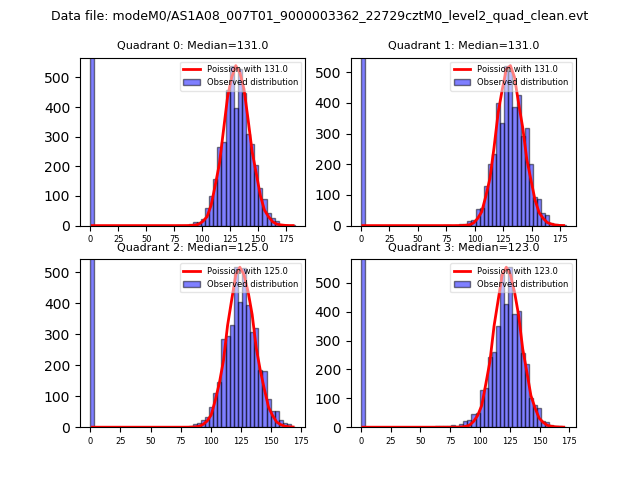
| Comparison with Poisson distribution Blue bars denote a histogram of data divided into 1 sec bins. Red curve is a Poisson curve with rate = median count rate of data. |
 |
 |
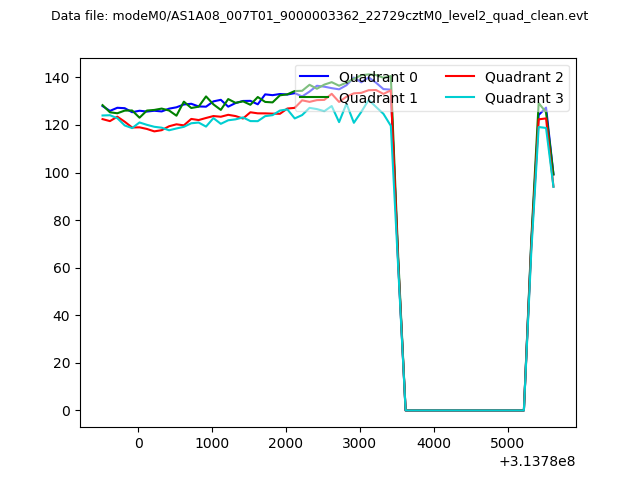
| Quadrant-wise count rates Data is divided into 100 sec bins |
 |
|
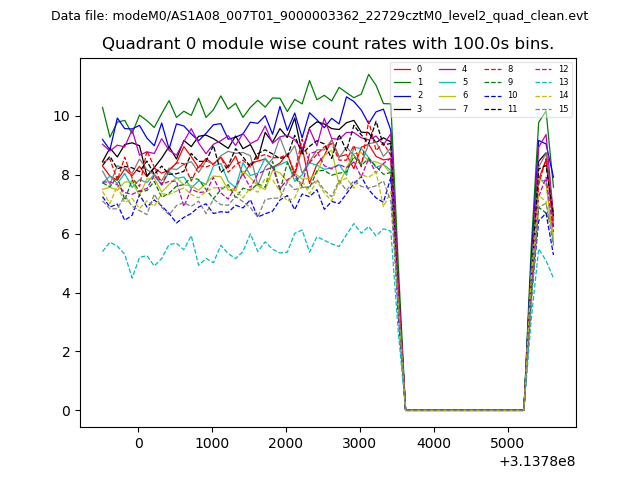
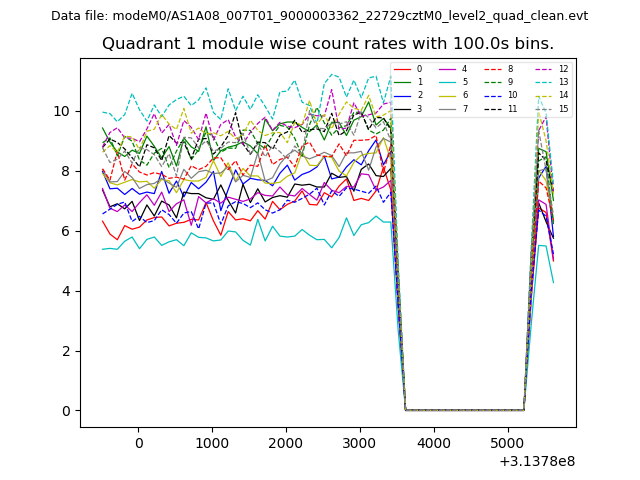
| Module-wise count rates for Quadrant A Data is divided into 100 sec bins |
 |
 |
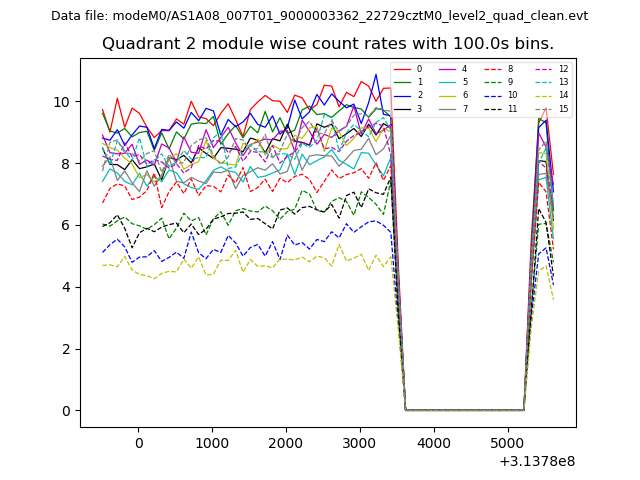
| Module-wise count rates for Quadrant B Data is divided into 100 sec bins |
 |
 |
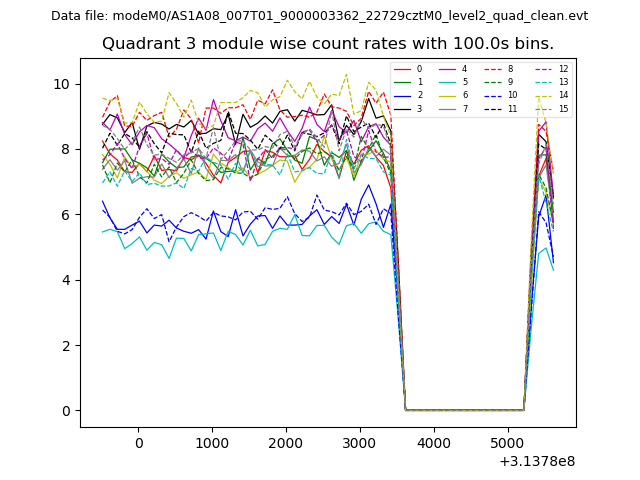
| Module-wise count rates for Quadrant C Data is divided into 100 sec bins |
 |
 |
| Module-wise count rates for Quadrant D Data is divided into 100 sec bins |
 |
 |
| Parameter | Plot |
|---|---|
| CZT HV Monitor | 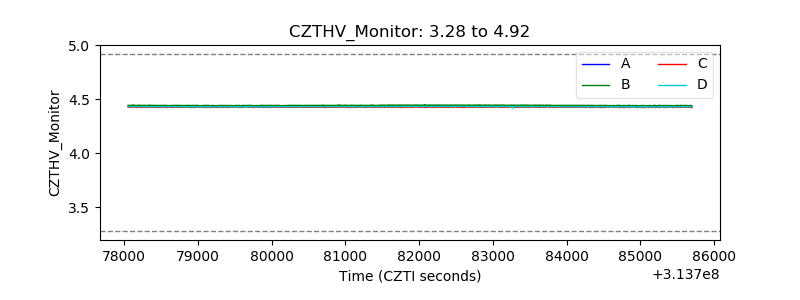 |
| D_VDD | 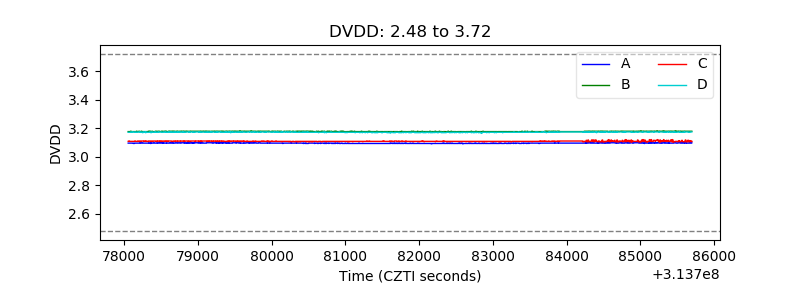 |
| Temperature 1 | 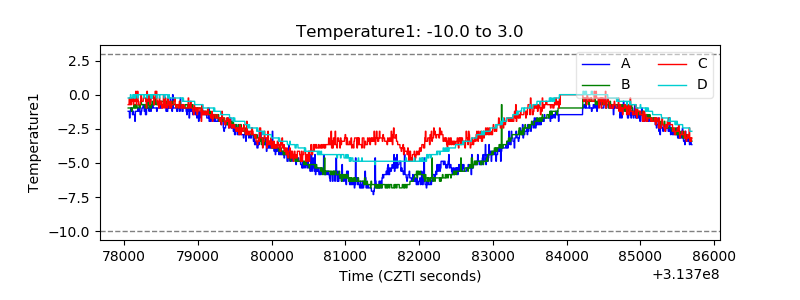 |
| Veto HV Monitor | 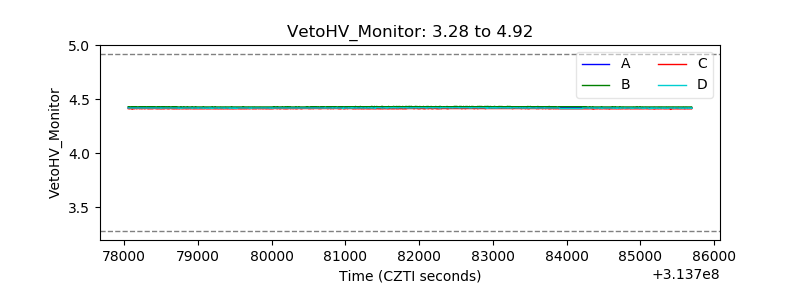 |
| Veto LLD | 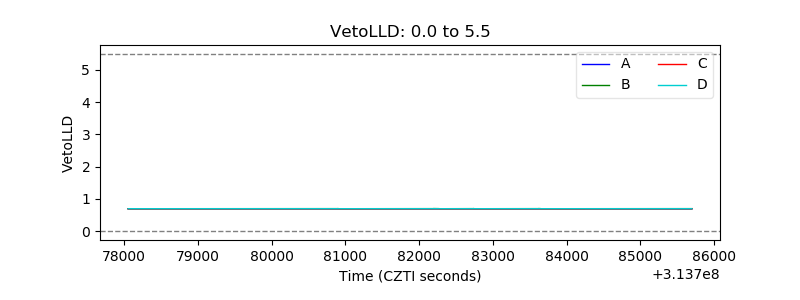 |
| Alpha Counter | 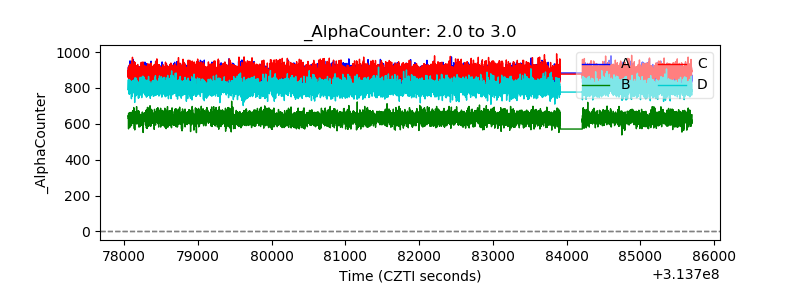 |
| _CPM_Rate | 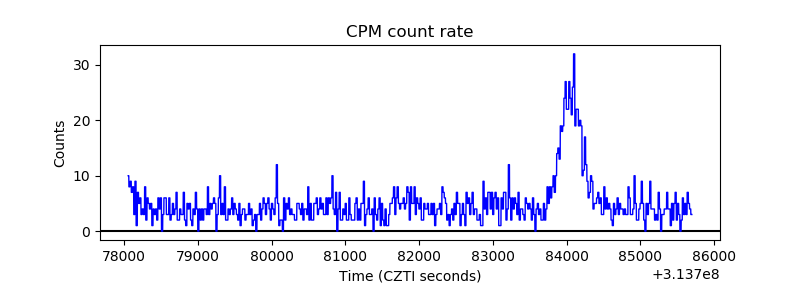 |
| CZT Counter | 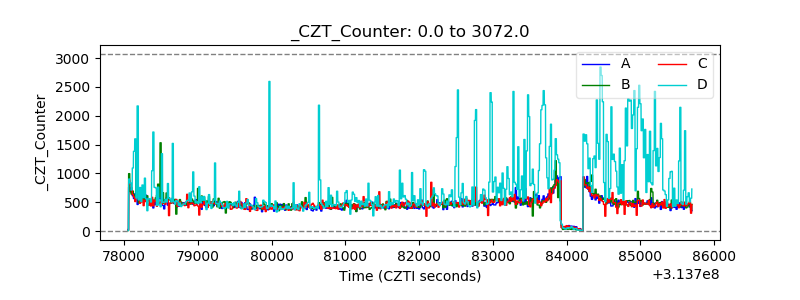 |
| +2.5 Volts monitor |  |
| +5 Volts monitor |  |
| _ROLL_ROT | 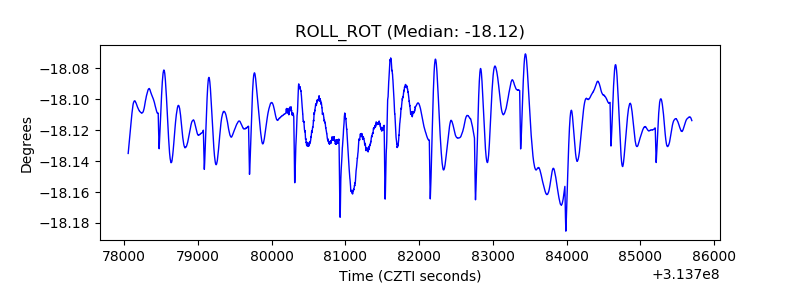 |
| _Roll_DEC |  |
| _Roll_RA | 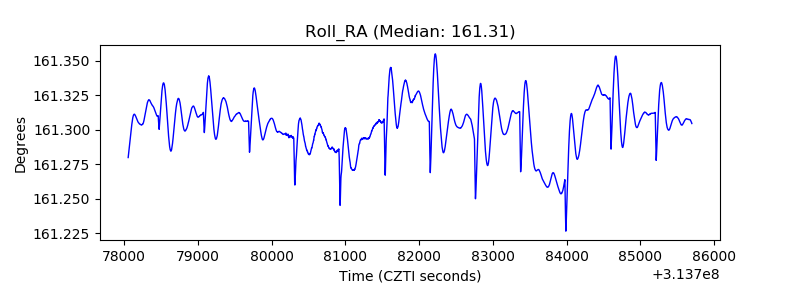 |
| Veto Counter | 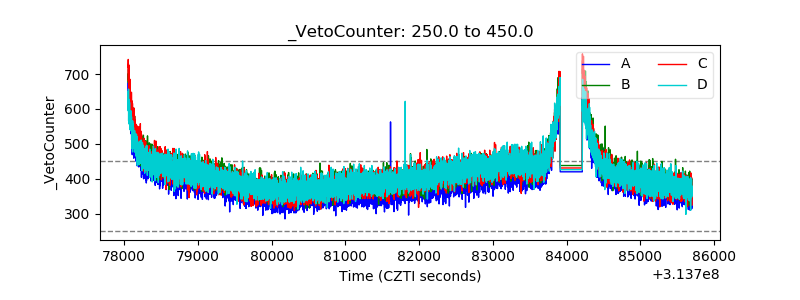 |