| Param | Original file | Final file |
|---|---|---|
| Filename | modeM0/AS1A08_007T01_9000003362_22731cztM0_level2.evt | modeM0/AS1A08_007T01_9000003362_22731cztM0_level2_quad_clean.evt |
| Size (bytes) | 491,817,600 | 99,469,440 |
| Size | 469.0 MB | 94.9 MB |
| Events in quadrant A | 3,351,228 | 642,521 |
| Events in quadrant B | 3,550,057 | 644,435 |
| Events in quadrant C | 3,368,340 | 619,088 |
| Events in quadrant D | 4,137,144 | 606,022 |
| Mode SS | |||
|---|---|---|---|
| Quadrant | BADHDUFLAG | Total packets | Discarded packets |
| A | 0 | 147 | 3 |
| B | 0 | 148 | 4 |
| C | 0 | 148 | 4 |
| D | 0 | 147 | 3 |
| Mode M0 | |||
|---|---|---|---|
| Quadrant | BADHDUFLAG | Total packets | Discarded packets |
| A | 0 | 14866 | 157 |
| B | 0 | 15343 | 178 |
| C | 0 | 14891 | 159 |
| D | 0 | 17501 | 206 |
| Mode M9 | |||
|---|---|---|---|
| Quadrant | BADHDUFLAG | Total packets | Discarded packets |
| A | 0 | 4 | 0 |
| B | 0 | 4 | 0 |
| C | 0 | 4 | 0 |
| D | 0 | 4 | 0 |
| Quadrant | Total seconds | Saturated seconds | Saturation percentage |
|---|---|---|---|
| A | 7196 | 36 | 0.500278% |
| B | 7188 | 67 | 0.932109% |
| C | 7193 | 67 | 0.931461% |
| D | 7190 | 125 | 1.738526% |
Noise dominated data is calculated using 1-second bins in cleaned event files. If a bin has >2000 counts, and if more than 50% of those come from <1% of pixels, then it is considered to be noise-dominated and hence unusable.
| Quadrant | # 1 sec bins | Bins with >0 counts | Bins with >2000 counts | High rate bins dominated by noise | Noise dominated (total time) | Noise dominated (detector-on time) | Marked lightcurve |
|---|---|---|---|---|---|---|---|
| A | 7790 | 7207 | 1 | 1 | 0.01% | 0.01% | 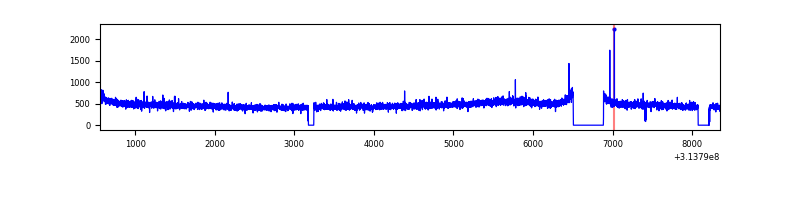 |
| B | 7790 | 7202 | 3 | 3 | 0.04% | 0.04% | 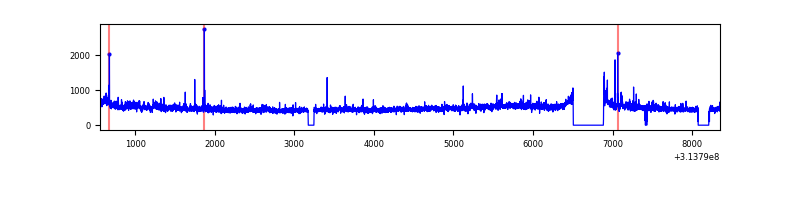 |
| C | 7790 | 7204 | 0 | 0 | 0.00% | 0.00% | 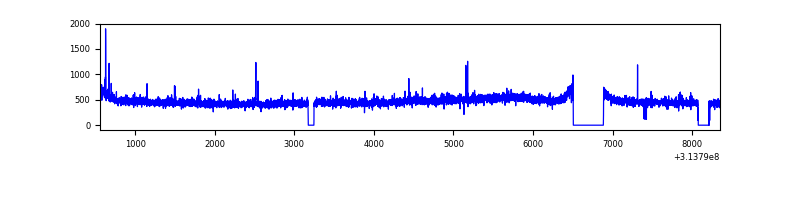 |
| D | 7790 | 7200 | 61 | 61 | 0.78% | 0.85% | 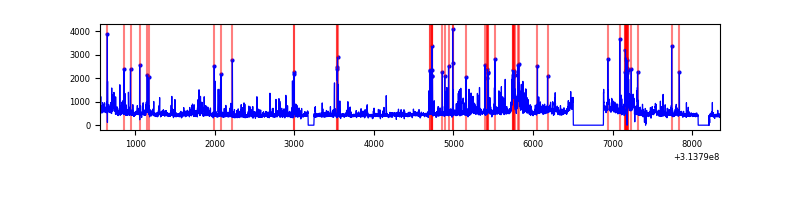 |
Top three noisy pixels from each quadrant. If the there are fewer than three noisy pixels in the level2.evt file, extra rows are filled as -1
| Pixel properties | Quadrant properties | ||||||
|---|---|---|---|---|---|---|---|
| Quadrant | DetID | PixID | Counts | Sigma | Mean | Median | Sigma |
| A | 13 | 254 | 12810 | 68.04 | 865 | 846 | 175.8 |
| A | 0 | 23 | 9614 | 49.86 | 865 | 846 | 175.8 |
| A | 0 | 226 | 8320 | 42.5 | 865 | 846 | 175.8 |
| B | 0 | 228 | 49807 | 297.43 | 861 | 841 | 164.6 |
| B | 0 | 230 | 41345 | 246.03 | 861 | 841 | 164.6 |
| B | 0 | 197 | 37911 | 225.17 | 861 | 841 | 164.6 |
| C | 14 | 238 | 128423 | 661.53 | 823 | 828 | 192.9 |
| C | 10 | 22 | 15814 | 77.69 | 823 | 828 | 192.9 |
| C | 0 | 207 | 6083 | 27.24 | 823 | 828 | 192.9 |
| D | 12 | 233 | 382297 | 1877.17 | 829 | 804 | 203.2 |
| D | 1 | 52 | 267854 | 1314.04 | 829 | 804 | 203.2 |
| D | 12 | 227 | 173955 | 852.0 | 829 | 804 | 203.2 |
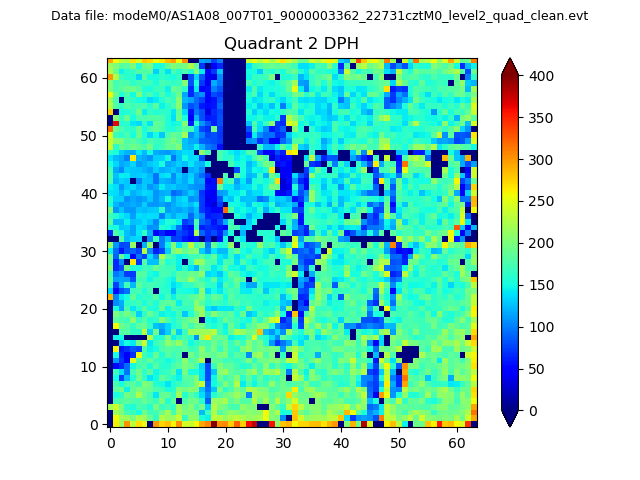
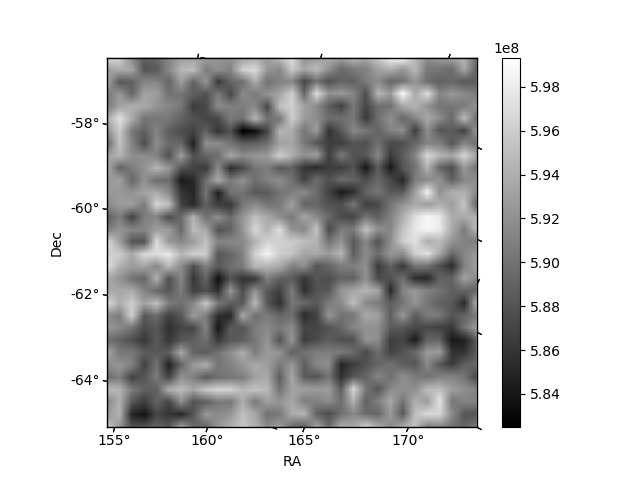
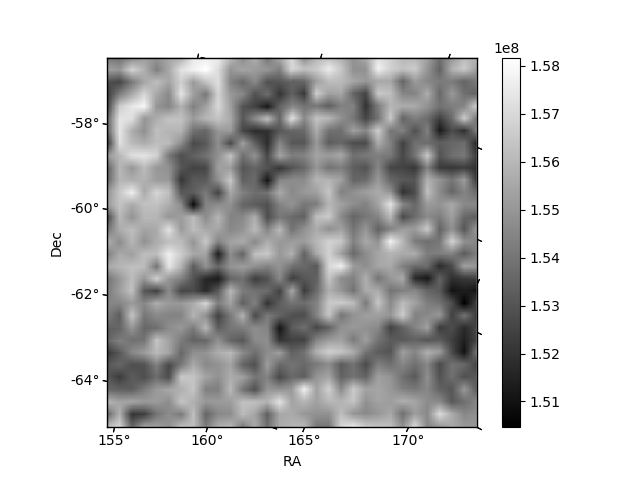
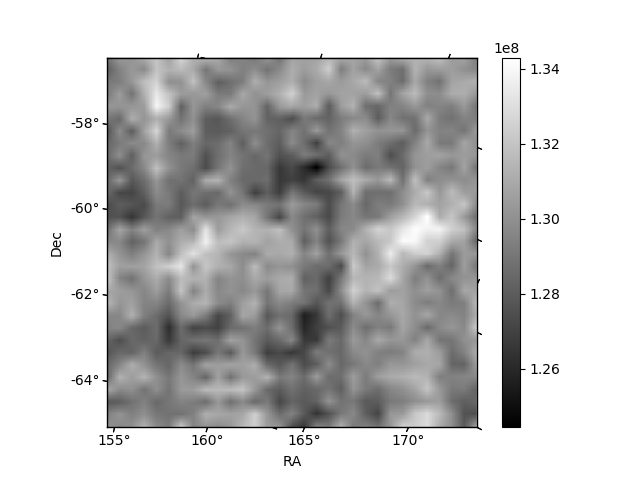
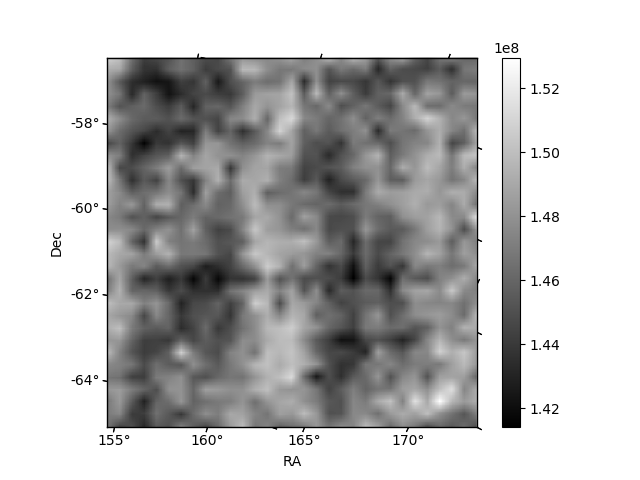
Histogram calculated using DETX and DETY for each event in the final _common_clean file
| Quadrant A | 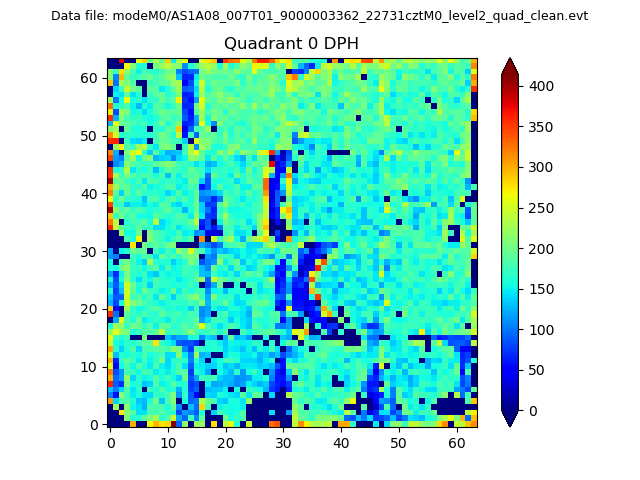 |
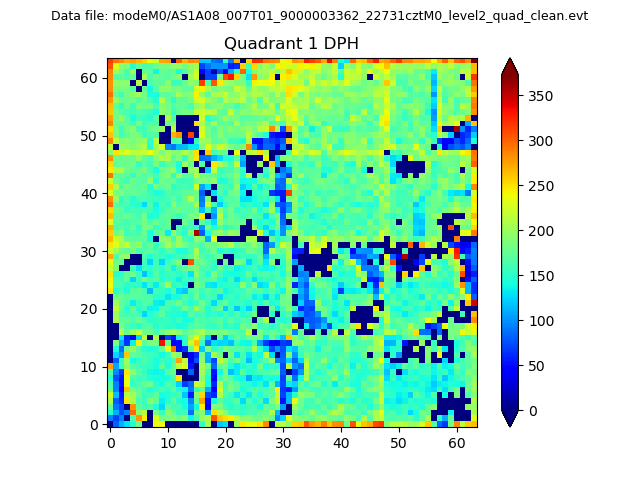 |
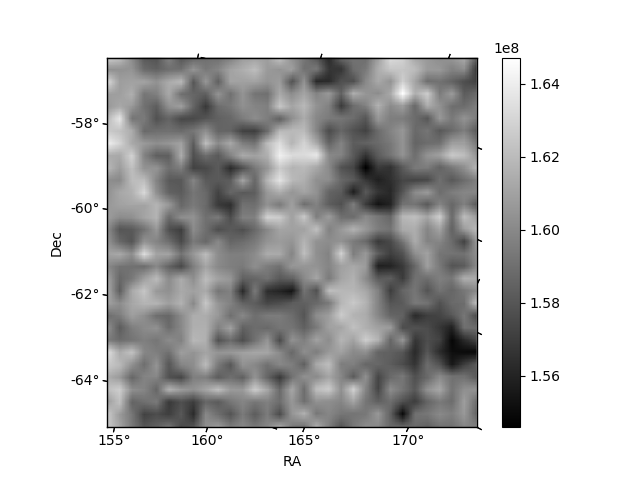
Quadrant B |
|---|---|---|---|
| Quadrant D | 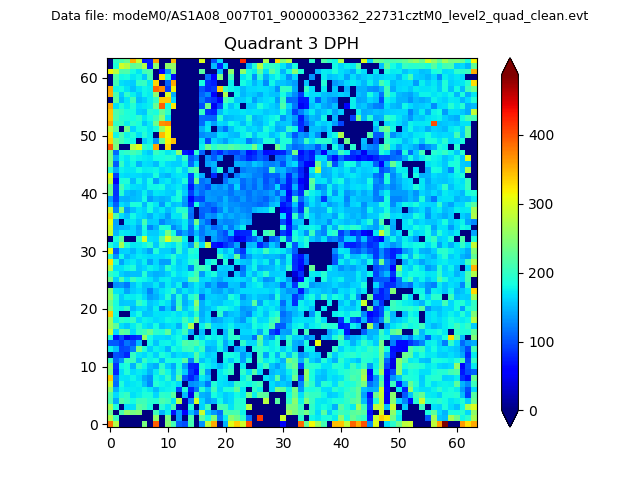 |
 |
Quadrant C |
| Plot type | Count rate plots | Images |
|---|---|---|
| Comparison with Poisson distribution Blue bars denote a histogram of data divided into 1 sec bins. Red curve is a Poisson curve with rate = median count rate of data. |
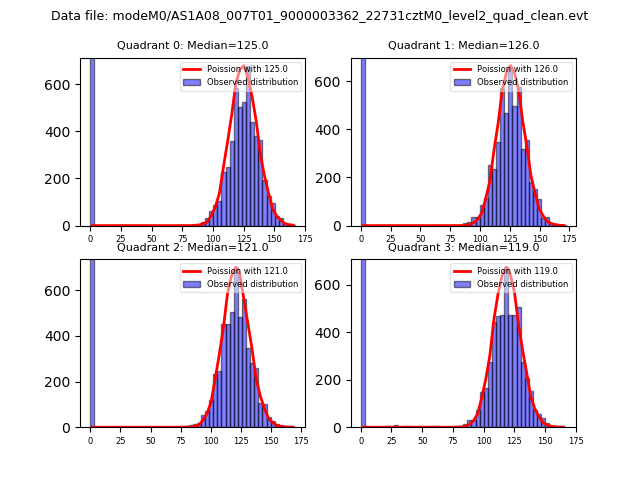 |
 |
| Quadrant-wise count rates Data is divided into 100 sec bins |
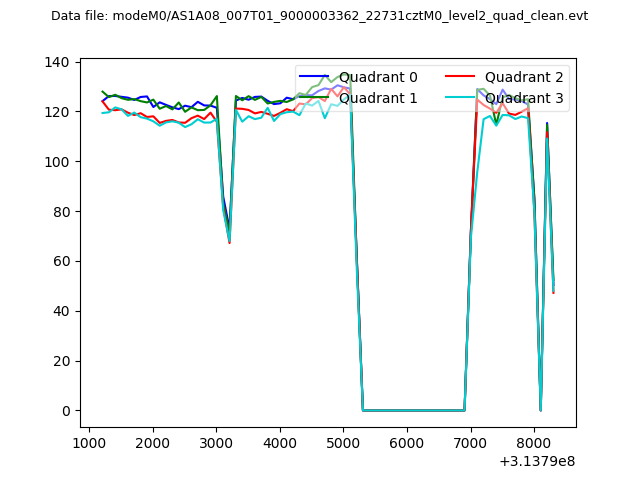 |
|
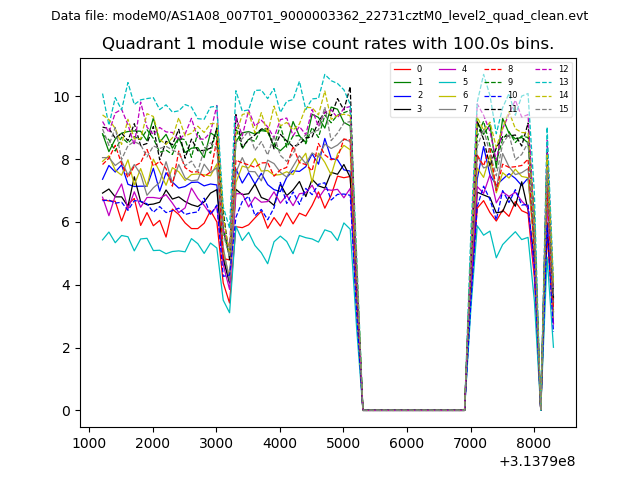
| Module-wise count rates for Quadrant A Data is divided into 100 sec bins |
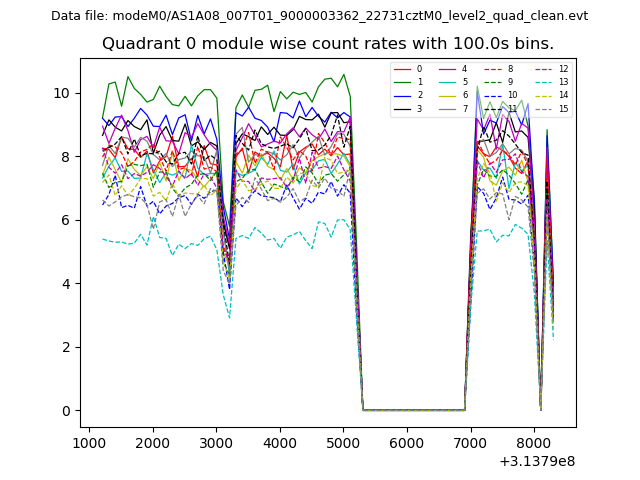 |
 |
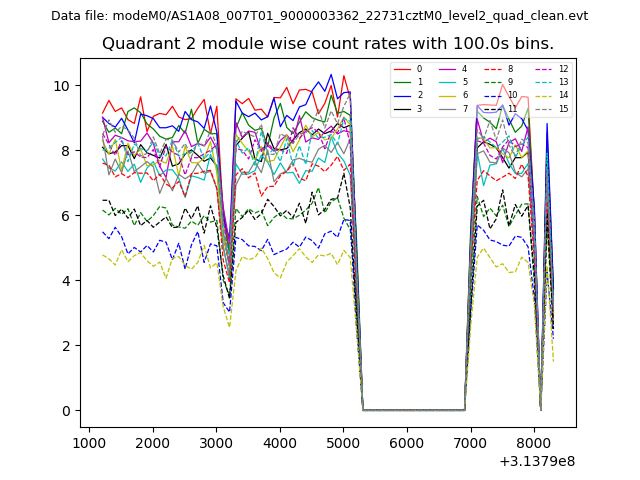
| Module-wise count rates for Quadrant B Data is divided into 100 sec bins |
 |
 |
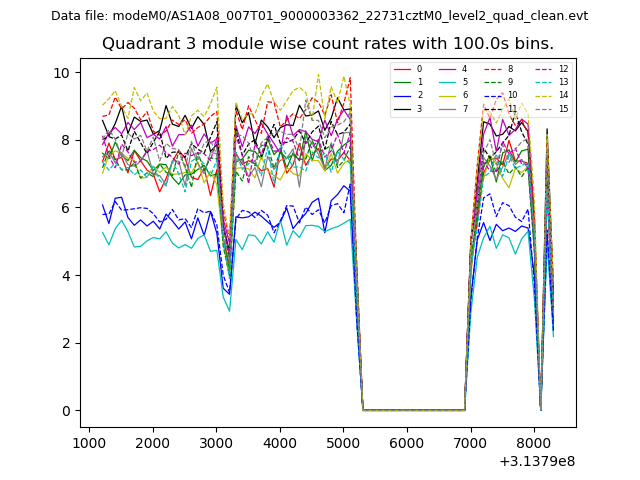
| Module-wise count rates for Quadrant C Data is divided into 100 sec bins |
 |
 |
| Module-wise count rates for Quadrant D Data is divided into 100 sec bins |
 |
 |
| Parameter | Plot |
|---|---|
| CZT HV Monitor | 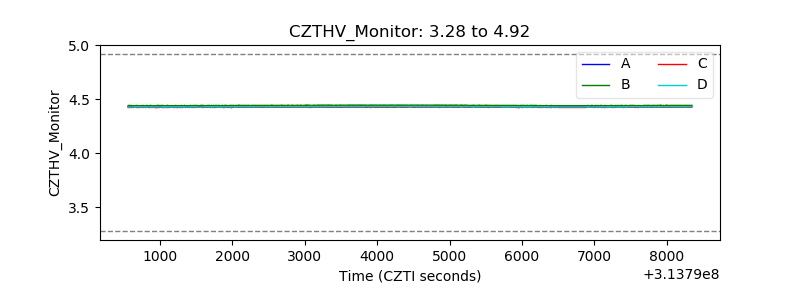 |
| D_VDD | 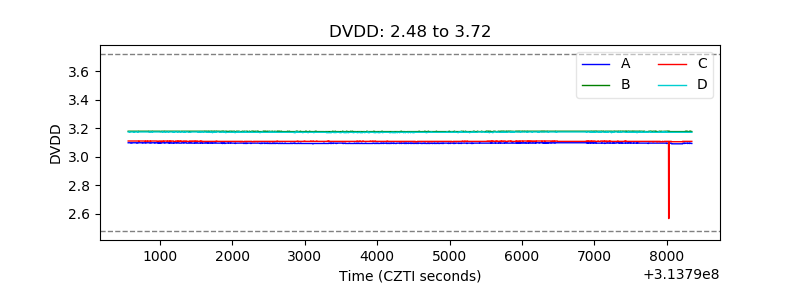 |
| Temperature 1 | 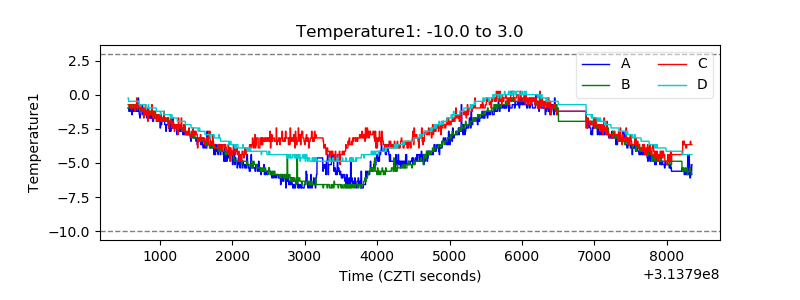 |
| Veto HV Monitor | 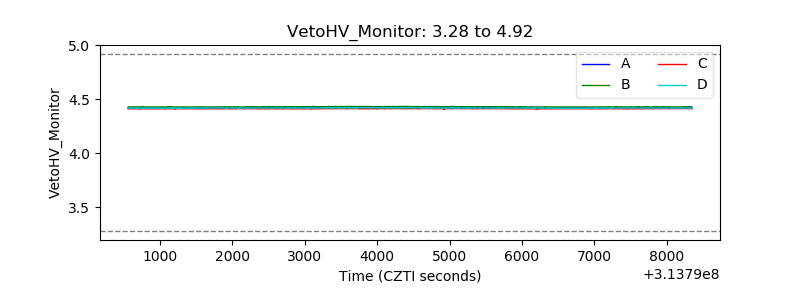 |
| Veto LLD | 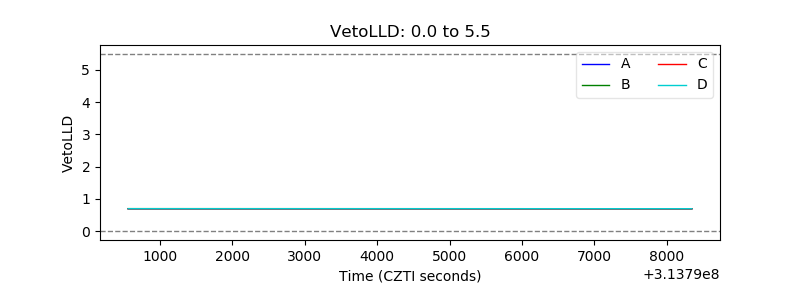 |
| Alpha Counter | 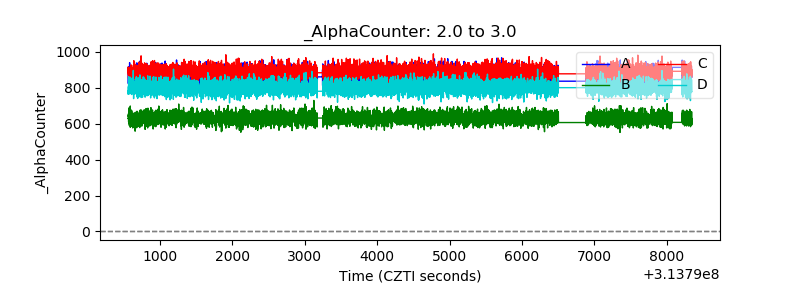 |
| _CPM_Rate | 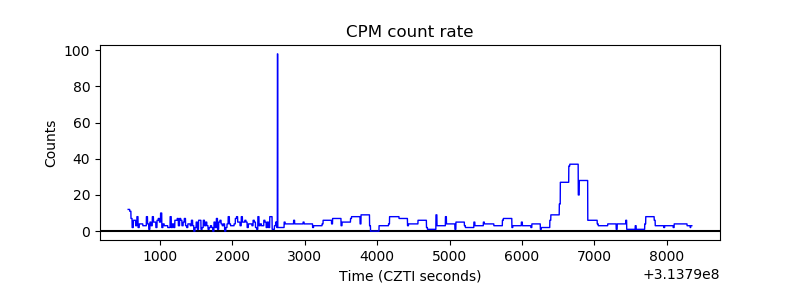 |
| CZT Counter |  |
| +2.5 Volts monitor |  |
| +5 Volts monitor |  |
| _ROLL_ROT | 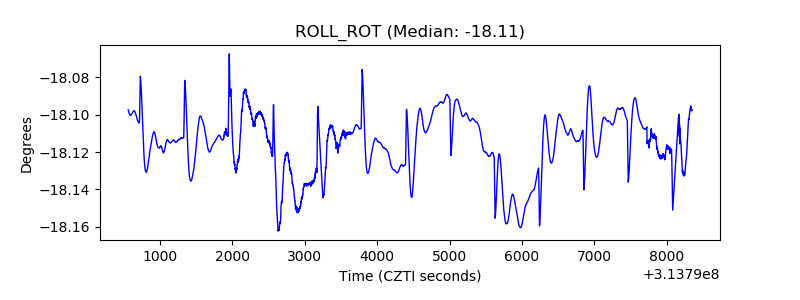 |
| _Roll_DEC | 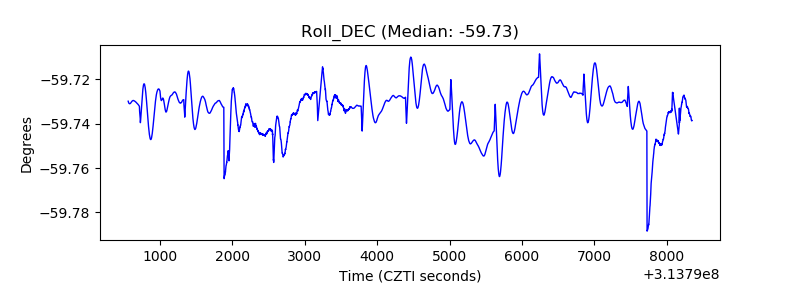 |
| _Roll_RA | 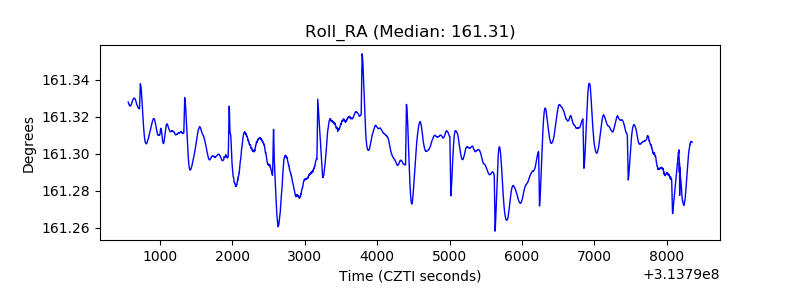 |
| Veto Counter | 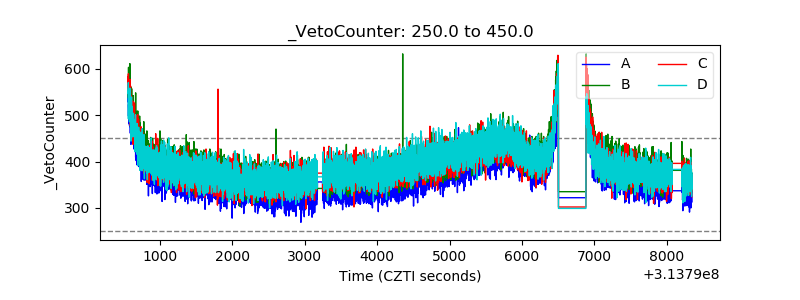 |