| Param | Original file | Final file |
|---|---|---|
| Filename | modeM0/AS1A08_007T01_9000003362_22735cztM0_level2.evt | modeM0/AS1A08_007T01_9000003362_22735cztM0_level2_quad_clean.evt |
| Size (bytes) | 1,443,672,000 | 276,802,560 |
| Size | 1.3 GB | 264.0 MB |
| Events in quadrant A | 9,347,792 | 1,775,932 |
| Events in quadrant B | 10,025,768 | 1,799,526 |
| Events in quadrant C | 9,550,264 | 1,727,237 |
| Events in quadrant D | 13,422,783 | 1,679,953 |
| Mode SS | |||
|---|---|---|---|
| Quadrant | BADHDUFLAG | Total packets | Discarded packets |
| A | 0 | 414 | 0 |
| B | 0 | 414 | 0 |
| C | 0 | 414 | 0 |
| D | 0 | 414 | 0 |
| Mode M0 | |||
|---|---|---|---|
| Quadrant | BADHDUFLAG | Total packets | Discarded packets |
| A | 0 | 41467 | 102 |
| B | 0 | 43331 | 201 |
| C | 0 | 41468 | 97 |
| D | 0 | 54090 | 218 |
| Mode M9 | |||
|---|---|---|---|
| Quadrant | BADHDUFLAG | Total packets | Discarded packets |
| A | 0 | 24 | 0 |
| B | 0 | 25 | 0 |
| C | 0 | 25 | 0 |
| D | 0 | 25 | 0 |
| Quadrant | Total seconds | Saturated seconds | Saturation percentage |
|---|---|---|---|
| A | 20347 | 66 | 0.324372% |
| B | 20346 | 160 | 0.786395% |
| C | 20351 | 153 | 0.751806% |
| D | 20336 | 959 | 4.715775% |
Noise dominated data is calculated using 1-second bins in cleaned event files. If a bin has >2000 counts, and if more than 50% of those come from <1% of pixels, then it is considered to be noise-dominated and hence unusable.
| Quadrant | # 1 sec bins | Bins with >0 counts | Bins with >2000 counts | High rate bins dominated by noise | Noise dominated (total time) | Noise dominated (detector-on time) | Marked lightcurve |
|---|---|---|---|---|---|---|---|
| A | 22623 | 20361 | 2 | 2 | 0.01% | 0.01% | 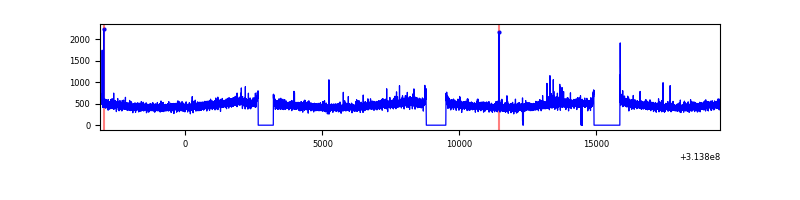 |
| B | 22623 | 20362 | 27 | 27 | 0.12% | 0.13% | 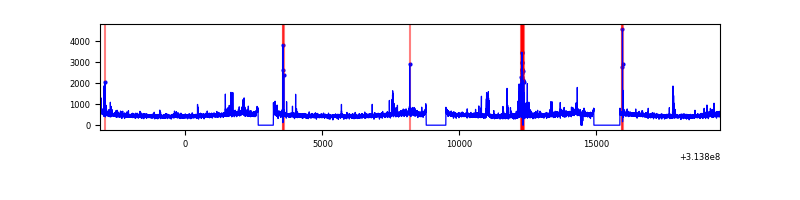 |
| C | 22623 | 20370 | 2 | 2 | 0.01% | 0.01% | 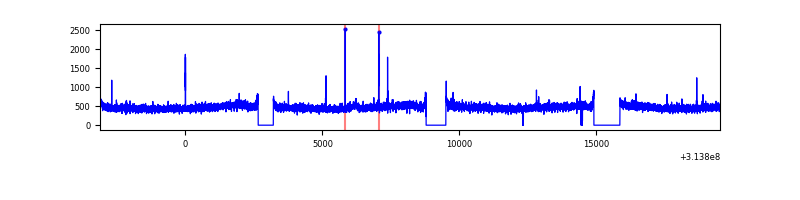 |
| D | 22623 | 20349 | 649 | 649 | 2.87% | 3.19% | 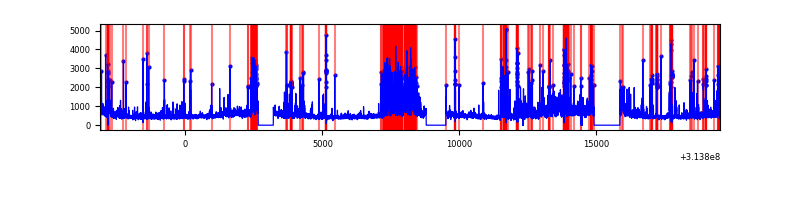 |
Top three noisy pixels from each quadrant. If the there are fewer than three noisy pixels in the level2.evt file, extra rows are filled as -1
| Pixel properties | Quadrant properties | ||||||
|---|---|---|---|---|---|---|---|
| Quadrant | DetID | PixID | Counts | Sigma | Mean | Median | Sigma |
| A | 0 | 23 | 41690 | 81.41 | 2409 | 2352 | 483.2 |
| A | 13 | 254 | 34549 | 66.63 | 2409 | 2352 | 483.2 |
| A | 0 | 226 | 22848 | 42.42 | 2409 | 2352 | 483.2 |
| B | 12 | 18 | 225384 | 491.6 | 2405 | 2341 | 453.7 |
| B | 0 | 197 | 128138 | 277.27 | 2405 | 2341 | 453.7 |
| B | 0 | 228 | 78249 | 167.31 | 2405 | 2341 | 453.7 |
| C | 14 | 238 | 365381 | 668.95 | 2327 | 2341 | 542.7 |
| C | 10 | 22 | 62531 | 110.91 | 2327 | 2341 | 542.7 |
| C | 9 | 54 | 34183 | 58.67 | 2327 | 2341 | 542.7 |
| D | 1 | 52 | 1801319 | 3237.81 | 2312 | 2248 | 555.6 |
| D | 12 | 233 | 1548300 | 2782.45 | 2312 | 2248 | 555.6 |
| D | 12 | 227 | 839158 | 1506.2 | 2312 | 2248 | 555.6 |
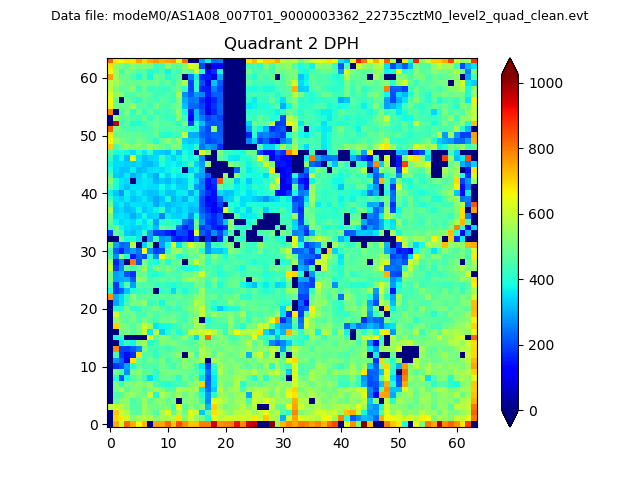
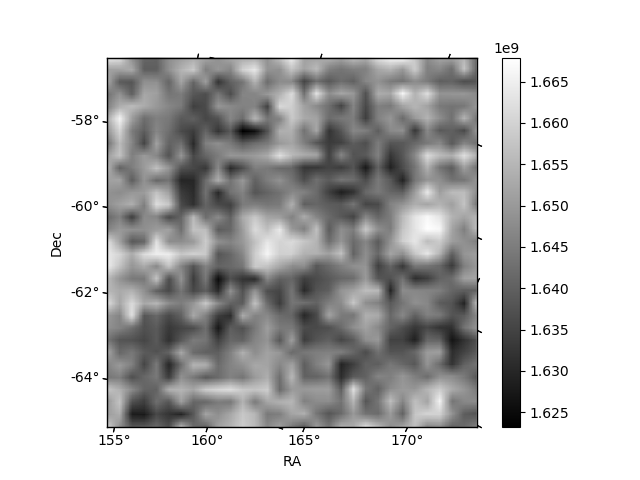
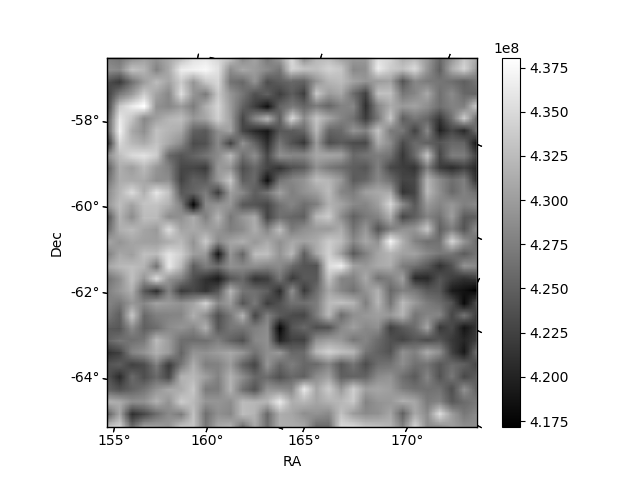
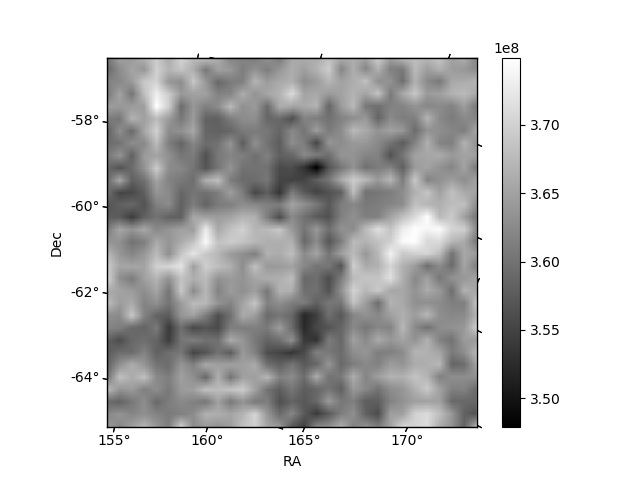
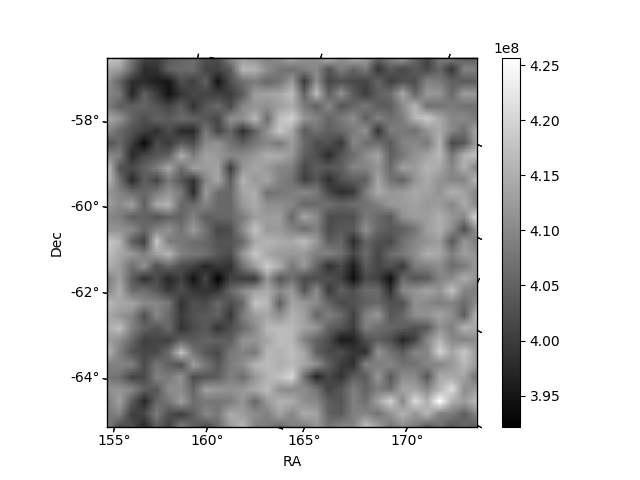
Histogram calculated using DETX and DETY for each event in the final _common_clean file
| Quadrant A | 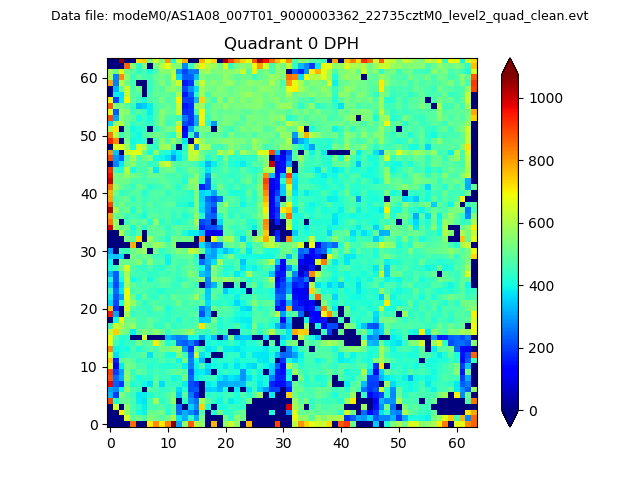 |
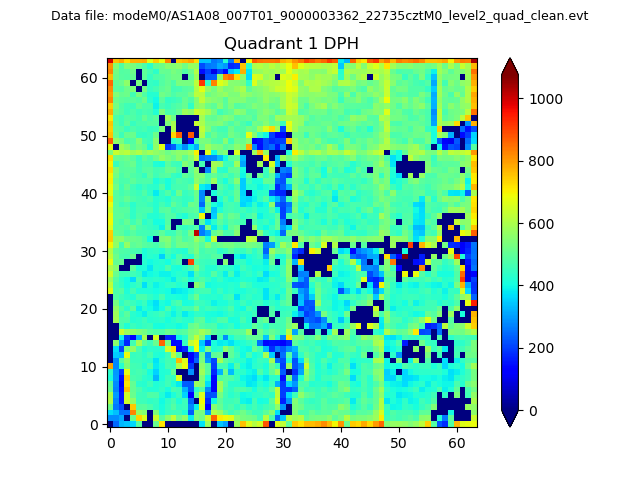 |
Quadrant B |
|---|---|---|---|
| Quadrant D | 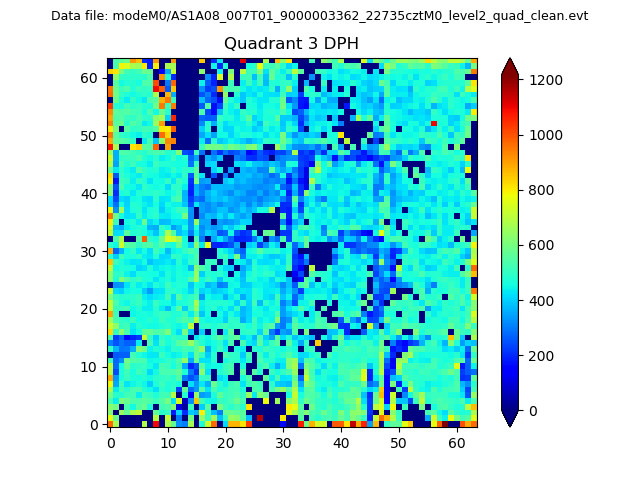 |
 |
Quadrant C |
| Plot type | Count rate plots | Images |
|---|---|---|
| Comparison with Poisson distribution Blue bars denote a histogram of data divided into 1 sec bins. Red curve is a Poisson curve with rate = median count rate of data. |
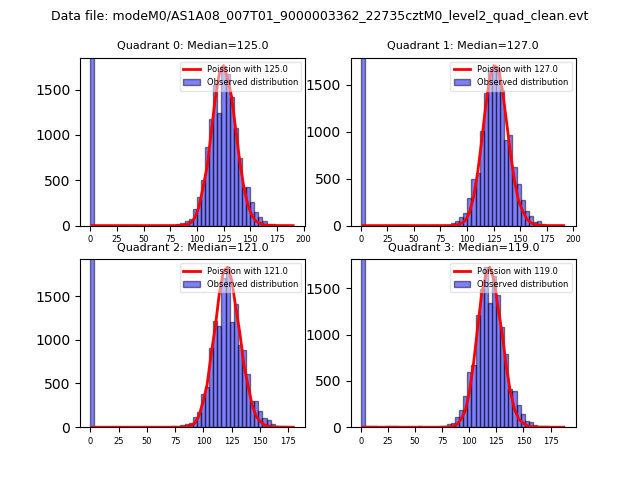 |
 |
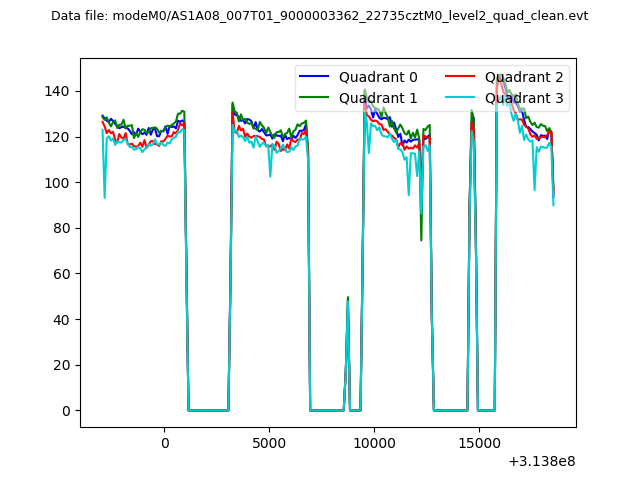
| Quadrant-wise count rates Data is divided into 100 sec bins |
 |
|
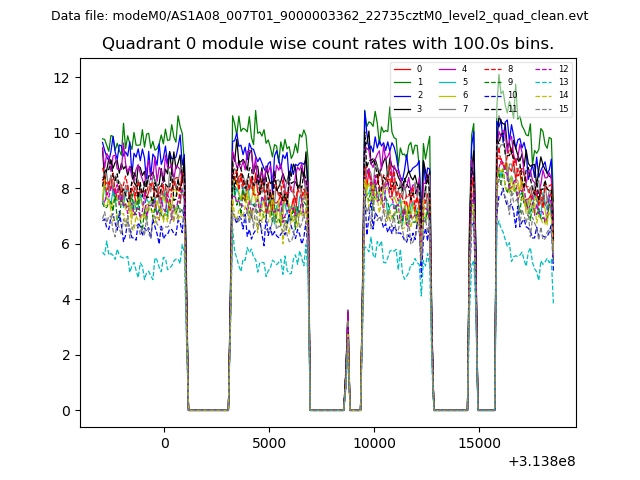
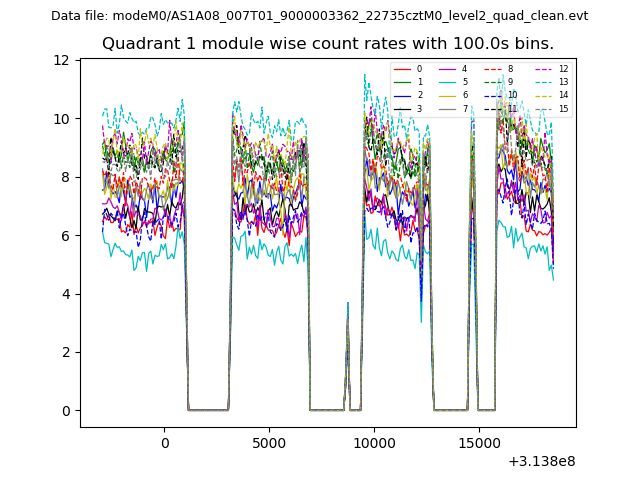
| Module-wise count rates for Quadrant A Data is divided into 100 sec bins |
 |
 |
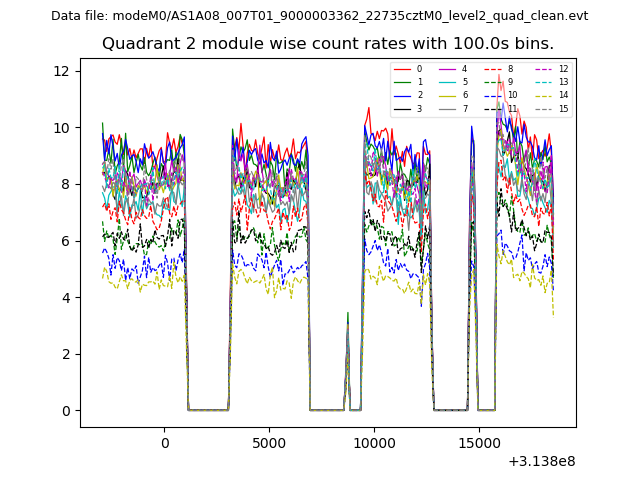
| Module-wise count rates for Quadrant B Data is divided into 100 sec bins |
 |
 |
| Module-wise count rates for Quadrant C Data is divided into 100 sec bins |
 |
 |
| Module-wise count rates for Quadrant D Data is divided into 100 sec bins |
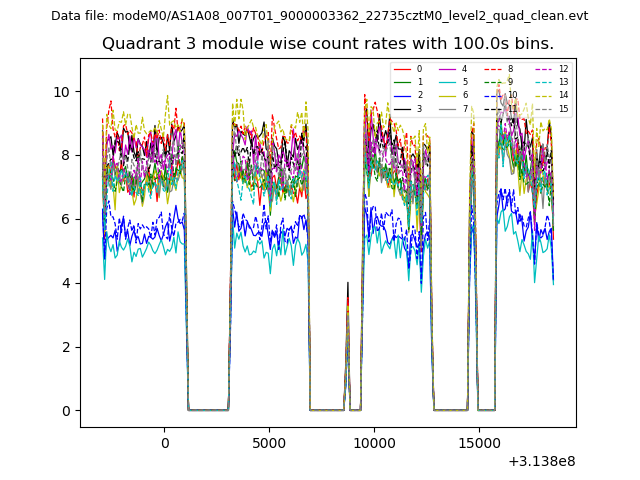 |
 |
| Parameter | Plot |
|---|---|
| CZT HV Monitor | 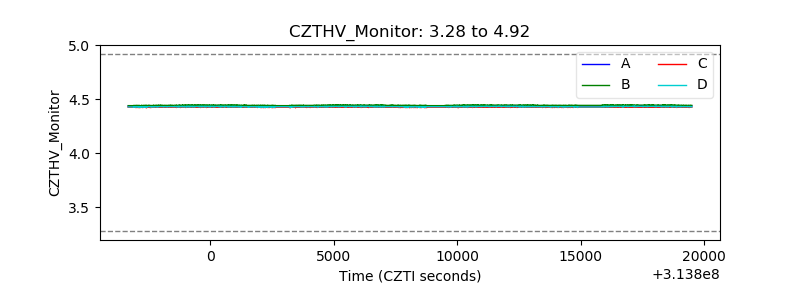 |
| D_VDD |  |
| Temperature 1 | 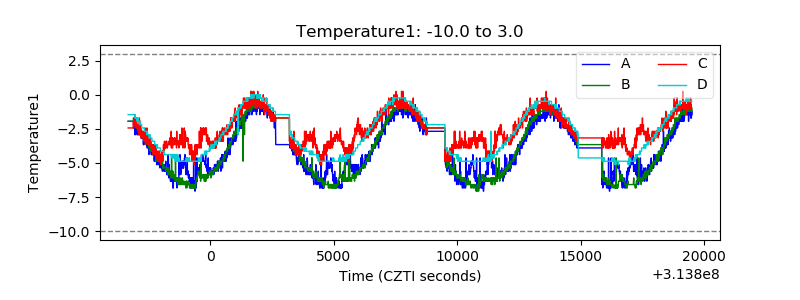 |
| Veto HV Monitor | 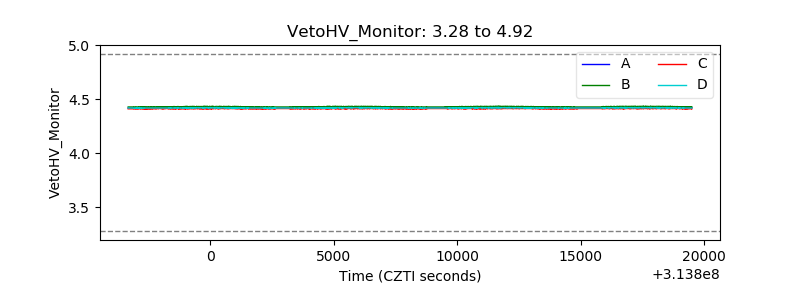 |
| Veto LLD | 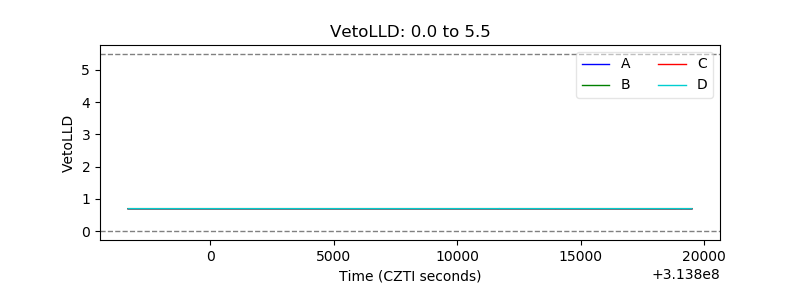 |
| Alpha Counter | 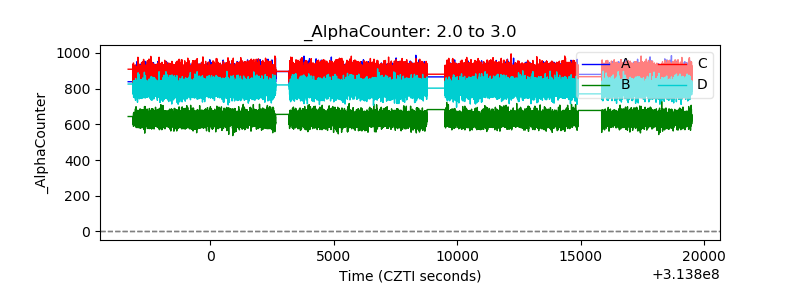 |
| _CPM_Rate | 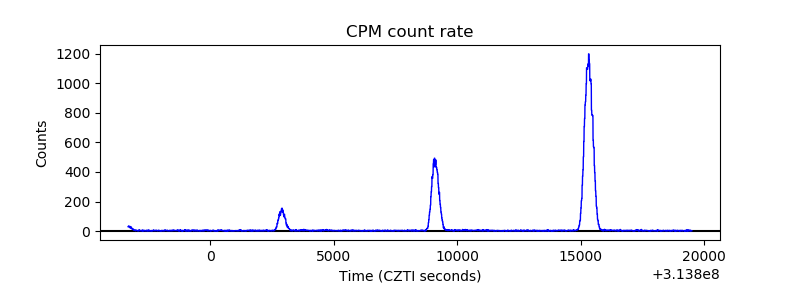 |
| CZT Counter | 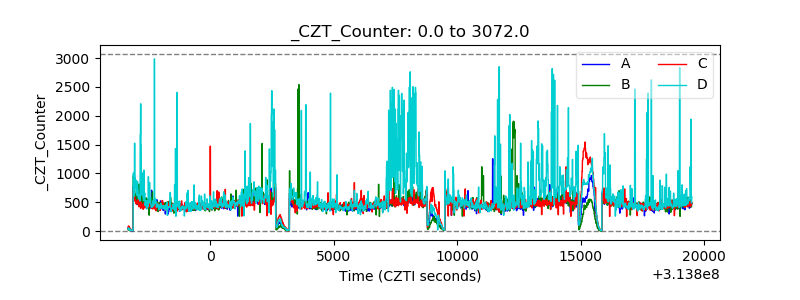 |
| +2.5 Volts monitor |  |
| +5 Volts monitor |  |
| _ROLL_ROT | 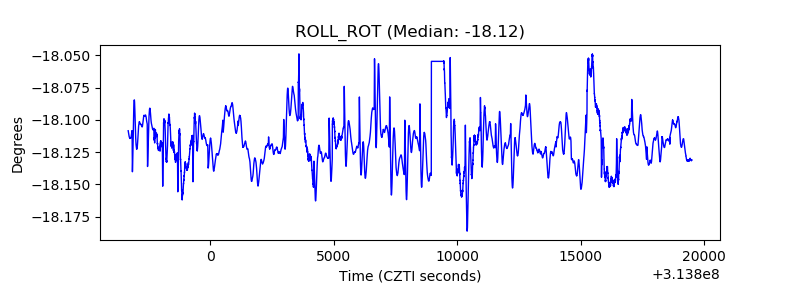 |
| _Roll_DEC | 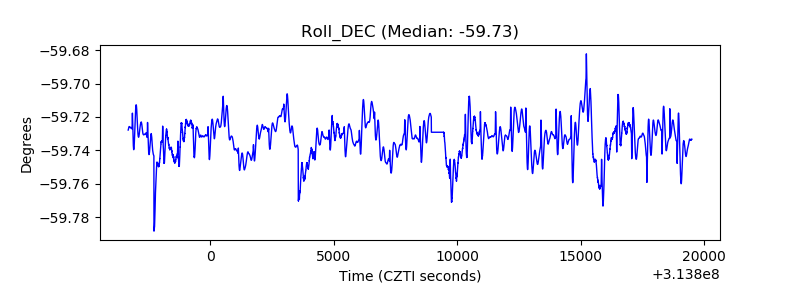 |
| _Roll_RA | 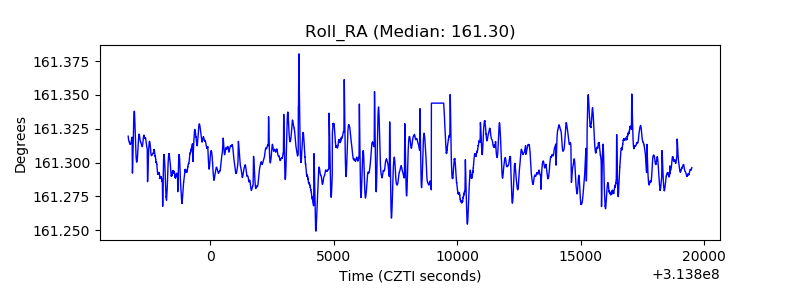 |
| Veto Counter | 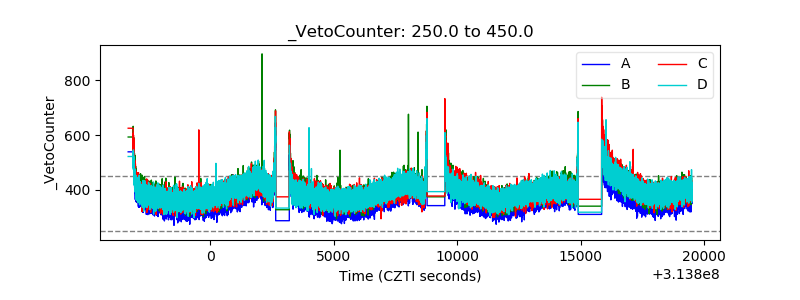 |