| Param | Original file | Final file |
|---|---|---|
| Filename | modeM0/AS1A08_007T01_9000003362_22737cztM0_level2.evt | modeM0/AS1A08_007T01_9000003362_22737cztM0_level2_quad_clean.evt |
| Size (bytes) | 642,271,680 | 125,611,200 |
| Size | 612.5 MB | 119.8 MB |
| Events in quadrant A | 4,435,978 | 802,110 |
| Events in quadrant B | 4,684,067 | 813,700 |
| Events in quadrant C | 4,554,940 | 790,488 |
| Events in quadrant D | 5,163,292 | 770,476 |
| Mode SS | |||
|---|---|---|---|
| Quadrant | BADHDUFLAG | Total packets | Discarded packets |
| A | 0 | 184 | 0 |
| B | 0 | 184 | 0 |
| C | 0 | 184 | 0 |
| D | 0 | 184 | 0 |
| Mode M0 | |||
|---|---|---|---|
| Quadrant | BADHDUFLAG | Total packets | Discarded packets |
| A | 0 | 18765 | 2 |
| B | 0 | 19432 | 2 |
| C | 0 | 19188 | 2 |
| D | 0 | 21138 | 2 |
| Mode M9 | |||
|---|---|---|---|
| Quadrant | BADHDUFLAG | Total packets | Discarded packets |
| A | 0 | 23 | 0 |
| B | 0 | 23 | 0 |
| C | 0 | 23 | 0 |
| D | 0 | 23 | 0 |
| Quadrant | Total seconds | Saturated seconds | Saturation percentage |
|---|---|---|---|
| A | 9047 | 42 | 0.464242% |
| B | 9048 | 71 | 0.784704% |
| C | 9048 | 115 | 1.270999% |
| D | 9048 | 149 | 1.646773% |
Noise dominated data is calculated using 1-second bins in cleaned event files. If a bin has >2000 counts, and if more than 50% of those come from <1% of pixels, then it is considered to be noise-dominated and hence unusable.
| Quadrant | # 1 sec bins | Bins with >0 counts | Bins with >2000 counts | High rate bins dominated by noise | Noise dominated (total time) | Noise dominated (detector-on time) | Marked lightcurve |
|---|---|---|---|---|---|---|---|
| A | 11282 | 9049 | 0 | 0 | 0.00% | 0.00% | 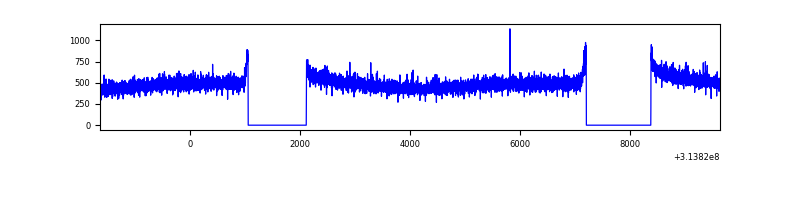 |
| B | 11283 | 9050 | 4 | 4 | 0.04% | 0.04% | 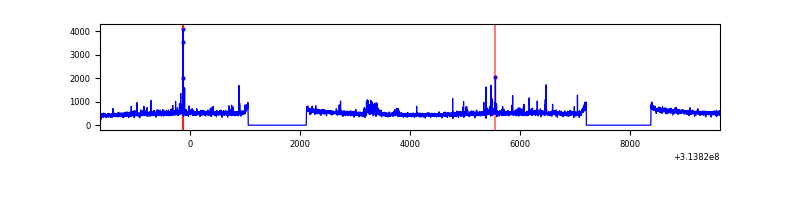 |
| C | 11283 | 9050 | 0 | 0 | 0.00% | 0.00% | 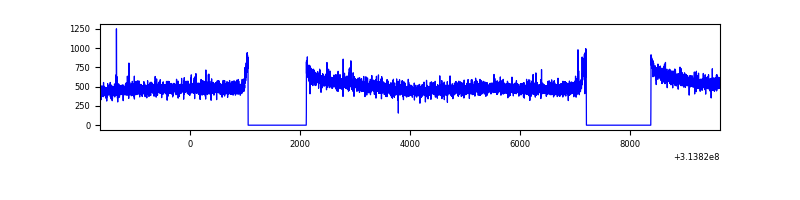 |
| D | 11283 | 9050 | 67 | 67 | 0.59% | 0.74% | 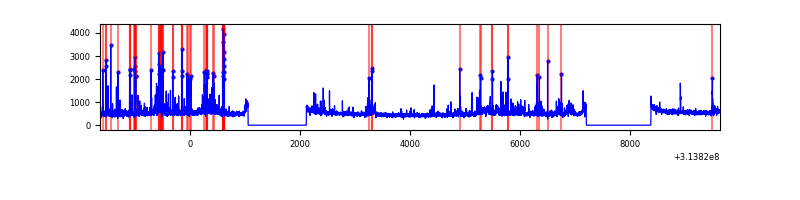 |
Top three noisy pixels from each quadrant. If the there are fewer than three noisy pixels in the level2.evt file, extra rows are filled as -1
| Pixel properties | Quadrant properties | ||||||
|---|---|---|---|---|---|---|---|
| Quadrant | DetID | PixID | Counts | Sigma | Mean | Median | Sigma |
| A | 13 | 254 | 14151 | 56.88 | 1150 | 1126 | 229.0 |
| A | 0 | 226 | 10062 | 39.02 | 1150 | 1126 | 229.0 |
| A | 3 | 137 | 9224 | 35.36 | 1150 | 1126 | 229.0 |
| B | 0 | 197 | 80545 | 371.81 | 1144 | 1117 | 213.6 |
| B | 0 | 230 | 65407 | 300.94 | 1144 | 1117 | 213.6 |
| B | 0 | 245 | 36718 | 166.65 | 1144 | 1117 | 213.6 |
| C | 14 | 238 | 176397 | 679.24 | 1118 | 1126 | 258.0 |
| C | 10 | 22 | 17867 | 64.88 | 1118 | 1126 | 258.0 |
| C | 13 | 61 | 7764 | 25.72 | 1118 | 1126 | 258.0 |
| D | 1 | 52 | 402570 | 1477.62 | 1133 | 1103 | 271.7 |
| D | 12 | 227 | 144594 | 528.13 | 1133 | 1103 | 271.7 |
| D | 12 | 233 | 139579 | 509.67 | 1133 | 1103 | 271.7 |
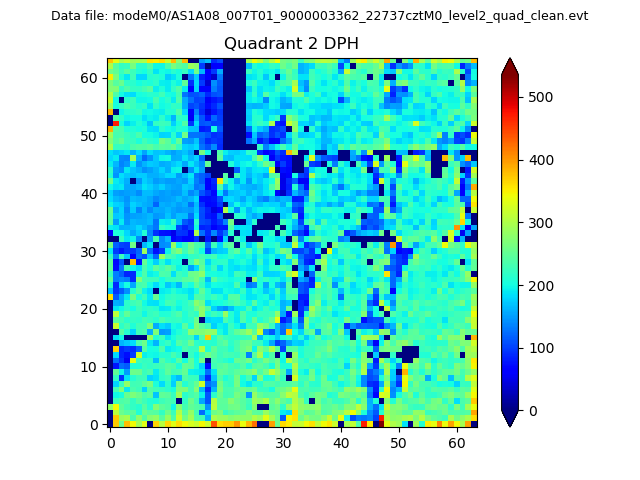
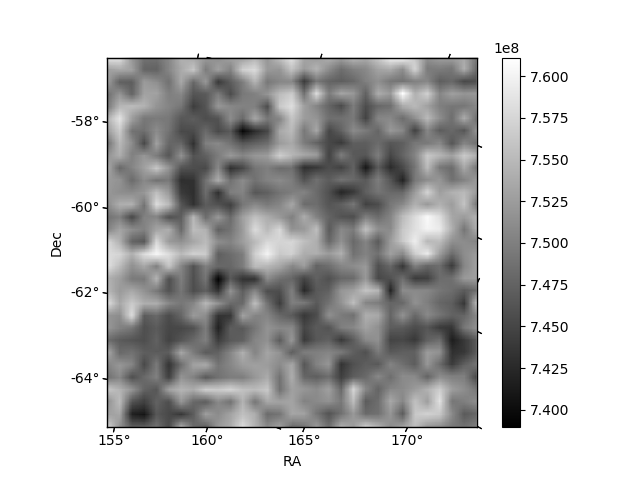
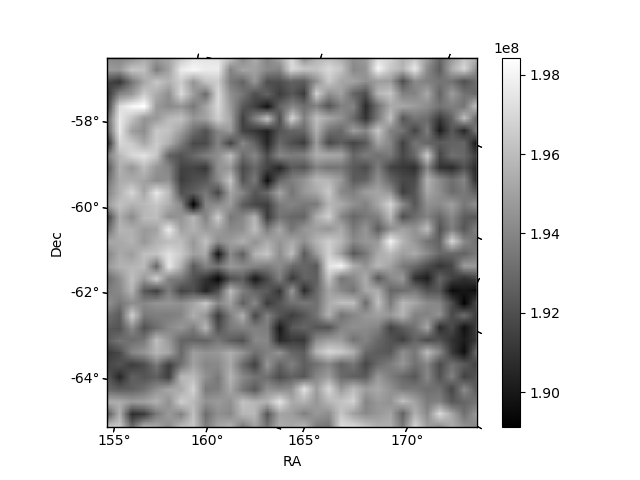
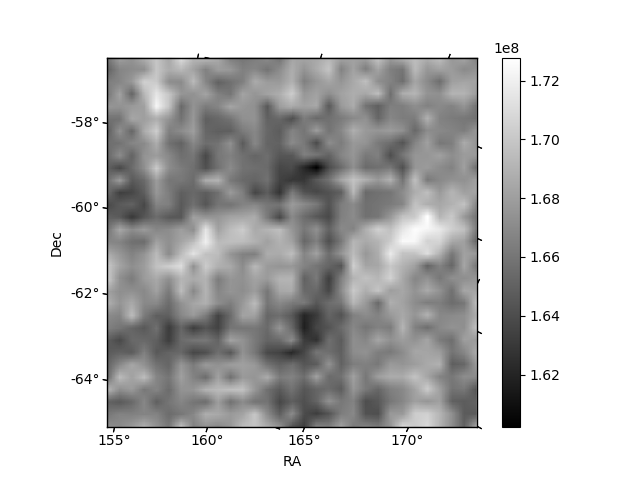
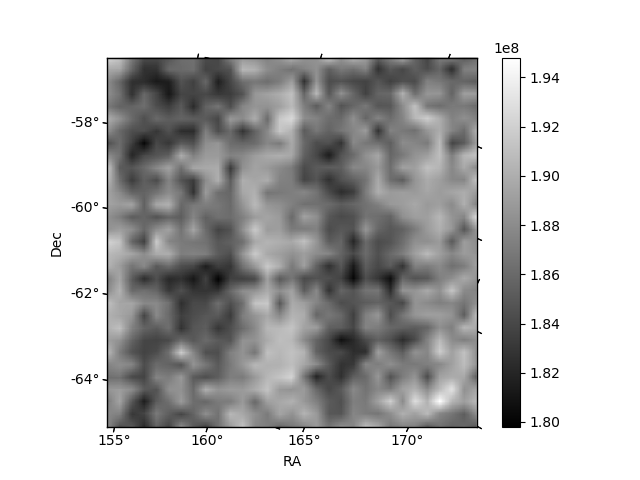
Histogram calculated using DETX and DETY for each event in the final _common_clean file
| Quadrant A | 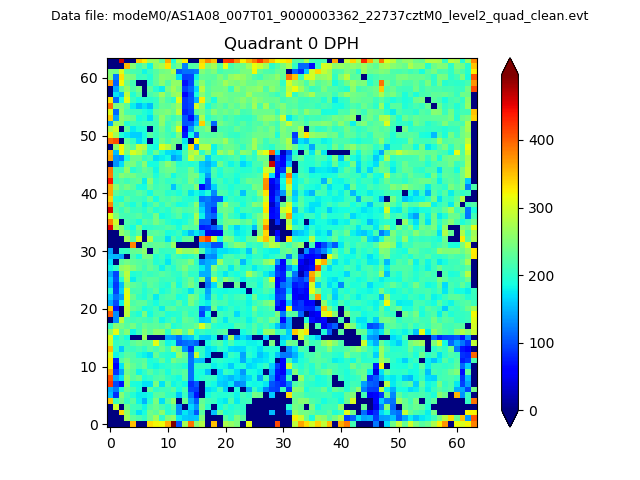 |
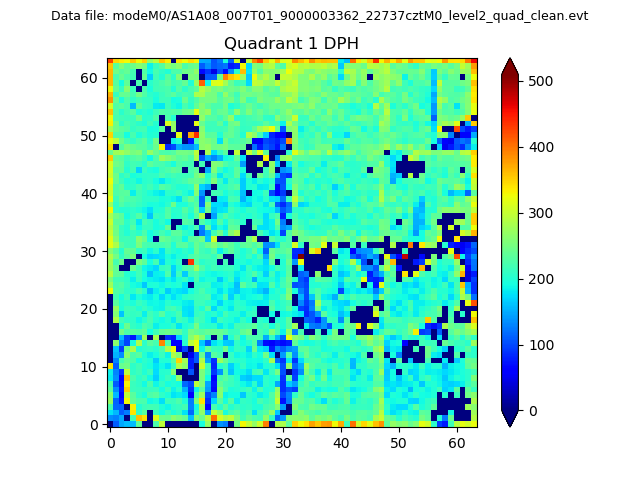 |
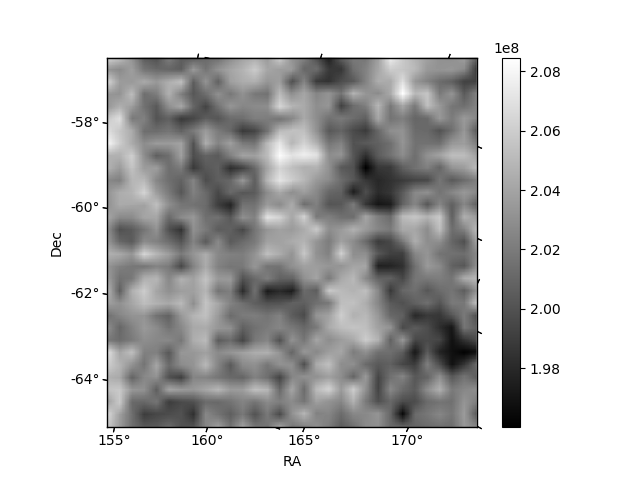
Quadrant B |
|---|---|---|---|
| Quadrant D | 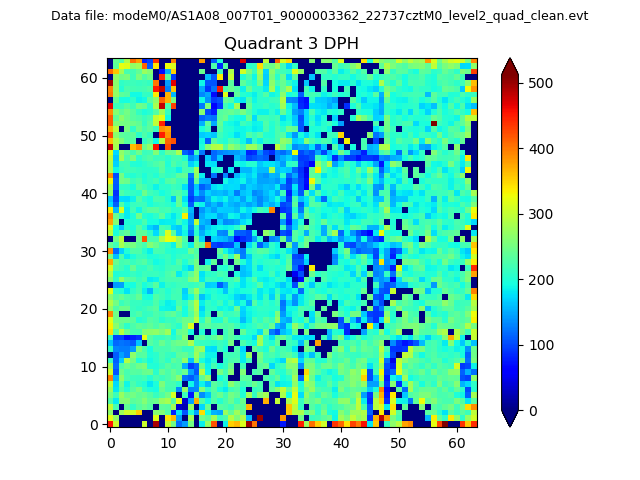 |
 |
Quadrant C |
| Plot type | Count rate plots | Images |
|---|---|---|
| Comparison with Poisson distribution Blue bars denote a histogram of data divided into 1 sec bins. Red curve is a Poisson curve with rate = median count rate of data. |
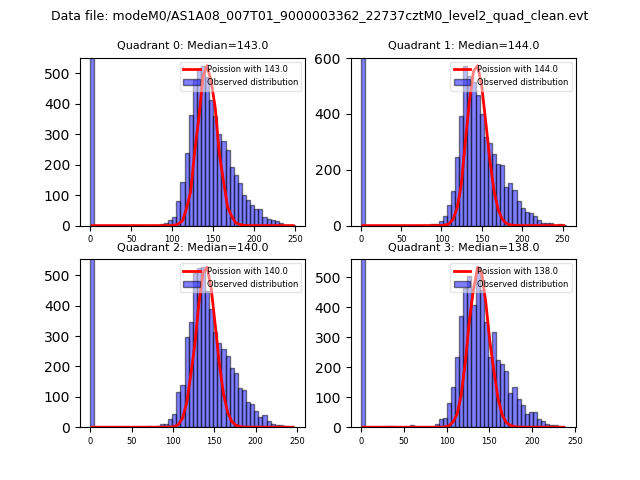 |
 |
| Quadrant-wise count rates Data is divided into 100 sec bins |
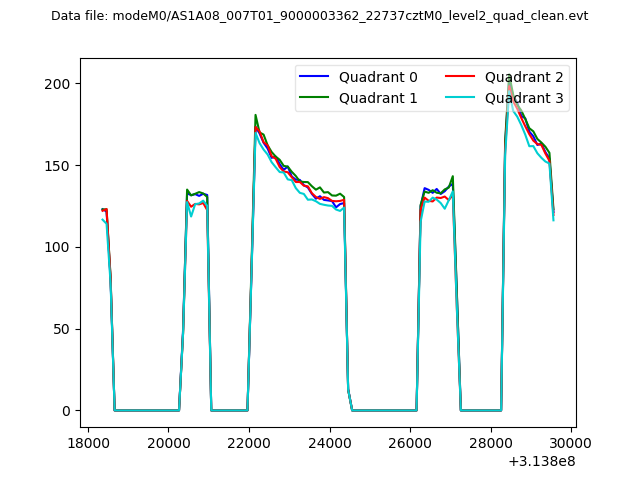 |
|
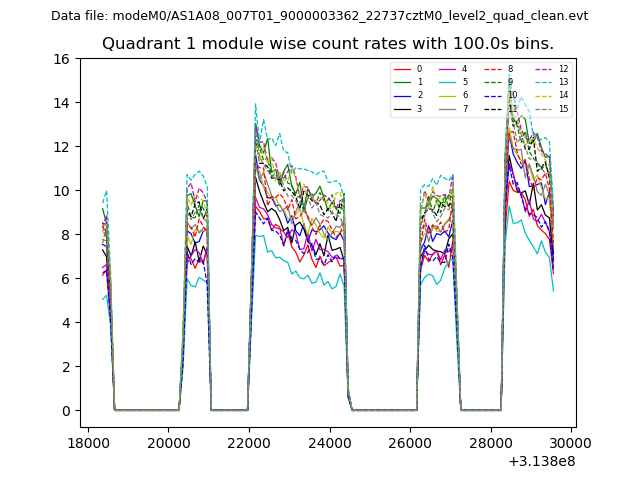
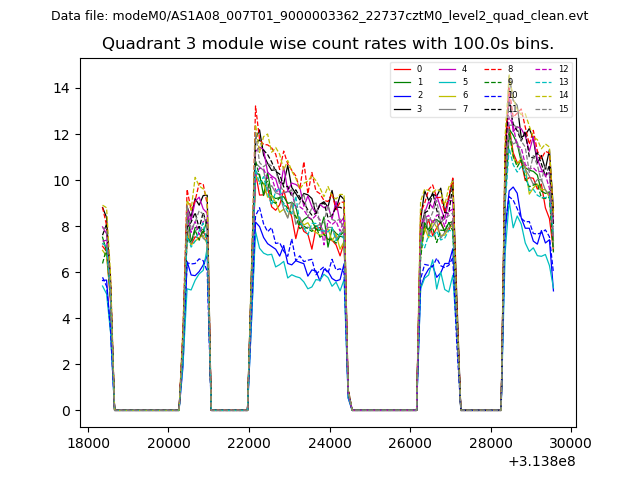
| Module-wise count rates for Quadrant A Data is divided into 100 sec bins |
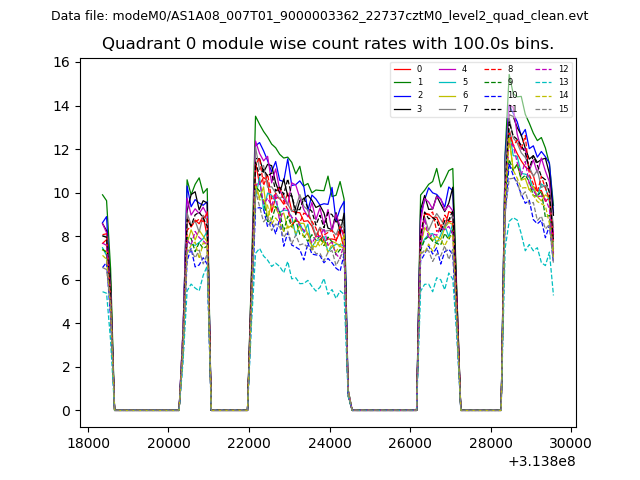 |
 |
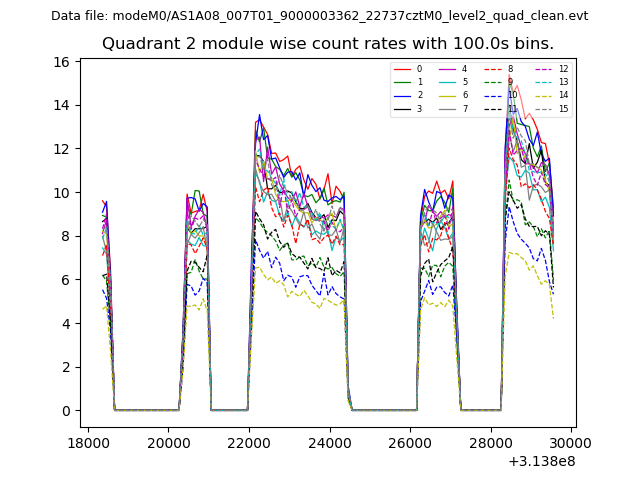
| Module-wise count rates for Quadrant B Data is divided into 100 sec bins |
 |
 |
| Module-wise count rates for Quadrant C Data is divided into 100 sec bins |
 |
 |
| Module-wise count rates for Quadrant D Data is divided into 100 sec bins |
 |
 |
| Parameter | Plot |
|---|---|
| CZT HV Monitor | 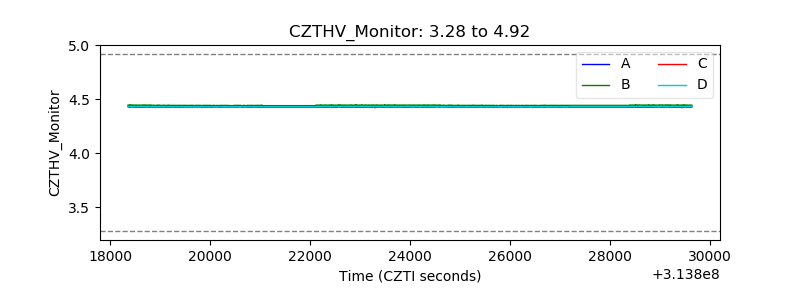 |
| D_VDD | 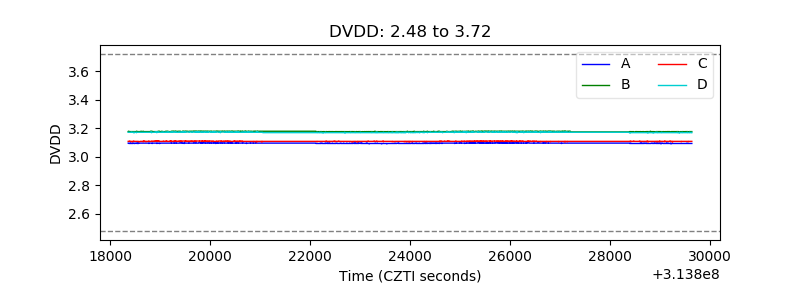 |
| Temperature 1 | 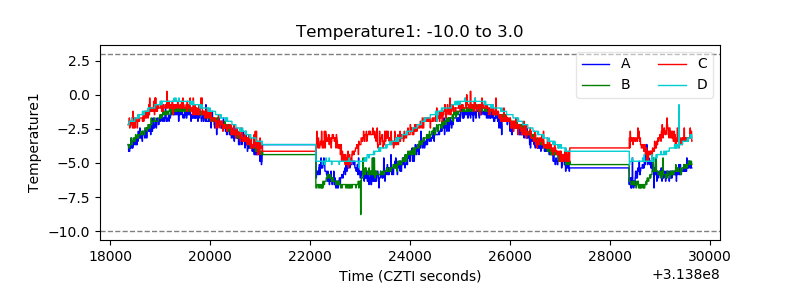 |
| Veto HV Monitor | 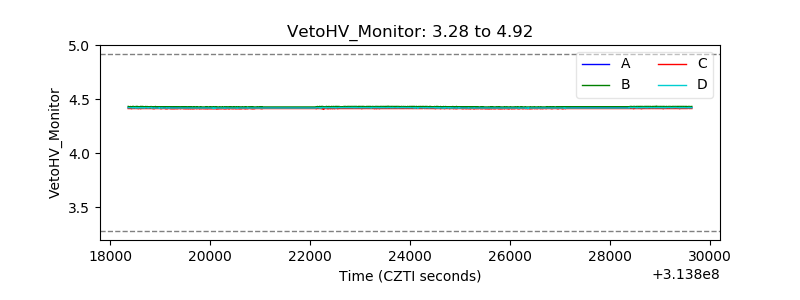 |
| Veto LLD | 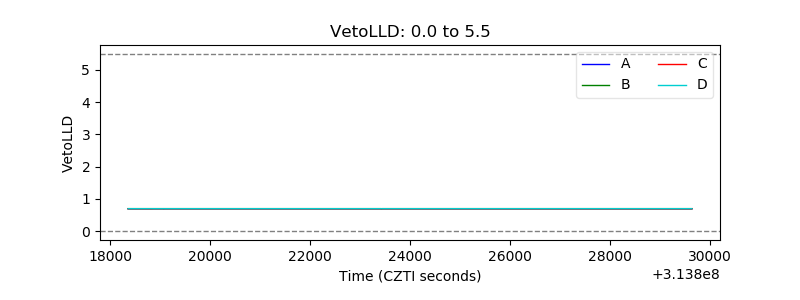 |
| Alpha Counter | 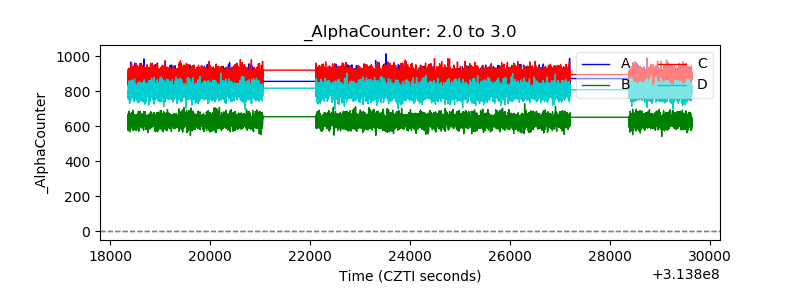 |
| _CPM_Rate |  |
| CZT Counter | 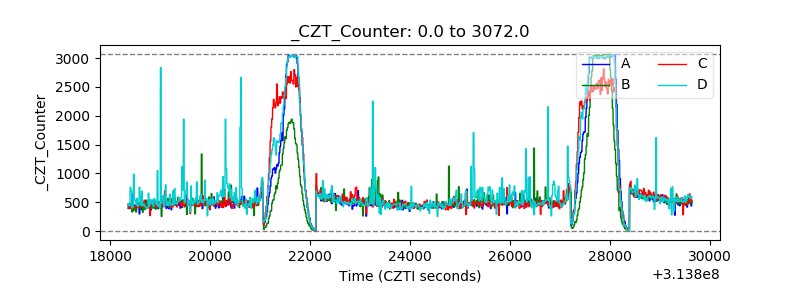 |
| +2.5 Volts monitor |  |
| +5 Volts monitor |  |
| _ROLL_ROT | 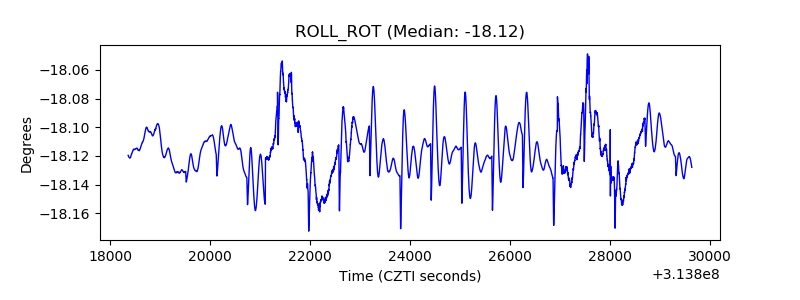 |
| _Roll_DEC | 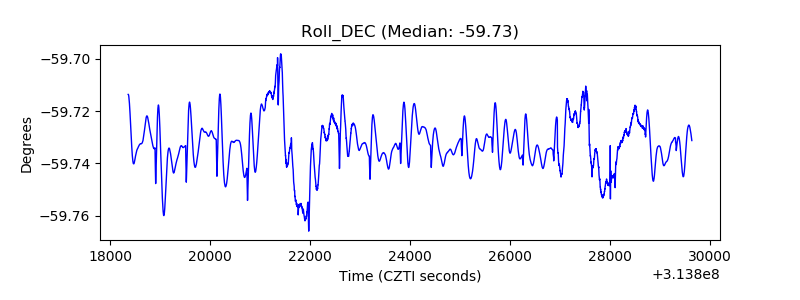 |
| _Roll_RA | 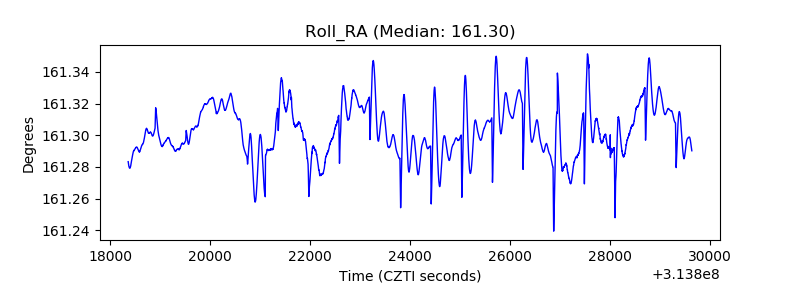 |
| Veto Counter | 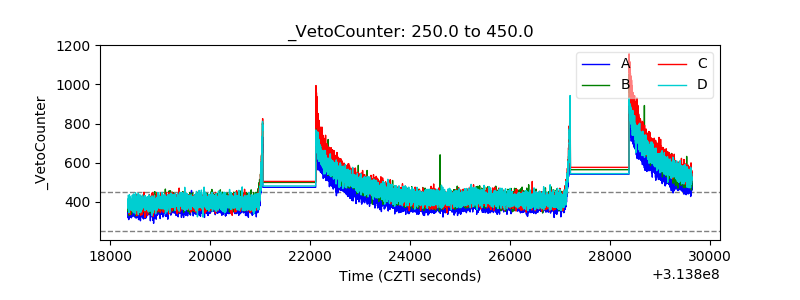 |