| Param | Original file | Final file |
|---|---|---|
| Filename | modeM0/AS1A08_007T01_9000003362_22740cztM0_level2.evt | modeM0/AS1A08_007T01_9000003362_22740cztM0_level2_quad_clean.evt |
| Size (bytes) | 471,360,960 | 86,567,040 |
| Size | 449.5 MB | 82.6 MB |
| Events in quadrant A | 3,269,309 | 563,639 |
| Events in quadrant B | 3,370,555 | 568,603 |
| Events in quadrant C | 3,416,383 | 535,690 |
| Events in quadrant D | 3,805,991 | 528,648 |
| Mode SS | |||
|---|---|---|---|
| Quadrant | BADHDUFLAG | Total packets | Discarded packets |
| A | 0 | 122 | 0 |
| B | 0 | 122 | 0 |
| C | 0 | 122 | 0 |
| D | 0 | 122 | 0 |
| Mode M0 | |||
|---|---|---|---|
| Quadrant | BADHDUFLAG | Total packets | Discarded packets |
| A | 0 | 13273 | 1 |
| B | 0 | 13542 | 1 |
| C | 0 | 13921 | 2 |
| D | 0 | 15311 | 1 |
| Mode M9 | |||
|---|---|---|---|
| Quadrant | BADHDUFLAG | Total packets | Discarded packets |
| A | 0 | 14 | 0 |
| B | 0 | 14 | 0 |
| C | 0 | 14 | 0 |
| D | 0 | 14 | 0 |
| Quadrant | Total seconds | Saturated seconds | Saturation percentage |
|---|---|---|---|
| A | 6090 | 89 | 1.461412% |
| B | 6090 | 92 | 1.510673% |
| C | 6089 | 146 | 2.397766% |
| D | 6089 | 141 | 2.315651% |
Noise dominated data is calculated using 1-second bins in cleaned event files. If a bin has >2000 counts, and if more than 50% of those come from <1% of pixels, then it is considered to be noise-dominated and hence unusable.
| Quadrant | # 1 sec bins | Bins with >0 counts | Bins with >2000 counts | High rate bins dominated by noise | Noise dominated (total time) | Noise dominated (detector-on time) | Marked lightcurve |
|---|---|---|---|---|---|---|---|
| A | 7420 | 6091 | 0 | 0 | 0.00% | 0.00% | 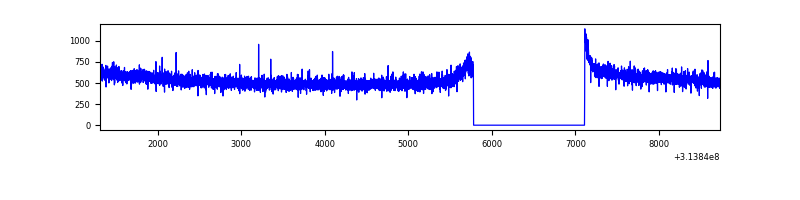 |
| B | 7420 | 6091 | 2 | 2 | 0.03% | 0.03% | 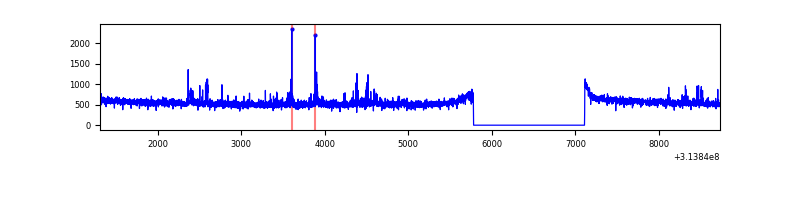 |
| C | 7419 | 6090 | 9 | 9 | 0.12% | 0.15% | 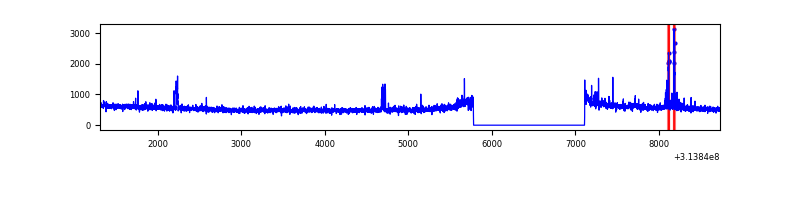 |
| D | 7419 | 6090 | 47 | 47 | 0.63% | 0.77% | 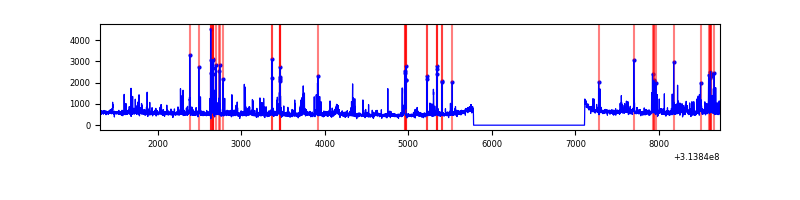 |
Top three noisy pixels from each quadrant. If the there are fewer than three noisy pixels in the level2.evt file, extra rows are filled as -1
| Pixel properties | Quadrant properties | ||||||
|---|---|---|---|---|---|---|---|
| Quadrant | DetID | PixID | Counts | Sigma | Mean | Median | Sigma |
| A | 13 | 254 | 10157 | 55.06 | 848 | 834 | 169.3 |
| A | 0 | 226 | 7552 | 39.68 | 848 | 834 | 169.3 |
| A | 12 | 194 | 6112 | 31.17 | 848 | 834 | 169.3 |
| B | 0 | 245 | 44049 | 284.27 | 833 | 815 | 152.1 |
| B | 0 | 190 | 31595 | 202.38 | 833 | 815 | 152.1 |
| B | 0 | 197 | 30732 | 196.71 | 833 | 815 | 152.1 |
| C | 14 | 238 | 130914 | 710.29 | 803 | 809 | 183.2 |
| C | 0 | 207 | 94975 | 514.09 | 803 | 809 | 183.2 |
| C | 10 | 22 | 57973 | 312.08 | 803 | 809 | 183.2 |
| D | 1 | 52 | 297996 | 1502.89 | 824 | 802 | 197.7 |
| D | 12 | 233 | 160286 | 806.5 | 824 | 802 | 197.7 |
| D | 12 | 227 | 90666 | 454.43 | 824 | 802 | 197.7 |
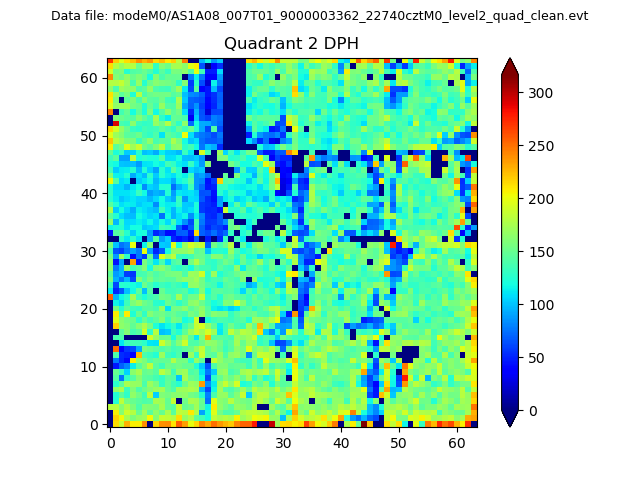
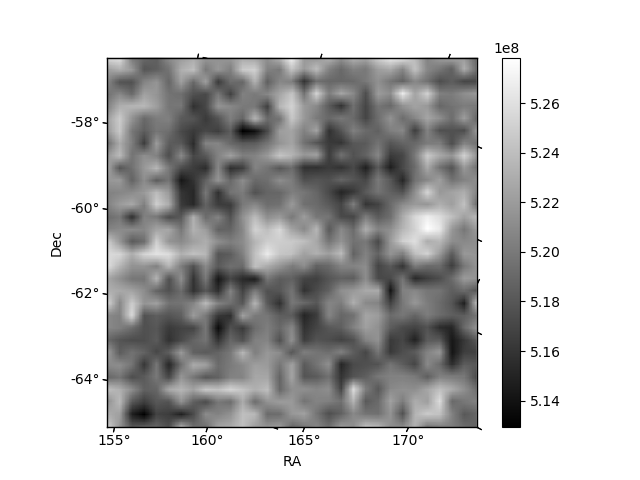
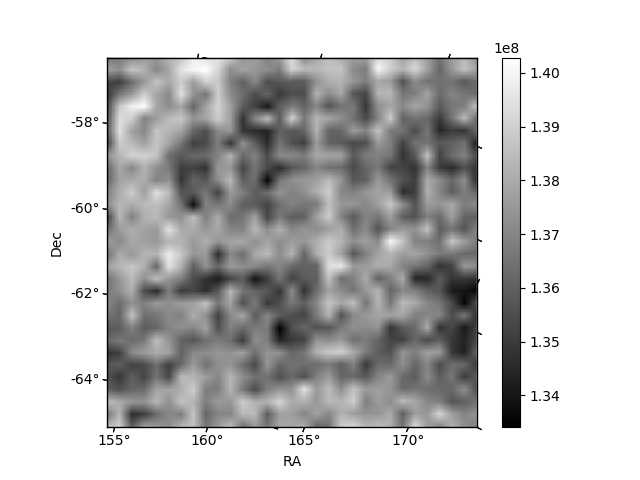
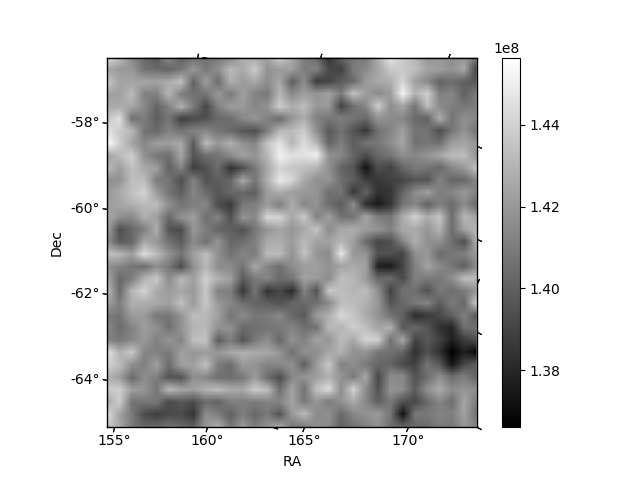
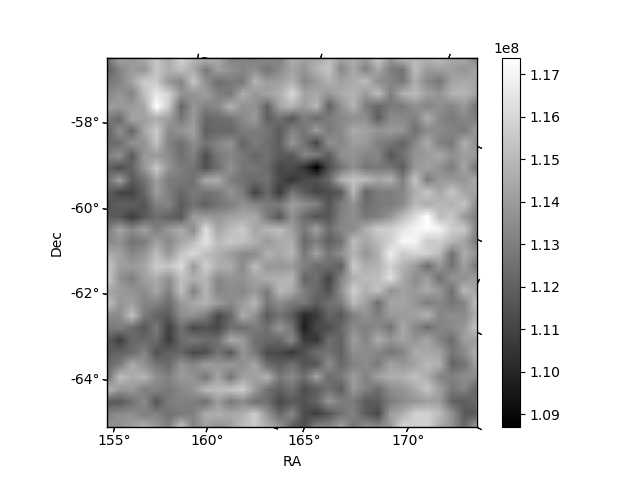
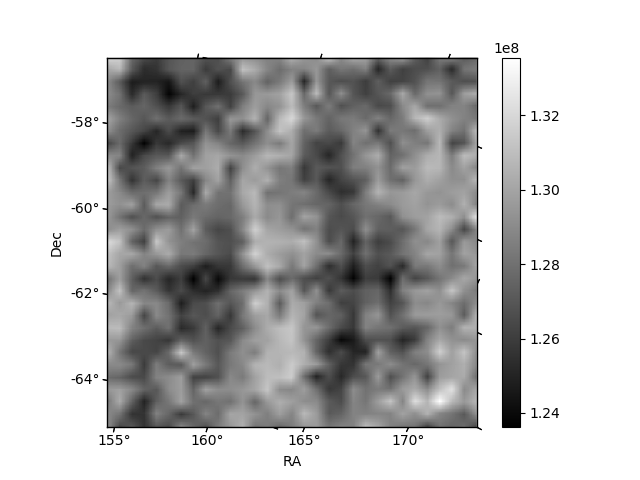
Histogram calculated using DETX and DETY for each event in the final _common_clean file
| Quadrant A | 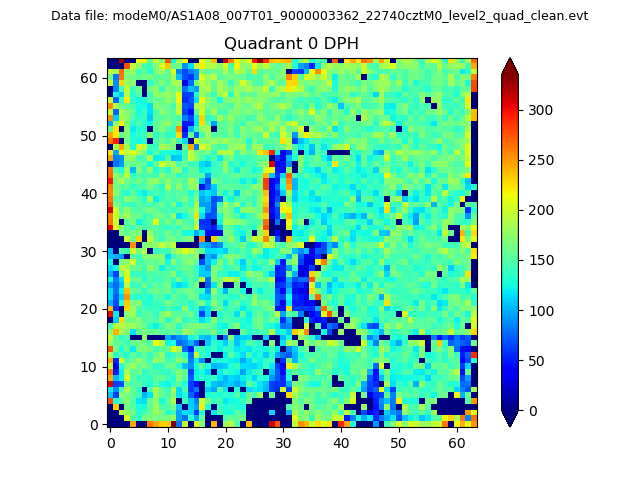 |
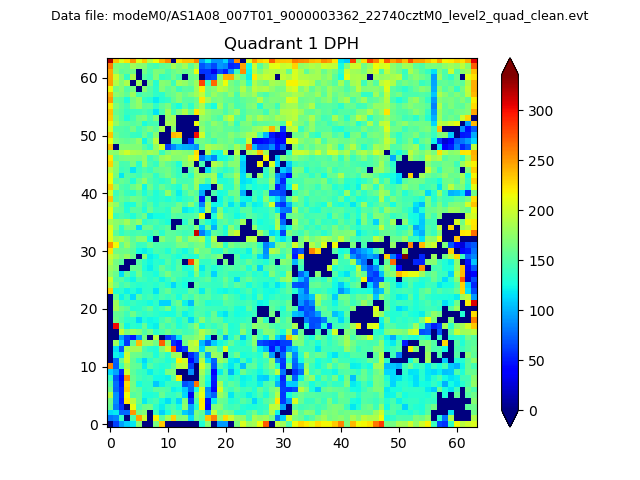 |
Quadrant B |
|---|---|---|---|
| Quadrant D | 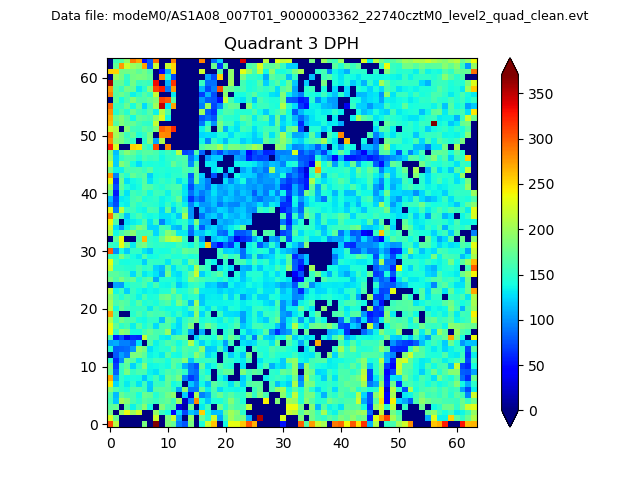 |
 |
Quadrant C |
| Plot type | Count rate plots | Images |
|---|---|---|
| Comparison with Poisson distribution Blue bars denote a histogram of data divided into 1 sec bins. Red curve is a Poisson curve with rate = median count rate of data. |
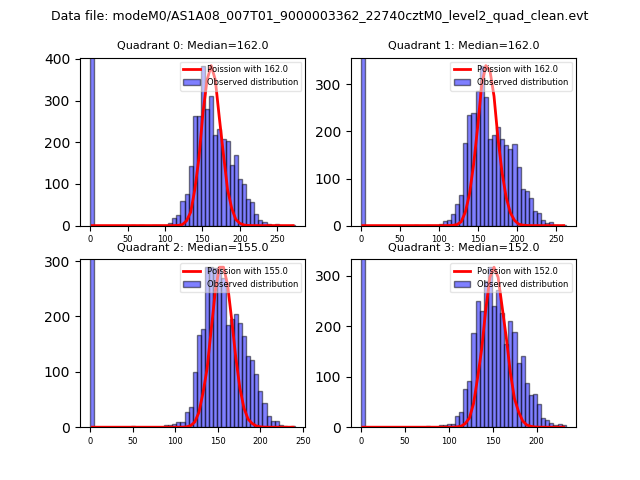 |
 |
| Quadrant-wise count rates Data is divided into 100 sec bins |
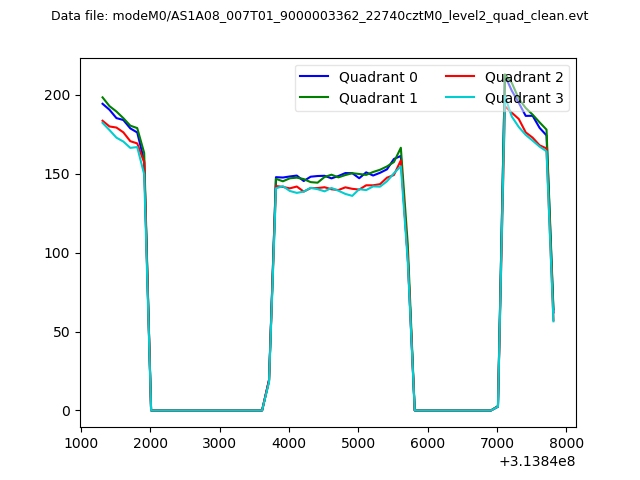 |
|
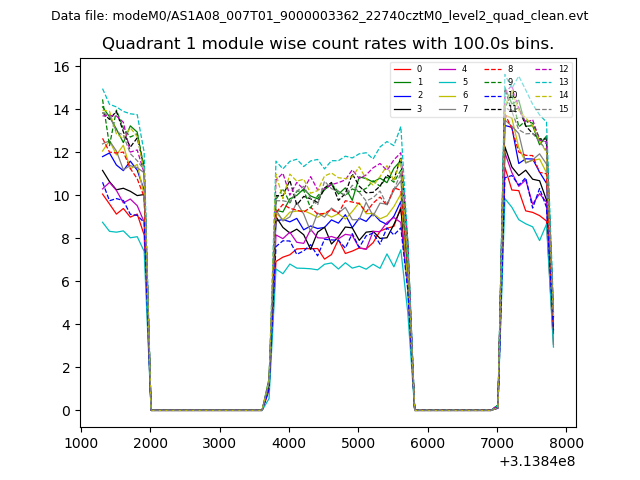
| Module-wise count rates for Quadrant A Data is divided into 100 sec bins |
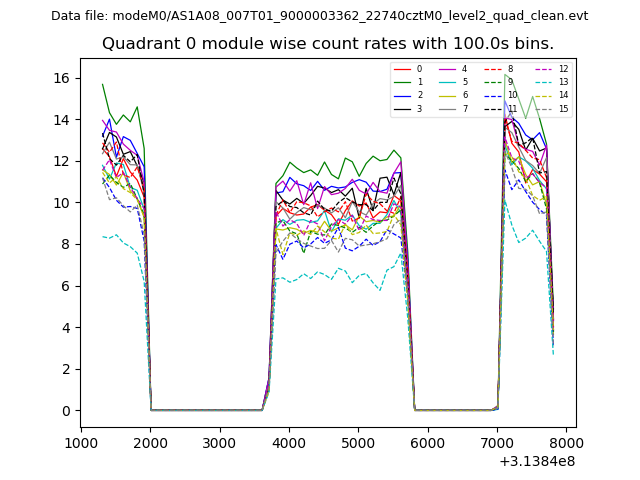 |
 |
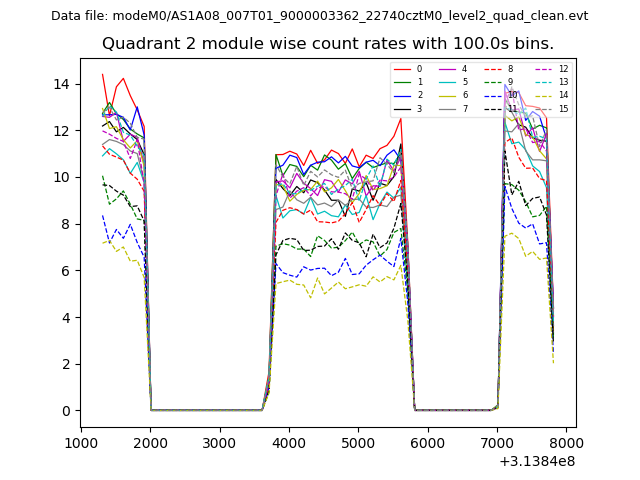
| Module-wise count rates for Quadrant B Data is divided into 100 sec bins |
 |
 |
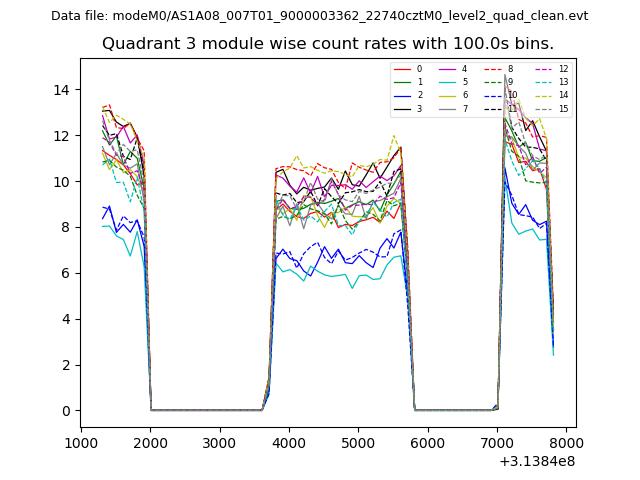
| Module-wise count rates for Quadrant C Data is divided into 100 sec bins |
 |
 |
| Module-wise count rates for Quadrant D Data is divided into 100 sec bins |
 |
 |
| Parameter | Plot |
|---|---|
| CZT HV Monitor | 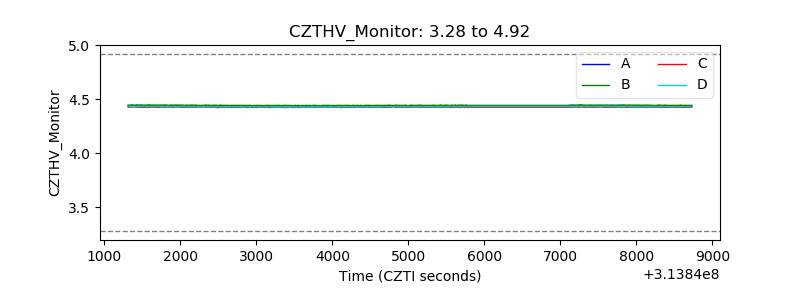 |
| D_VDD |  |
| Temperature 1 | 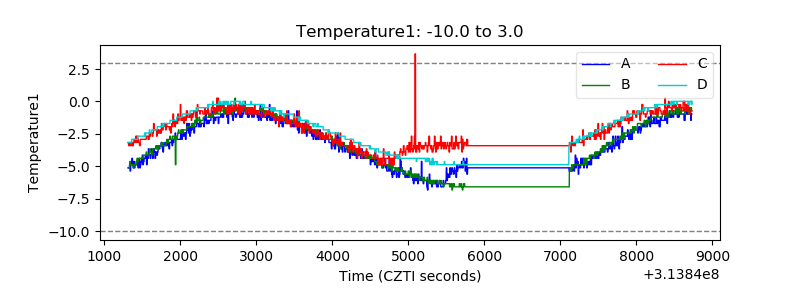 |
| Veto HV Monitor | 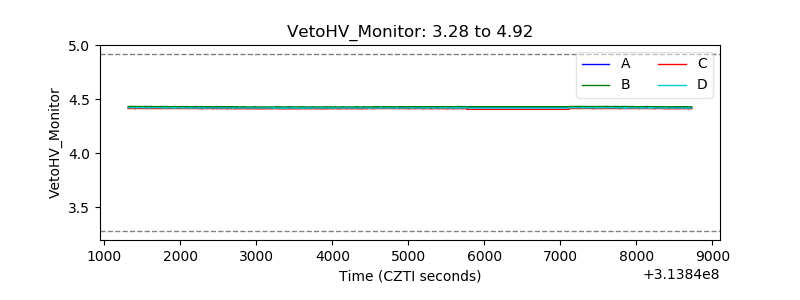 |
| Veto LLD | 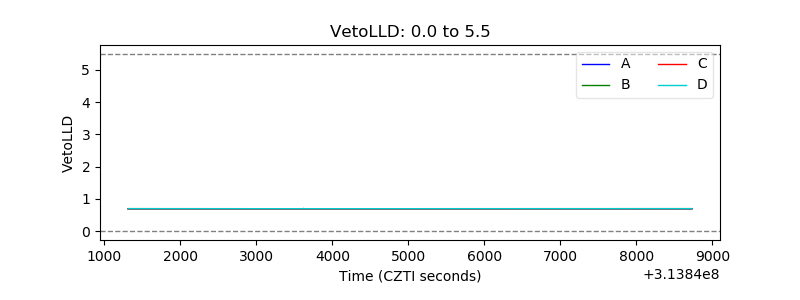 |
| Alpha Counter | 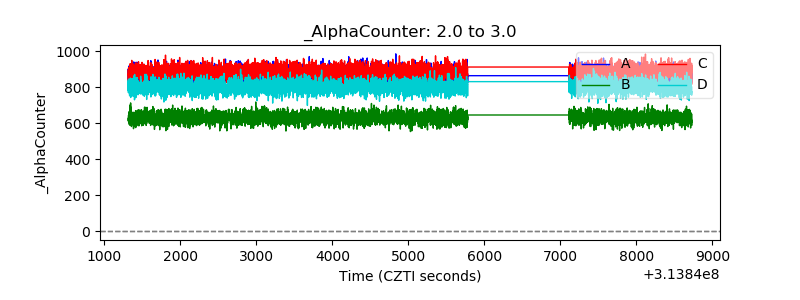 |
| _CPM_Rate | 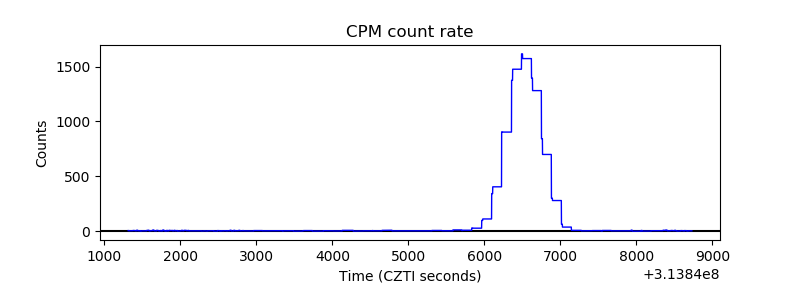 |
| CZT Counter | 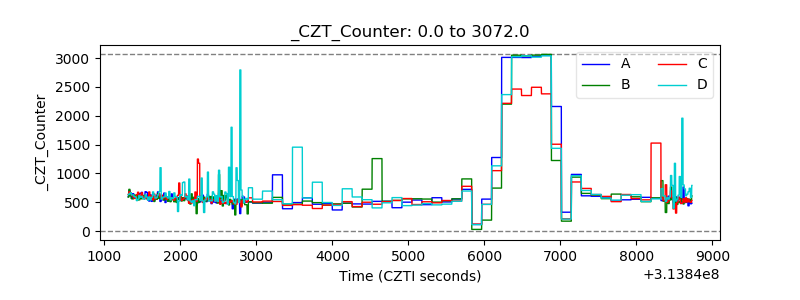 |
| +2.5 Volts monitor |  |
| +5 Volts monitor |  |
| _ROLL_ROT | 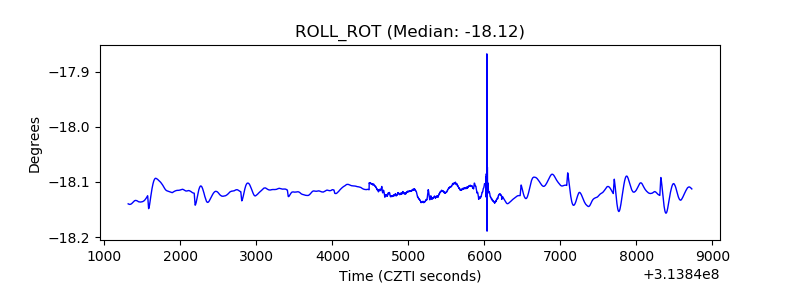 |
| _Roll_DEC | 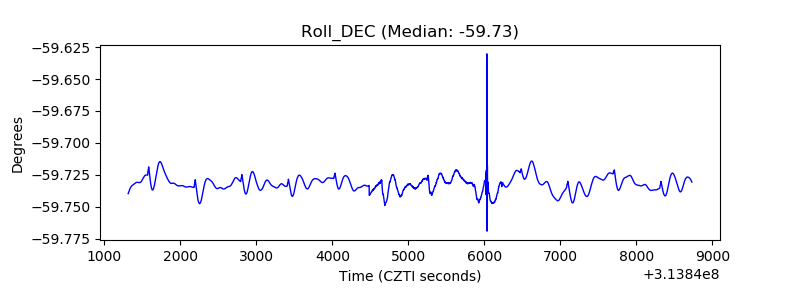 |
| _Roll_RA | 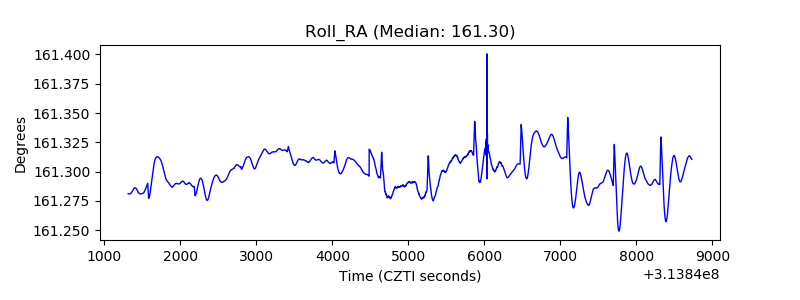 |
| Veto Counter | 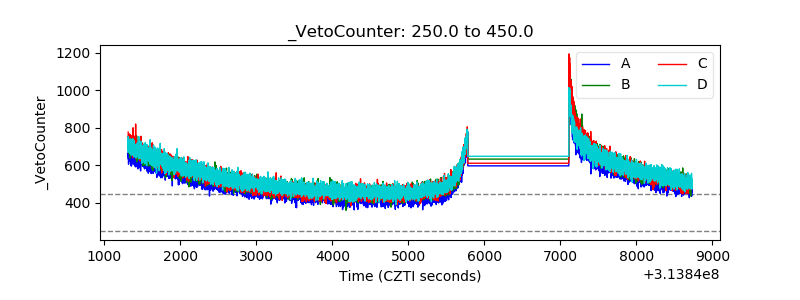 |