| Param | Original file | Final file |
|---|---|---|
| Filename | modeM0/AS1A08_007T01_9000003362_22741cztM0_level2.evt | modeM0/AS1A08_007T01_9000003362_22741cztM0_level2_quad_clean.evt |
| Size (bytes) | 541,468,800 | 86,682,240 |
| Size | 516.4 MB | 82.7 MB |
| Events in quadrant A | 3,503,119 | 562,590 |
| Events in quadrant B | 3,635,665 | 566,088 |
| Events in quadrant C | 3,609,711 | 533,347 |
| Events in quadrant D | 5,198,928 | 498,883 |
| Mode SS | |||
|---|---|---|---|
| Quadrant | BADHDUFLAG | Total packets | Discarded packets |
| A | 0 | 134 | 0 |
| B | 0 | 134 | 0 |
| C | 0 | 134 | 0 |
| D | 0 | 134 | 0 |
| Mode M0 | |||
|---|---|---|---|
| Quadrant | BADHDUFLAG | Total packets | Discarded packets |
| A | 0 | 14353 | 2 |
| B | 0 | 14711 | 2 |
| C | 0 | 14831 | 2 |
| D | 0 | 19893 | 2 |
| Mode M9 | |||
|---|---|---|---|
| Quadrant | BADHDUFLAG | Total packets | Discarded packets |
| A | 0 | 14 | 0 |
| B | 0 | 15 | 0 |
| C | 0 | 15 | 0 |
| D | 0 | 15 | 0 |
| Quadrant | Total seconds | Saturated seconds | Saturation percentage |
|---|---|---|---|
| A | 6654 | 134 | 2.013826% |
| B | 6654 | 176 | 2.645026% |
| C | 6654 | 211 | 3.171025% |
| D | 6654 | 478 | 7.183649% |
Noise dominated data is calculated using 1-second bins in cleaned event files. If a bin has >2000 counts, and if more than 50% of those come from <1% of pixels, then it is considered to be noise-dominated and hence unusable.
| Quadrant | # 1 sec bins | Bins with >0 counts | Bins with >2000 counts | High rate bins dominated by noise | Noise dominated (total time) | Noise dominated (detector-on time) | Marked lightcurve |
|---|---|---|---|---|---|---|---|
| A | 7869 | 6655 | 0 | 0 | 0.00% | 0.00% | 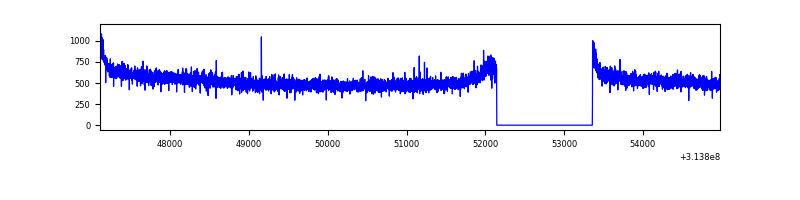 |
| B | 7869 | 6655 | 7 | 7 | 0.09% | 0.11% | 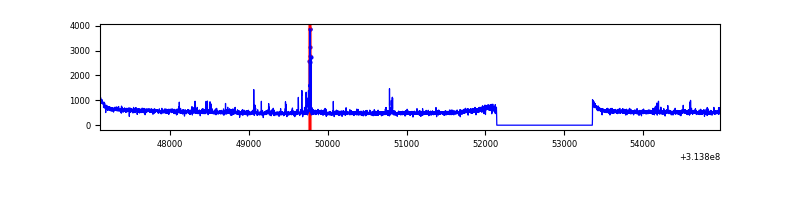 |
| C | 7869 | 6655 | 9 | 9 | 0.11% | 0.14% | 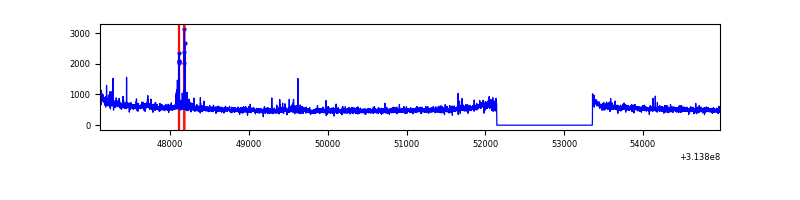 |
| D | 7869 | 6655 | 310 | 310 | 3.94% | 4.66% | 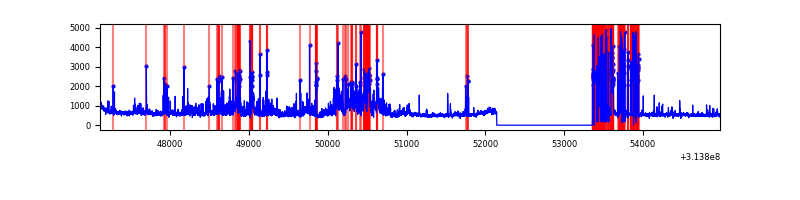 |
Top three noisy pixels from each quadrant. If the there are fewer than three noisy pixels in the level2.evt file, extra rows are filled as -1
| Pixel properties | Quadrant properties | ||||||
|---|---|---|---|---|---|---|---|
| Quadrant | DetID | PixID | Counts | Sigma | Mean | Median | Sigma |
| A | 13 | 254 | 11777 | 60.57 | 908 | 891 | 179.7 |
| A | 0 | 226 | 8020 | 39.66 | 908 | 891 | 179.7 |
| A | 3 | 137 | 6758 | 32.64 | 908 | 891 | 179.7 |
| B | 0 | 228 | 63135 | 382.19 | 894 | 874 | 162.9 |
| B | 0 | 197 | 25152 | 149.03 | 894 | 874 | 162.9 |
| B | 0 | 230 | 22102 | 130.31 | 894 | 874 | 162.9 |
| C | 14 | 238 | 139761 | 710.06 | 856 | 861 | 195.6 |
| C | 0 | 207 | 98121 | 497.2 | 856 | 861 | 195.6 |
| C | 10 | 22 | 24878 | 122.78 | 856 | 861 | 195.6 |
| D | 1 | 52 | 1246367 | 6096.47 | 852 | 826 | 204.3 |
| D | 12 | 227 | 532869 | 2604.15 | 852 | 826 | 204.3 |
| D | 12 | 233 | 68665 | 332.04 | 852 | 826 | 204.3 |
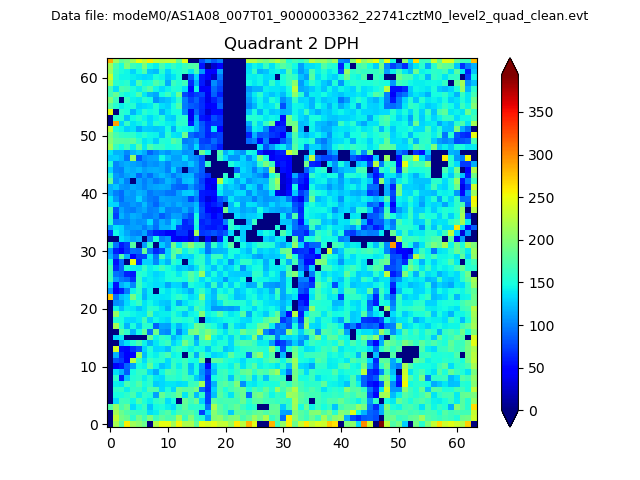
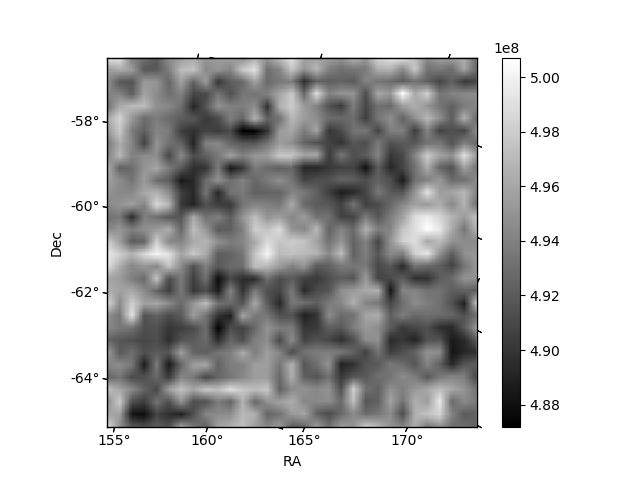
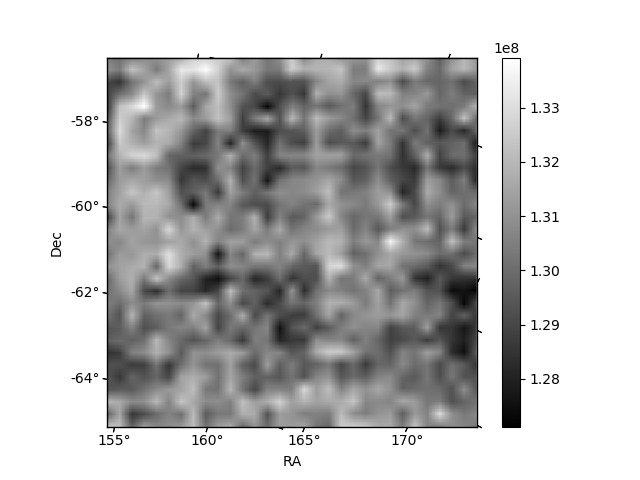
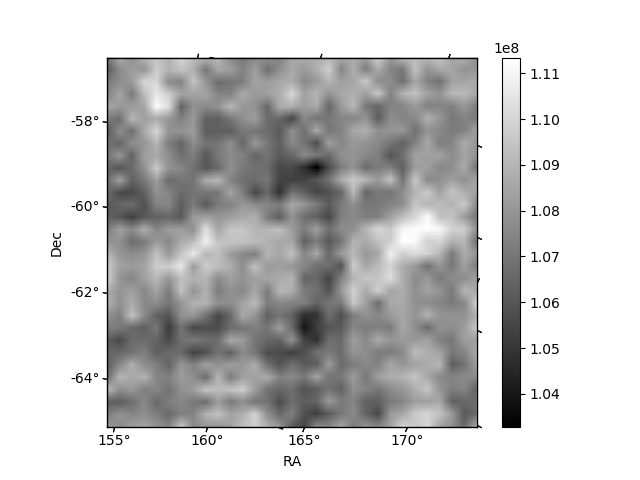
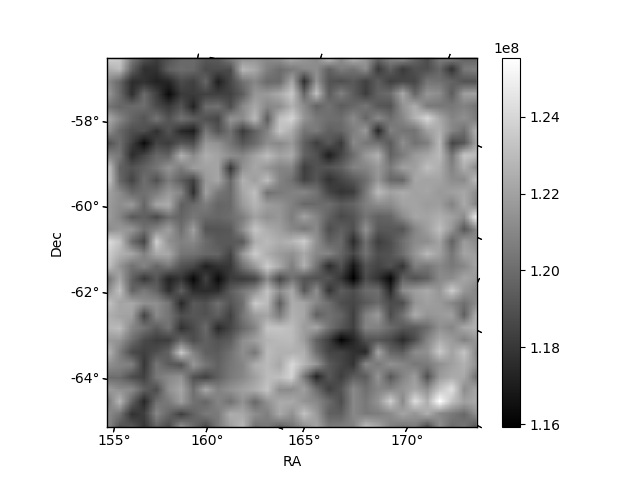
Histogram calculated using DETX and DETY for each event in the final _common_clean file
| Quadrant A | 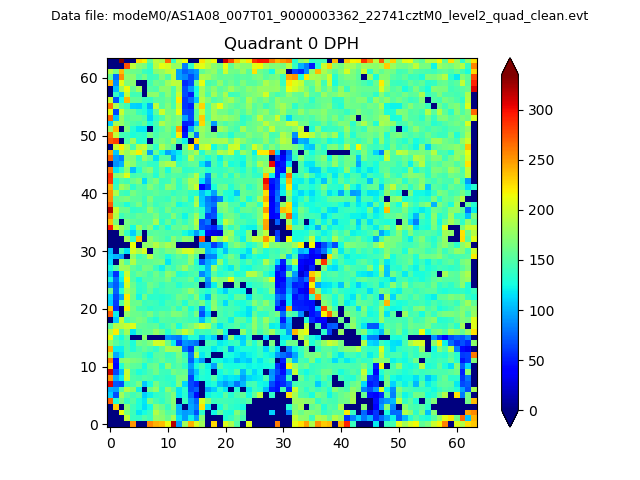 |
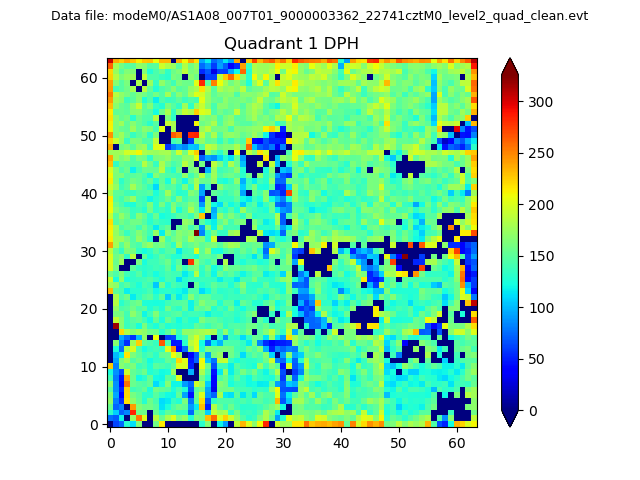 |
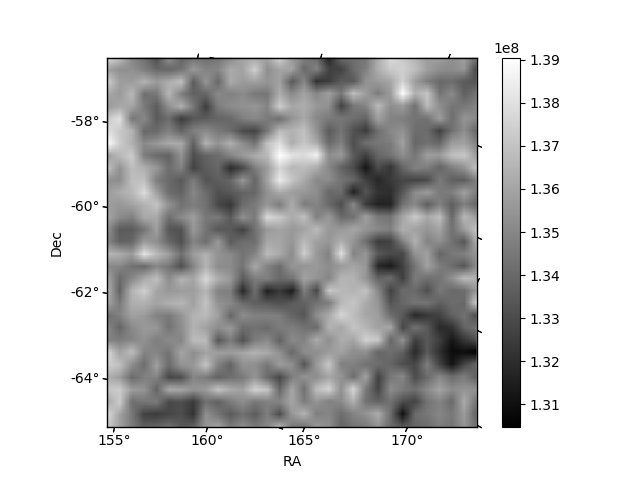
Quadrant B |
|---|---|---|---|
| Quadrant D | 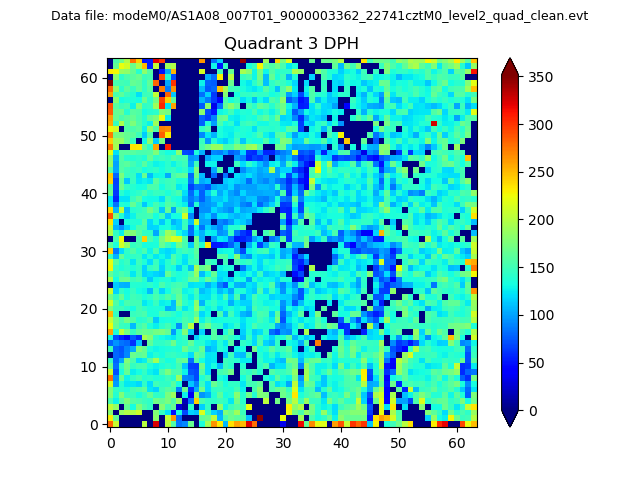 |
 |
Quadrant C |
| Plot type | Count rate plots | Images |
|---|---|---|
| Comparison with Poisson distribution Blue bars denote a histogram of data divided into 1 sec bins. Red curve is a Poisson curve with rate = median count rate of data. |
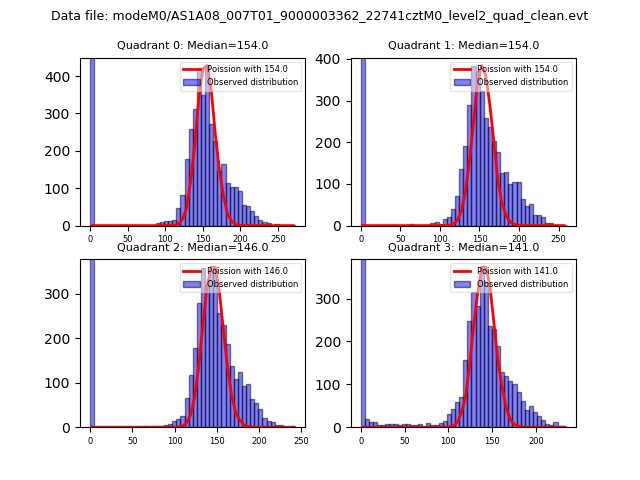 |
 |
| Quadrant-wise count rates Data is divided into 100 sec bins |
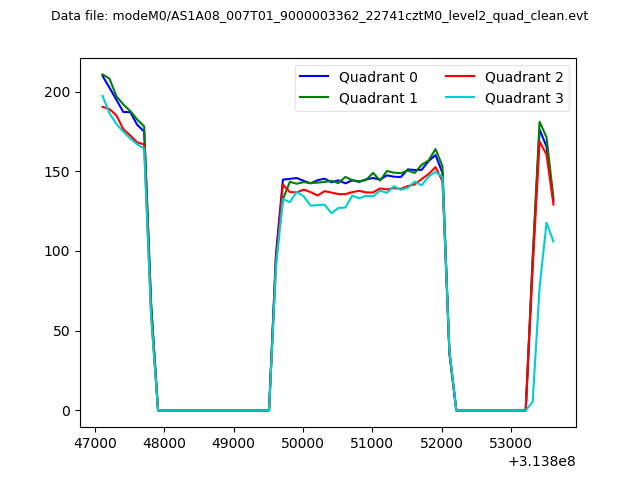 |
|
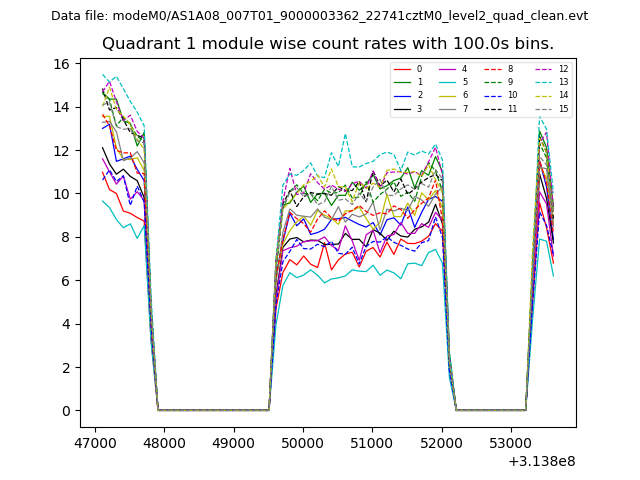
| Module-wise count rates for Quadrant A Data is divided into 100 sec bins |
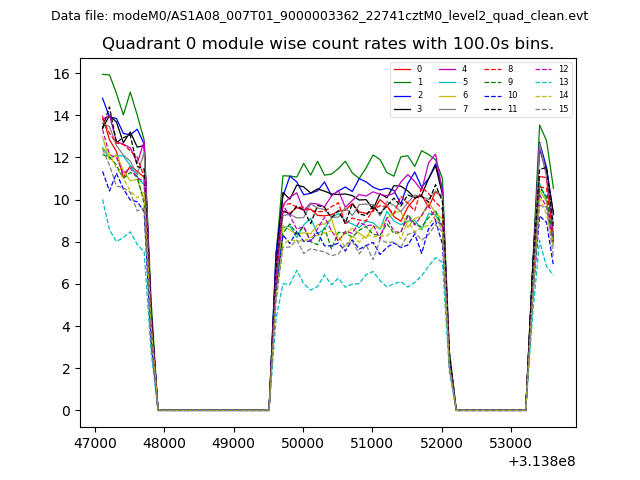 |
 |
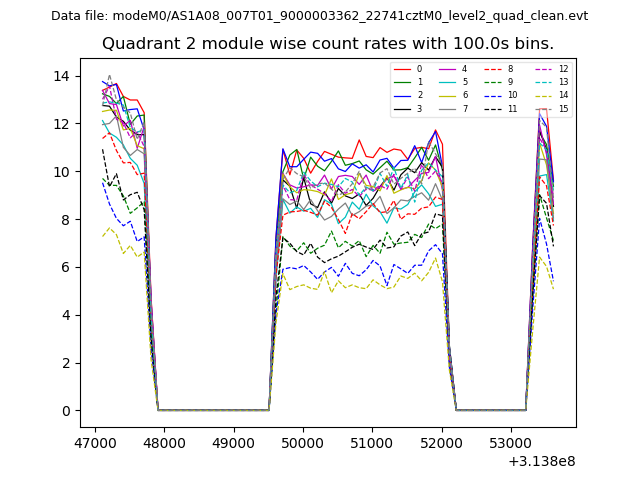
| Module-wise count rates for Quadrant B Data is divided into 100 sec bins |
 |
 |
| Module-wise count rates for Quadrant C Data is divided into 100 sec bins |
 |
 |
| Module-wise count rates for Quadrant D Data is divided into 100 sec bins |
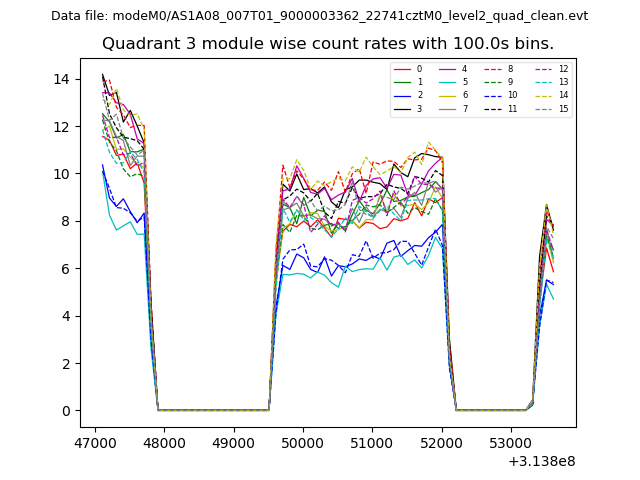 |
 |
| Parameter | Plot |
|---|---|
| CZT HV Monitor | 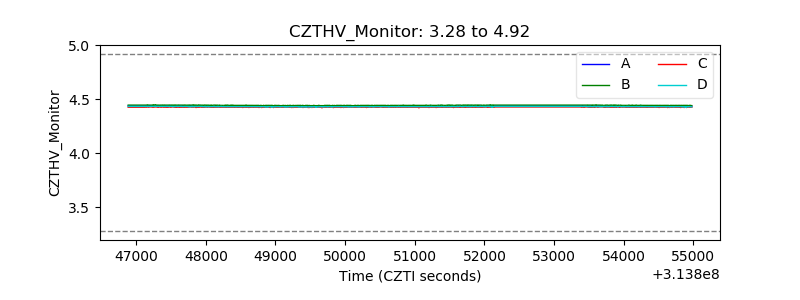 |
| D_VDD | 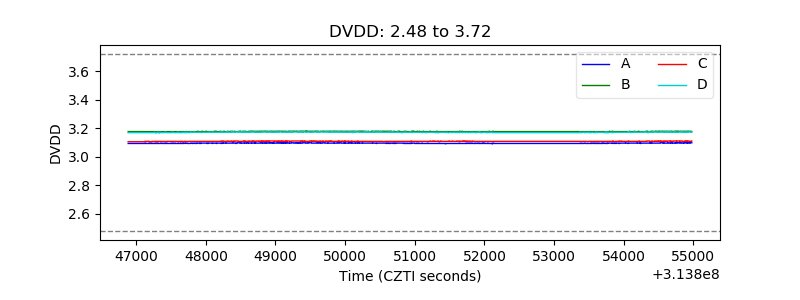 |
| Temperature 1 |  |
| Veto HV Monitor |  |
| Veto LLD | 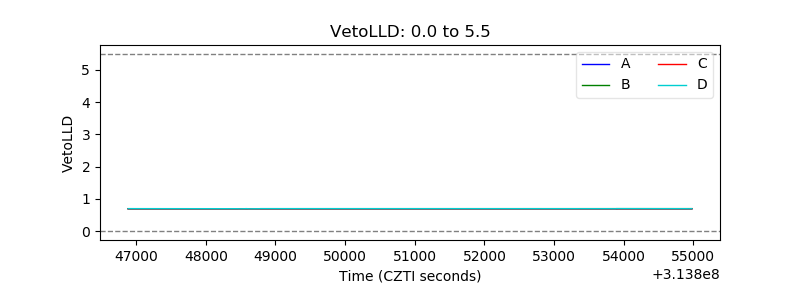 |
| Alpha Counter | 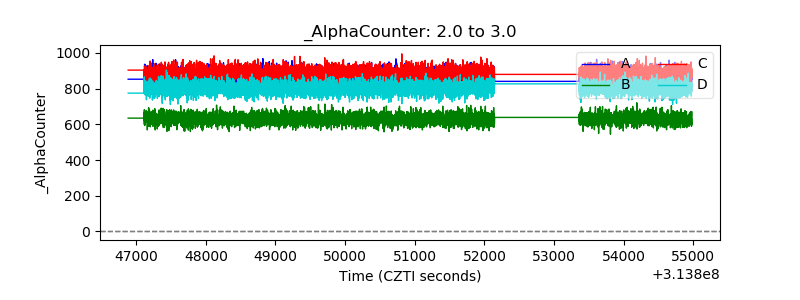 |
| _CPM_Rate | 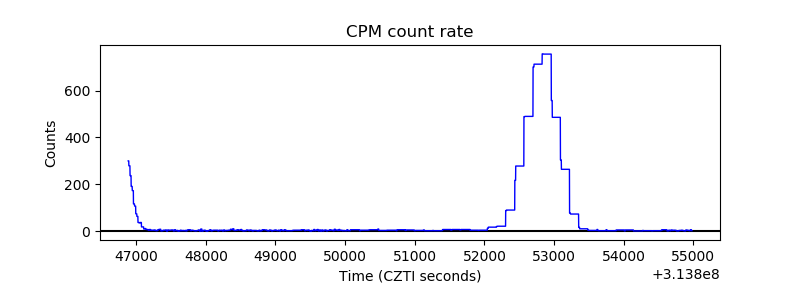 |
| CZT Counter | 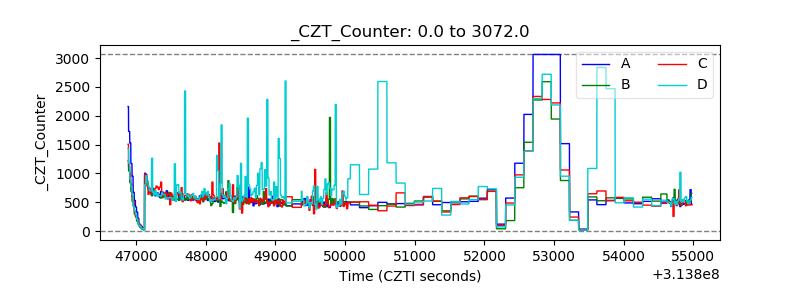 |
| +2.5 Volts monitor |  |
| +5 Volts monitor |  |
| _ROLL_ROT | 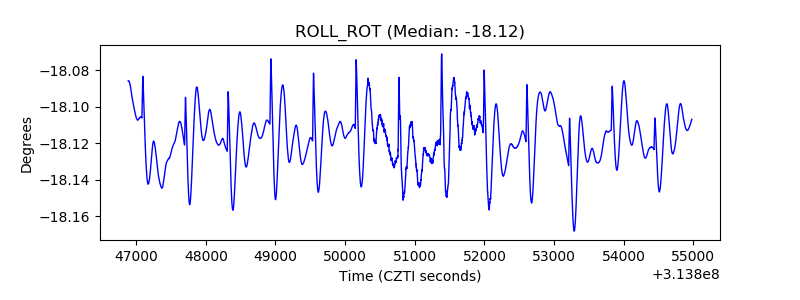 |
| _Roll_DEC | 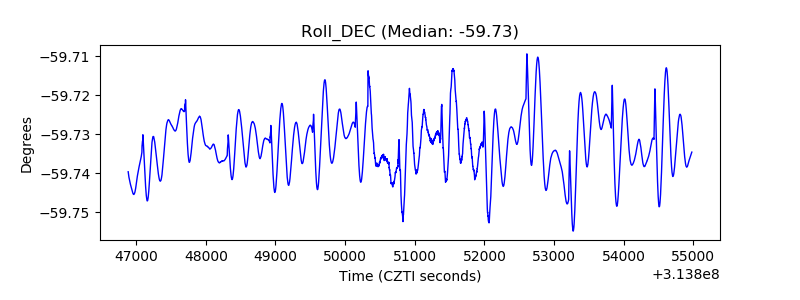 |
| _Roll_RA | 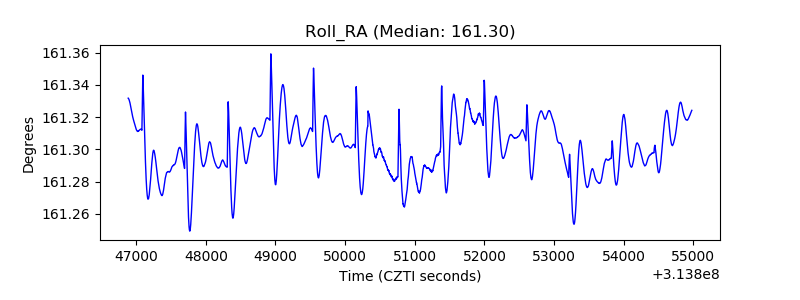 |
| Veto Counter |  |