| Param | Original file | Final file |
|---|---|---|
| Filename | modeM0/AS1A08_007T01_9000003362_22743cztM0_level2.evt | modeM0/AS1A08_007T01_9000003362_22743cztM0_level2_quad_clean.evt |
| Size (bytes) | 553,230,720 | 88,672,320 |
| Size | 527.6 MB | 84.6 MB |
| Events in quadrant A | 3,510,071 | 559,928 |
| Events in quadrant B | 3,657,358 | 562,034 |
| Events in quadrant C | 3,566,714 | 537,527 |
| Events in quadrant D | 5,524,590 | 516,848 |
| Mode SS | |||
|---|---|---|---|
| Quadrant | BADHDUFLAG | Total packets | Discarded packets |
| A | 0 | 148 | 0 |
| B | 0 | 148 | 0 |
| C | 0 | 148 | 0 |
| D | 0 | 148 | 0 |
| Mode M0 | |||
|---|---|---|---|
| Quadrant | BADHDUFLAG | Total packets | Discarded packets |
| A | 0 | 15114 | 2 |
| B | 0 | 15430 | 2 |
| C | 0 | 15241 | 2 |
| D | 0 | 21396 | 3 |
| Mode M9 | |||
|---|---|---|---|
| Quadrant | BADHDUFLAG | Total packets | Discarded packets |
| A | 0 | 6 | 0 |
| B | 0 | 7 | 0 |
| C | 0 | 7 | 0 |
| D | 0 | 7 | 0 |
| Quadrant | Total seconds | Saturated seconds | Saturation percentage |
|---|---|---|---|
| A | 7310 | 106 | 1.450068% |
| B | 7310 | 137 | 1.874145% |
| C | 7310 | 145 | 1.983584% |
| D | 7309 | 393 | 5.376933% |
Noise dominated data is calculated using 1-second bins in cleaned event files. If a bin has >2000 counts, and if more than 50% of those come from <1% of pixels, then it is considered to be noise-dominated and hence unusable.
| Quadrant | # 1 sec bins | Bins with >0 counts | Bins with >2000 counts | High rate bins dominated by noise | Noise dominated (total time) | Noise dominated (detector-on time) | Marked lightcurve |
|---|---|---|---|---|---|---|---|
| A | 7830 | 7311 | 0 | 0 | 0.00% | 0.00% | 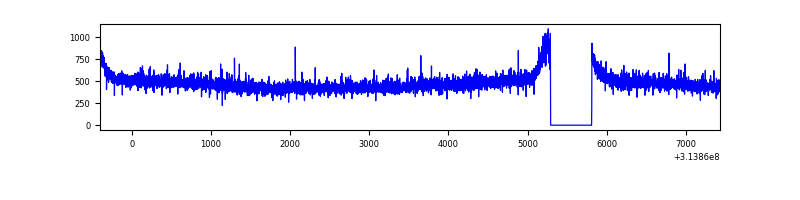 |
| B | 7830 | 7311 | 2 | 2 | 0.03% | 0.03% | 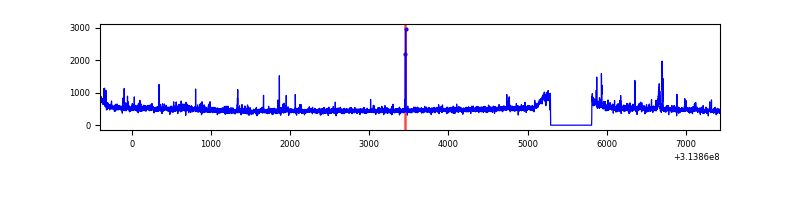 |
| C | 7830 | 7311 | 3 | 3 | 0.04% | 0.04% | 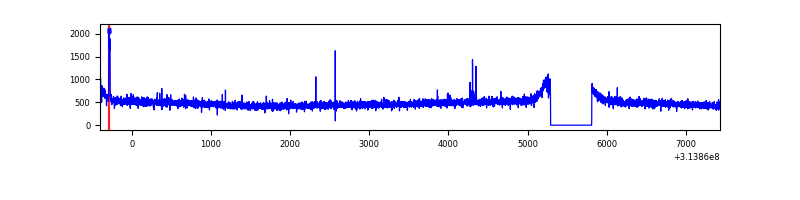 |
| D | 7829 | 7310 | 213 | 213 | 2.72% | 2.91% |  |
Top three noisy pixels from each quadrant. If the there are fewer than three noisy pixels in the level2.evt file, extra rows are filled as -1
| Pixel properties | Quadrant properties | ||||||
|---|---|---|---|---|---|---|---|
| Quadrant | DetID | PixID | Counts | Sigma | Mean | Median | Sigma |
| A | 13 | 254 | 12691 | 64.74 | 909 | 888 | 182.3 |
| A | 0 | 226 | 7885 | 38.38 | 909 | 888 | 182.3 |
| A | 3 | 137 | 7505 | 36.3 | 909 | 888 | 182.3 |
| B | 0 | 197 | 33421 | 190.51 | 902 | 880 | 170.8 |
| B | 0 | 228 | 33365 | 190.18 | 902 | 880 | 170.8 |
| B | 0 | 190 | 25264 | 142.75 | 902 | 880 | 170.8 |
| C | 14 | 238 | 136869 | 672.85 | 869 | 874 | 202.1 |
| C | 10 | 22 | 36138 | 174.47 | 869 | 874 | 202.1 |
| C | 13 | 61 | 6170 | 26.2 | 869 | 874 | 202.1 |
| D | 1 | 52 | 1053036 | 5005.36 | 870 | 845 | 210.2 |
| D | 12 | 227 | 698779 | 3320.13 | 870 | 845 | 210.2 |
| D | 12 | 33 | 305571 | 1449.61 | 870 | 845 | 210.2 |
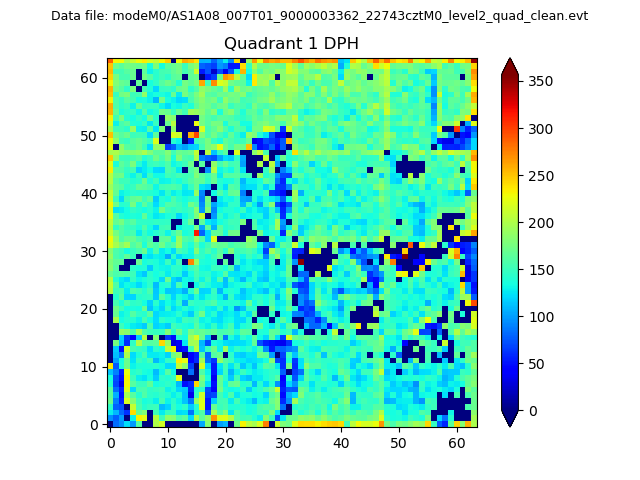
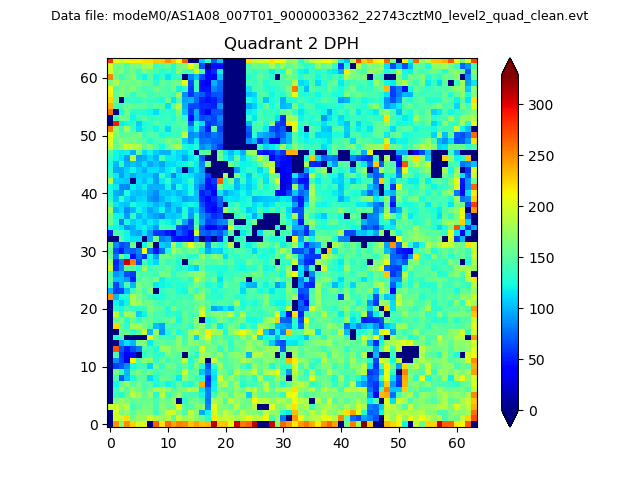
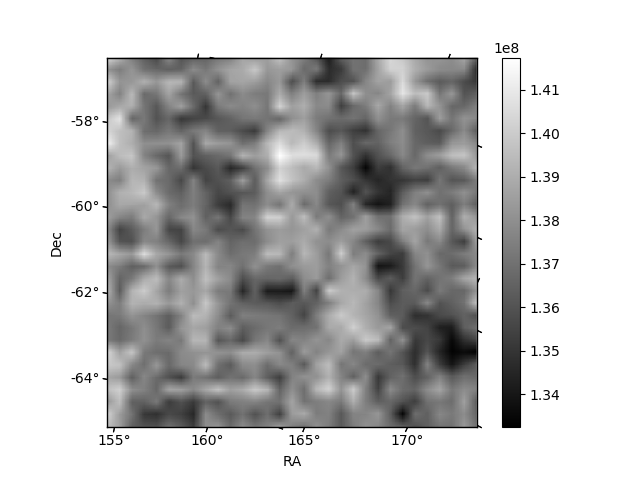
Histogram calculated using DETX and DETY for each event in the final _common_clean file
| Quadrant A | 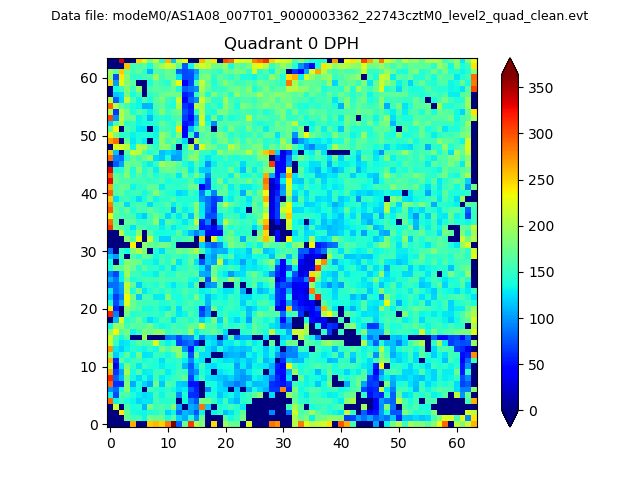 |
 |
Quadrant B |
|---|---|---|---|
| Quadrant D | 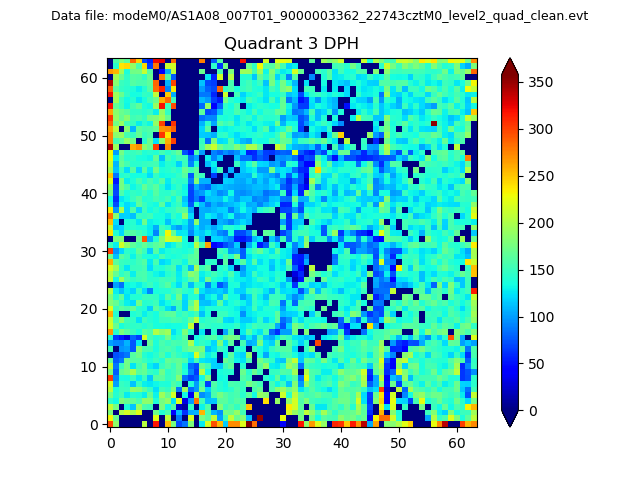 |
 |
Quadrant C |
| Plot type | Count rate plots | Images |
|---|---|---|
| Comparison with Poisson distribution Blue bars denote a histogram of data divided into 1 sec bins. Red curve is a Poisson curve with rate = median count rate of data. |
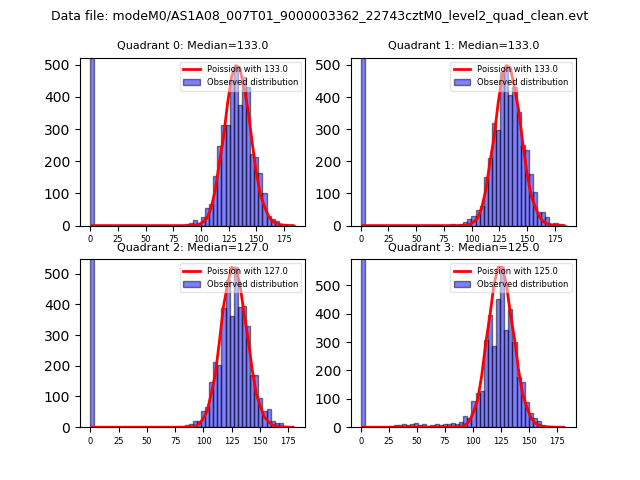 |
 |
| Quadrant-wise count rates Data is divided into 100 sec bins |
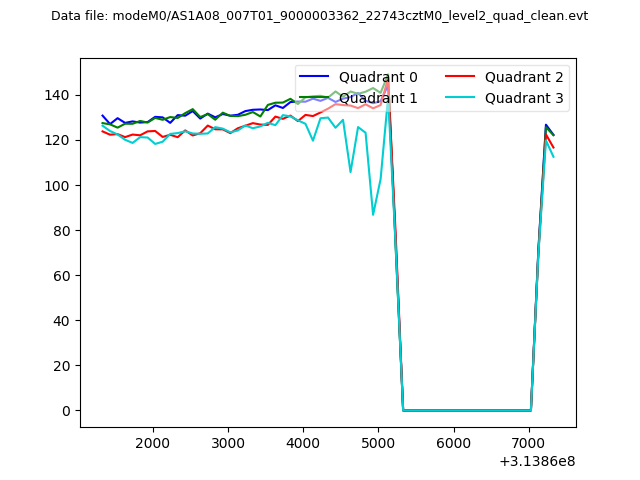 |
|
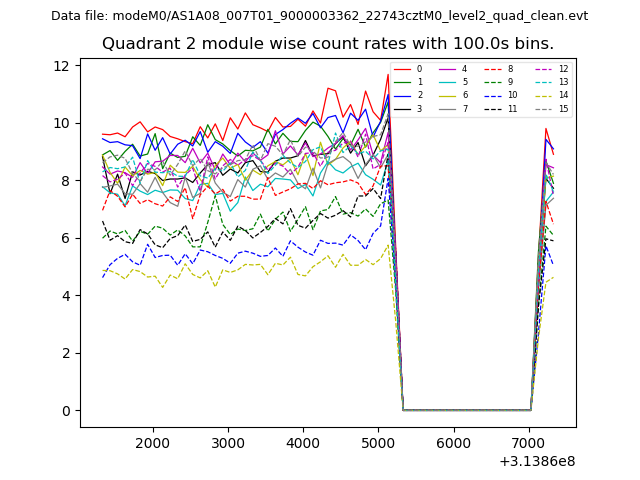
| Module-wise count rates for Quadrant A Data is divided into 100 sec bins |
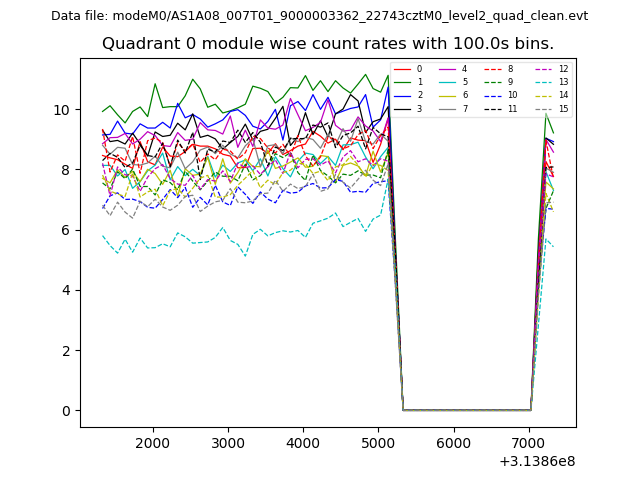 |
 |
| Module-wise count rates for Quadrant B Data is divided into 100 sec bins |
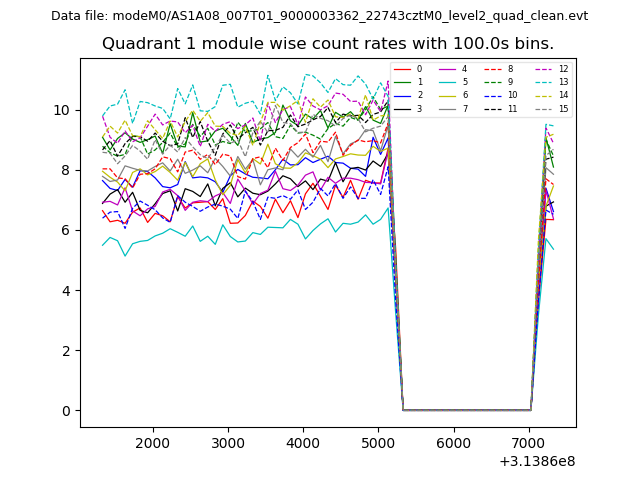 |
 |
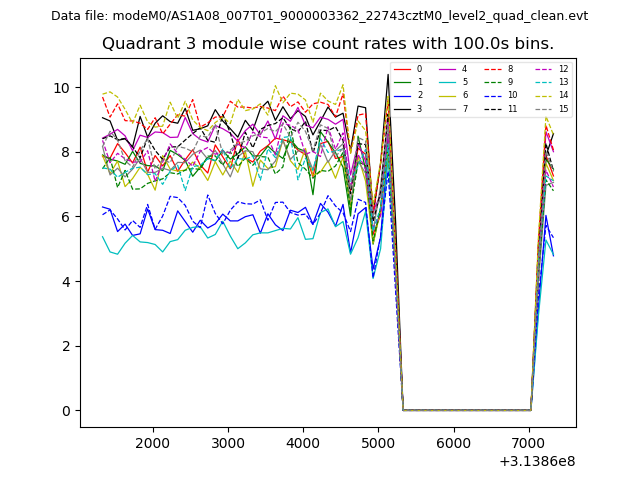
| Module-wise count rates for Quadrant C Data is divided into 100 sec bins |
 |
 |
| Module-wise count rates for Quadrant D Data is divided into 100 sec bins |
 |
 |
| Parameter | Plot |
|---|---|
| CZT HV Monitor | 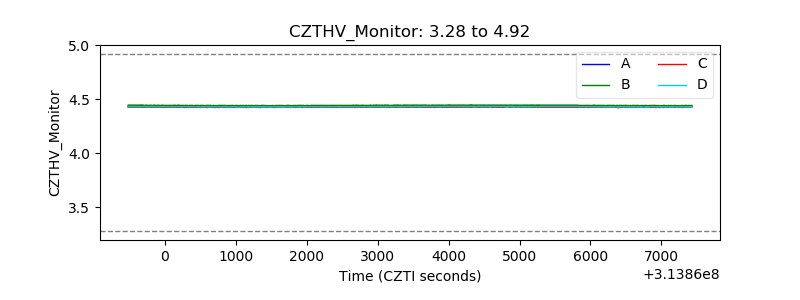 |
| D_VDD | 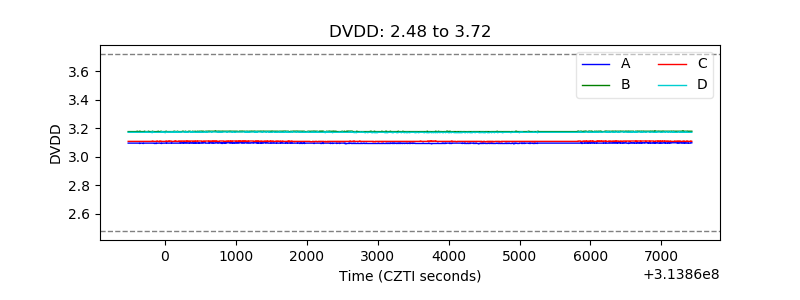 |
| Temperature 1 | 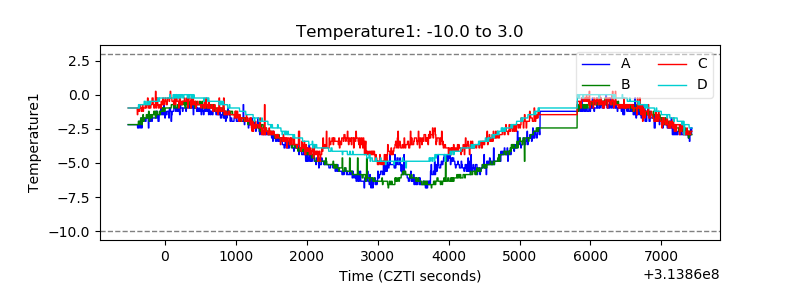 |
| Veto HV Monitor | 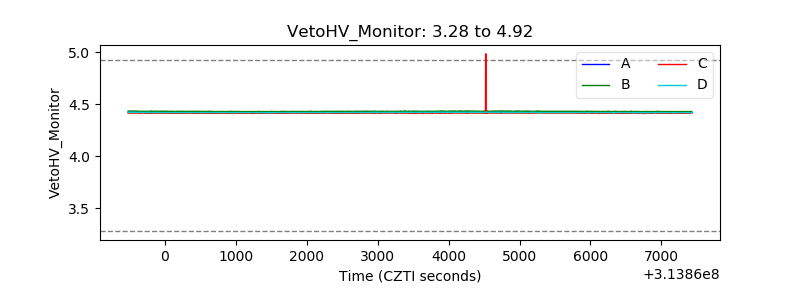 |
| Veto LLD | 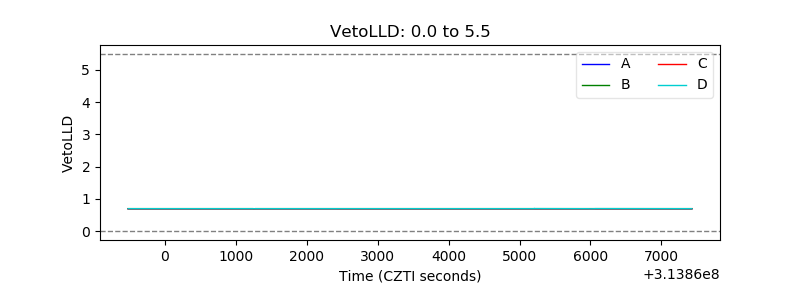 |
| Alpha Counter | 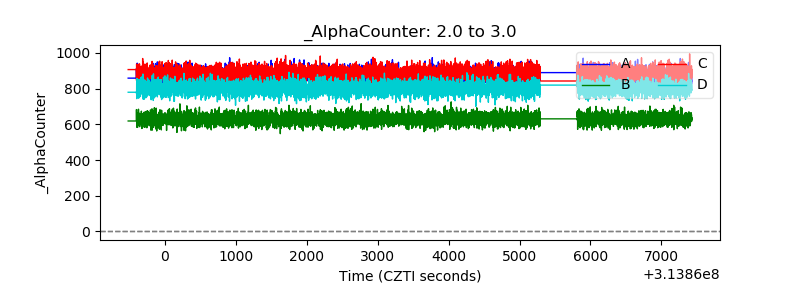 |
| _CPM_Rate | 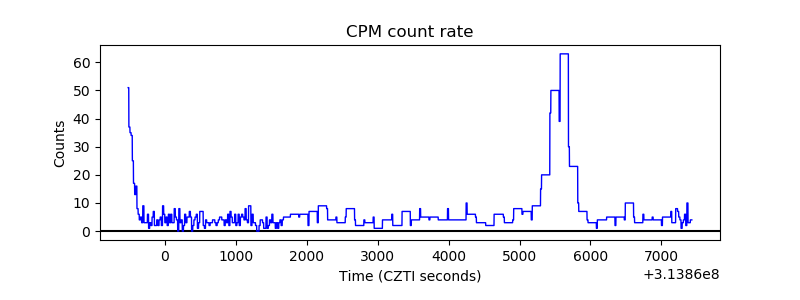 |
| CZT Counter | 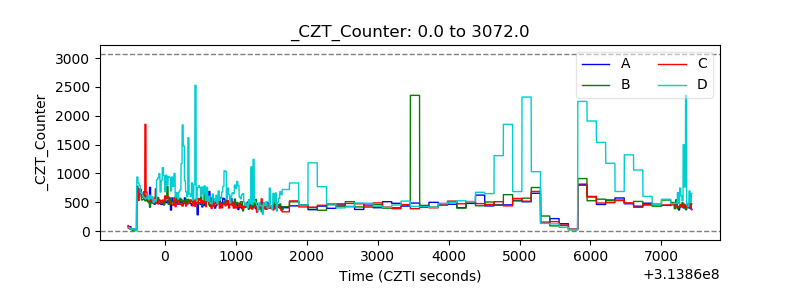 |
| +2.5 Volts monitor |  |
| +5 Volts monitor |  |
| _ROLL_ROT | 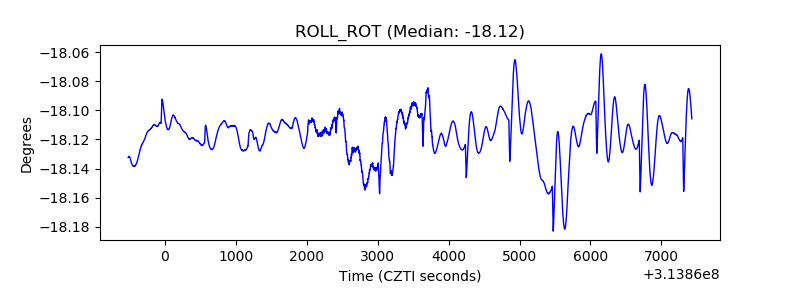 |
| _Roll_DEC | 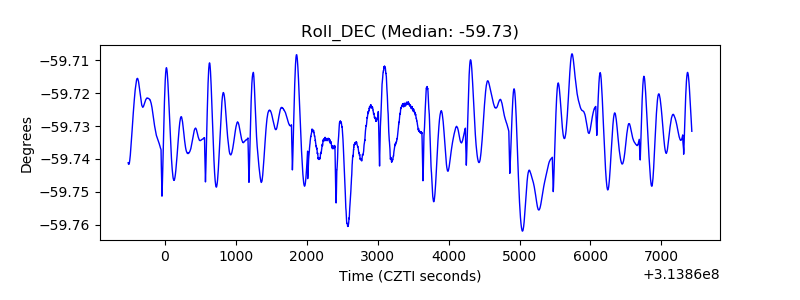 |
| _Roll_RA | 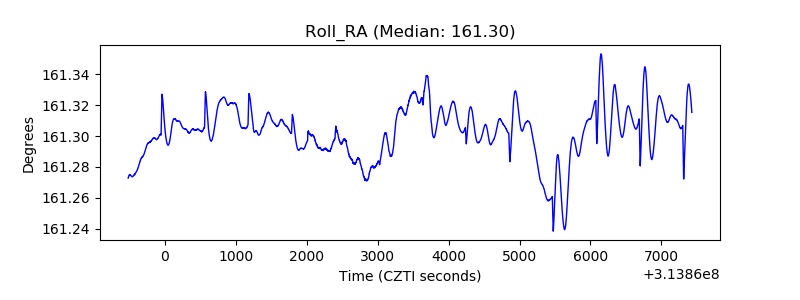 |
| Veto Counter | 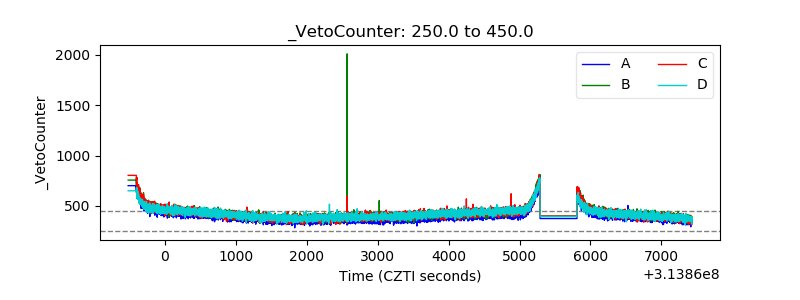 |