| Param | Original file | Final file |
|---|---|---|
| Filename | modeM0/AS1A08_007T01_9000003362_22745cztM0_level2.evt | modeM0/AS1A08_007T01_9000003362_22745cztM0_level2_quad_clean.evt |
| Size (bytes) | 455,328,000 | 93,346,560 |
| Size | 434.2 MB | 89.0 MB |
| Events in quadrant A | 3,131,394 | 601,406 |
| Events in quadrant B | 3,253,076 | 603,526 |
| Events in quadrant C | 3,158,308 | 578,212 |
| Events in quadrant D | 3,786,972 | 572,231 |
| Mode SS | |||
|---|---|---|---|
| Quadrant | BADHDUFLAG | Total packets | Discarded packets |
| A | 0 | 143 | 1 |
| B | 0 | 142 | 2 |
| C | 0 | 144 | 4 |
| D | 0 | 144 | 4 |
| Mode M0 | |||
|---|---|---|---|
| Quadrant | BADHDUFLAG | Total packets | Discarded packets |
| A | 0 | 14540 | 737 |
| B | 0 | 14790 | 776 |
| C | 0 | 14560 | 741 |
| D | 0 | 16828 | 961 |
| Mode M9 | |||
|---|---|---|---|
| Quadrant | BADHDUFLAG | Total packets | Discarded packets |
| A | 0 | 3 | 1 |
| B | 0 | 3 | 0 |
| C | 0 | 3 | 0 |
| D | 0 | 3 | 1 |
| Quadrant | Total seconds | Saturated seconds | Saturation percentage |
|---|---|---|---|
| A | 6756 | 22 | 0.325636% |
| B | 6756 | 38 | 0.562463% |
| C | 6750 | 63 | 0.933333% |
| D | 6754 | 122 | 1.806337% |
Noise dominated data is calculated using 1-second bins in cleaned event files. If a bin has >2000 counts, and if more than 50% of those come from <1% of pixels, then it is considered to be noise-dominated and hence unusable.
| Quadrant | # 1 sec bins | Bins with >0 counts | Bins with >2000 counts | High rate bins dominated by noise | Noise dominated (total time) | Noise dominated (detector-on time) | Marked lightcurve |
|---|---|---|---|---|---|---|---|
| A | 7494 | 6818 | 0 | 0 | 0.00% | 0.00% | 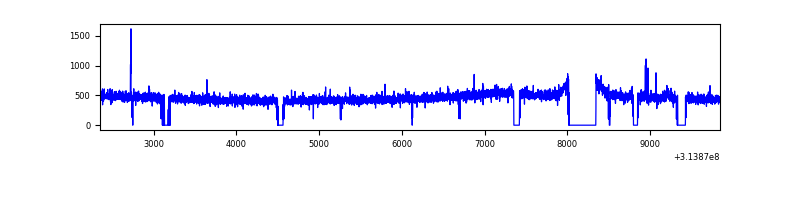 |
| B | 7494 | 6825 | 3 | 3 | 0.04% | 0.04% | 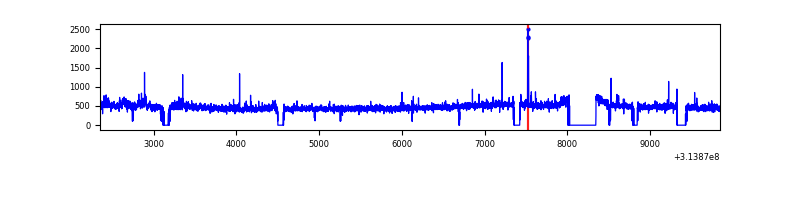 |
| C | 7494 | 6805 | 4 | 4 | 0.05% | 0.06% | 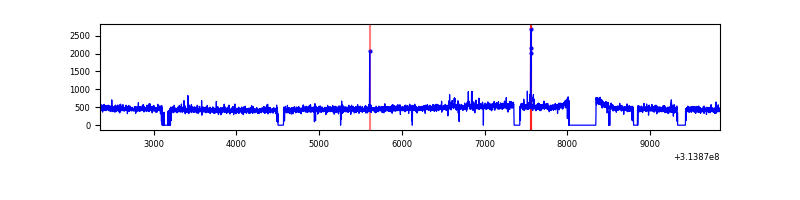 |
| D | 7495 | 6813 | 81 | 81 | 1.08% | 1.19% | 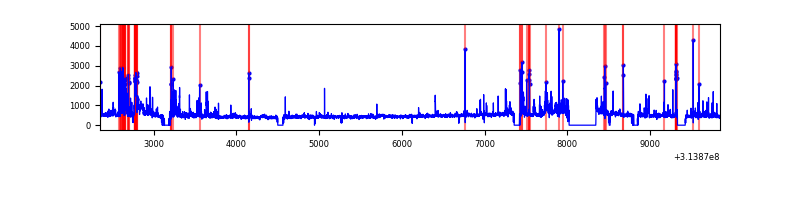 |
Top three noisy pixels from each quadrant. If the there are fewer than three noisy pixels in the level2.evt file, extra rows are filled as -1
| Pixel properties | Quadrant properties | ||||||
|---|---|---|---|---|---|---|---|
| Quadrant | DetID | PixID | Counts | Sigma | Mean | Median | Sigma |
| A | 0 | 243 | 13349 | 77.17 | 806 | 788 | 162.8 |
| A | 13 | 254 | 12985 | 74.94 | 806 | 788 | 162.8 |
| A | 0 | 226 | 7135 | 38.99 | 806 | 788 | 162.8 |
| B | 0 | 228 | 38167 | 243.4 | 803 | 782 | 153.6 |
| B | 0 | 190 | 32649 | 207.47 | 803 | 782 | 153.6 |
| B | 0 | 230 | 27198 | 171.98 | 803 | 782 | 153.6 |
| C | 14 | 238 | 119593 | 658.65 | 768 | 772 | 180.4 |
| C | 2 | 16 | 29381 | 158.59 | 768 | 772 | 180.4 |
| C | 10 | 22 | 13405 | 70.03 | 768 | 772 | 180.4 |
| D | 12 | 233 | 280091 | 1484.0 | 777 | 752 | 188.2 |
| D | 1 | 52 | 251513 | 1332.18 | 777 | 752 | 188.2 |
| D | 12 | 227 | 94030 | 495.54 | 777 | 752 | 188.2 |
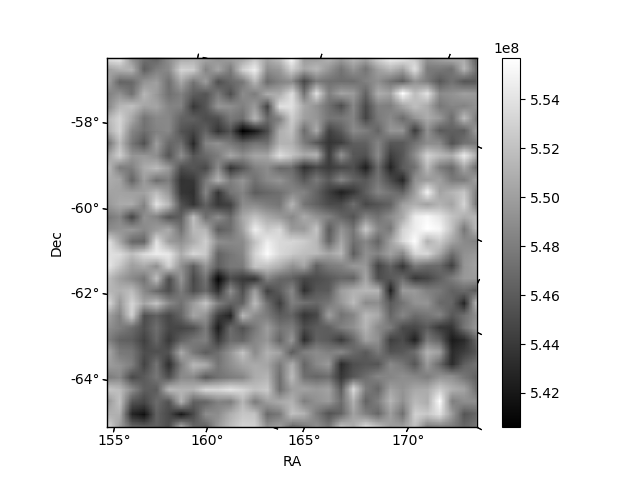
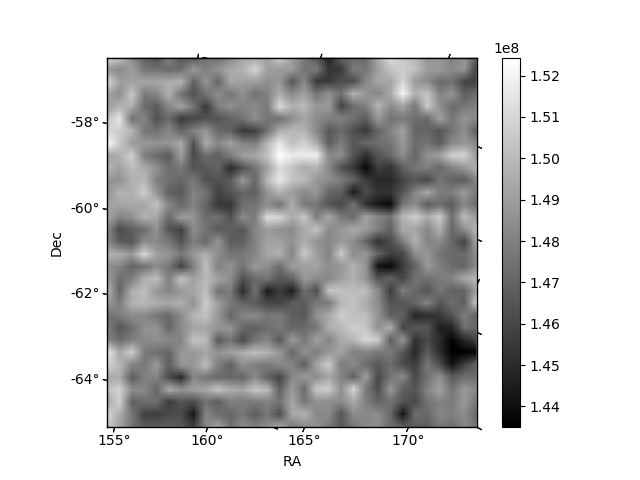
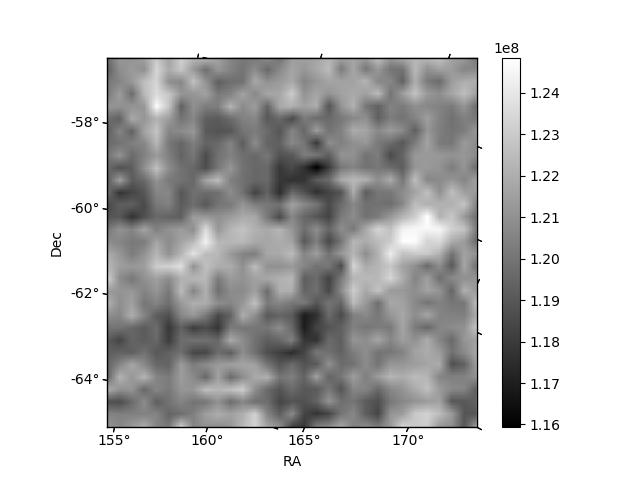
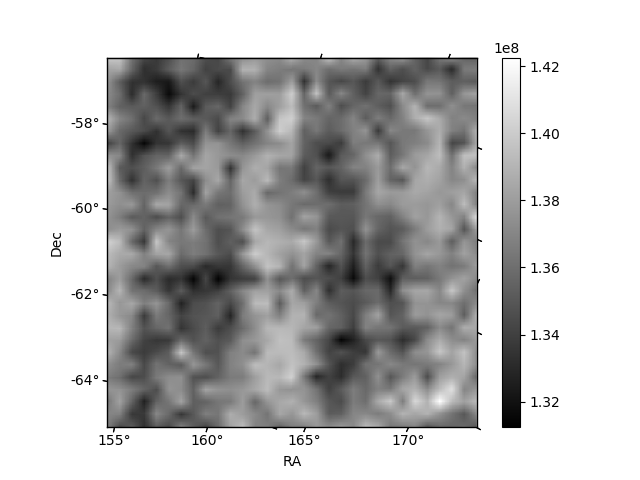
Histogram calculated using DETX and DETY for each event in the final _common_clean file
| Quadrant A | 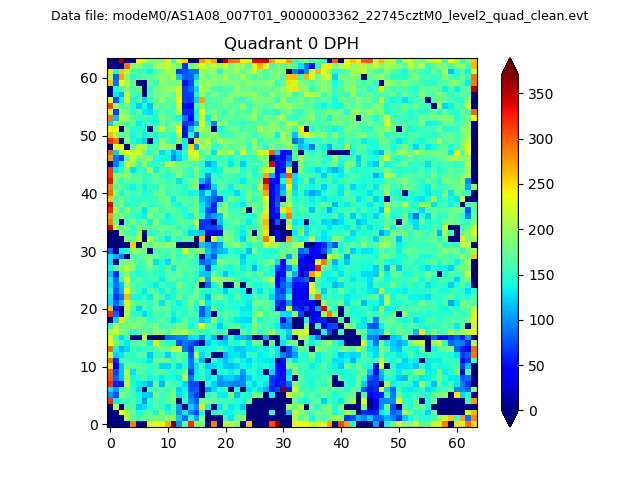 |
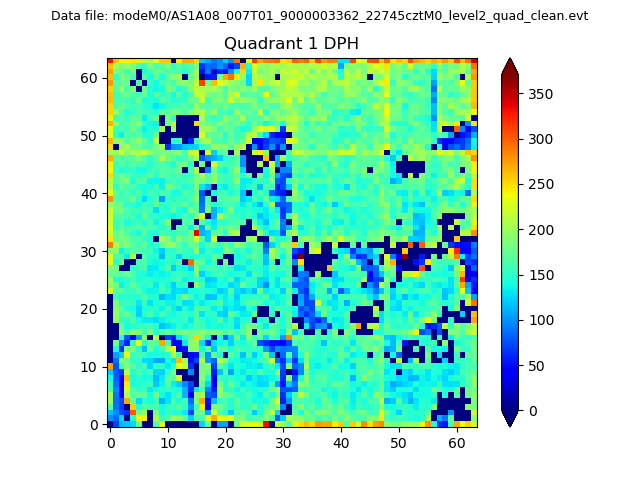 |
Quadrant B |
|---|---|---|---|
| Quadrant D |  |
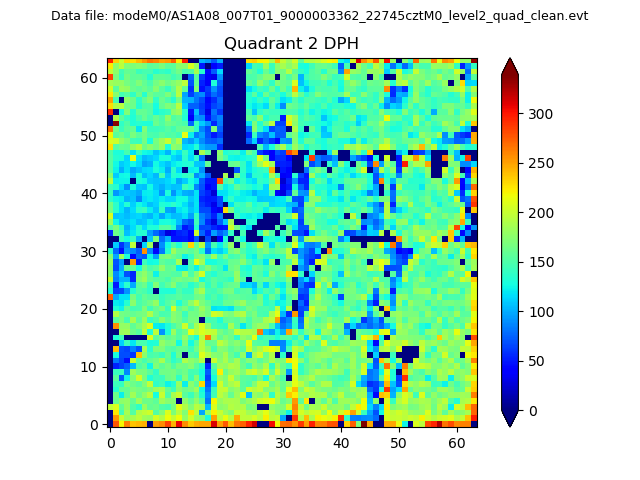 |
Quadrant C |
| Plot type | Count rate plots | Images |
|---|---|---|
| Comparison with Poisson distribution Blue bars denote a histogram of data divided into 1 sec bins. Red curve is a Poisson curve with rate = median count rate of data. |
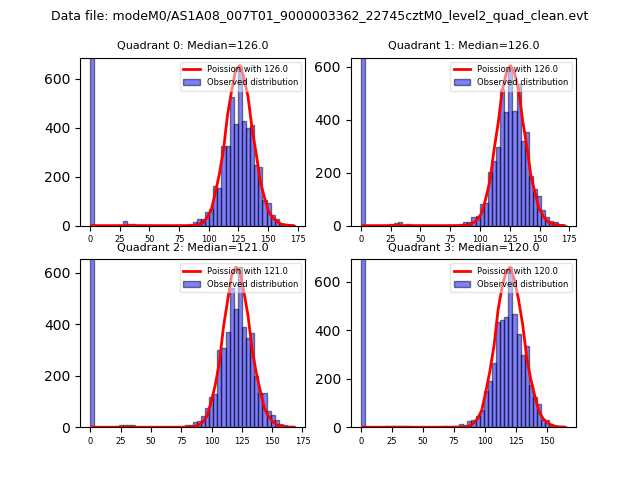 |
 |
| Quadrant-wise count rates Data is divided into 100 sec bins |
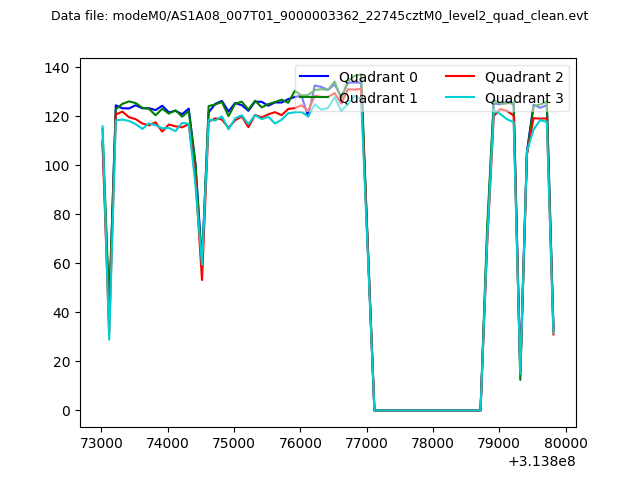 |
|
| Module-wise count rates for Quadrant A Data is divided into 100 sec bins |
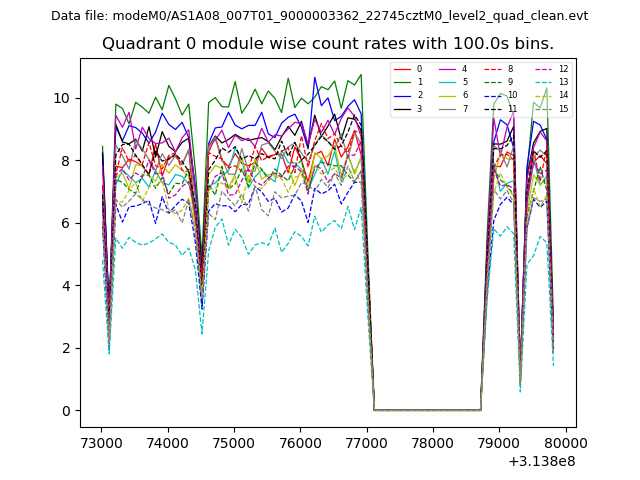 |
 |
| Module-wise count rates for Quadrant B Data is divided into 100 sec bins |
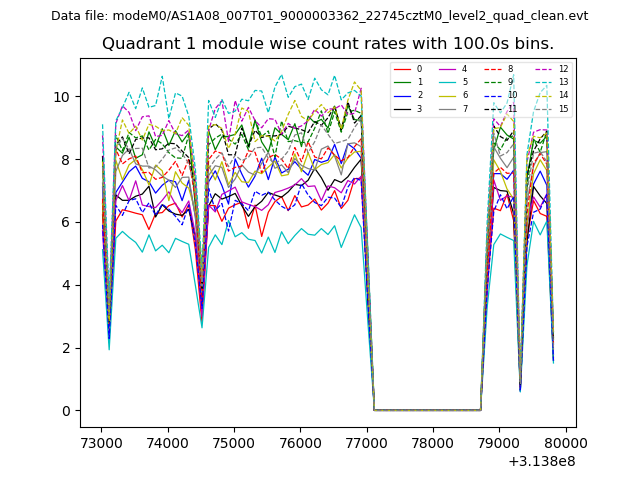 |
 |
| Module-wise count rates for Quadrant C Data is divided into 100 sec bins |
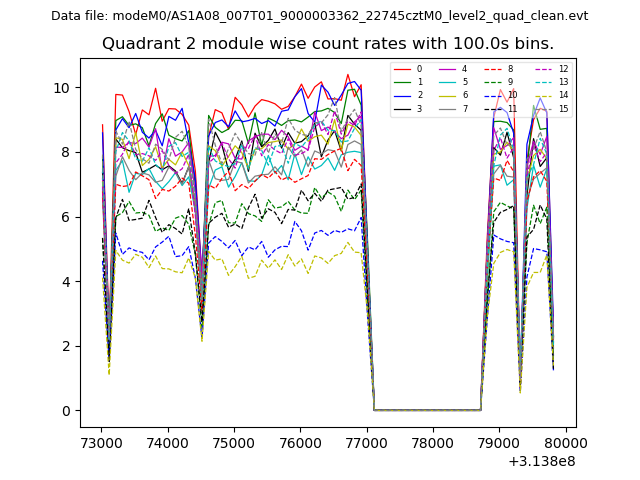 |
 |
| Module-wise count rates for Quadrant D Data is divided into 100 sec bins |
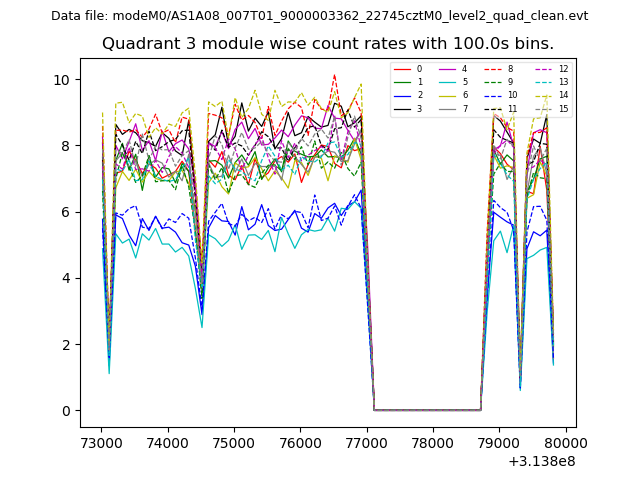 |
 |
| Parameter | Plot |
|---|---|
| CZT HV Monitor | 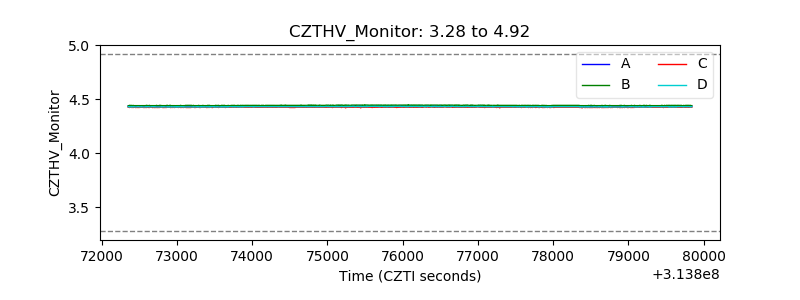 |
| D_VDD | 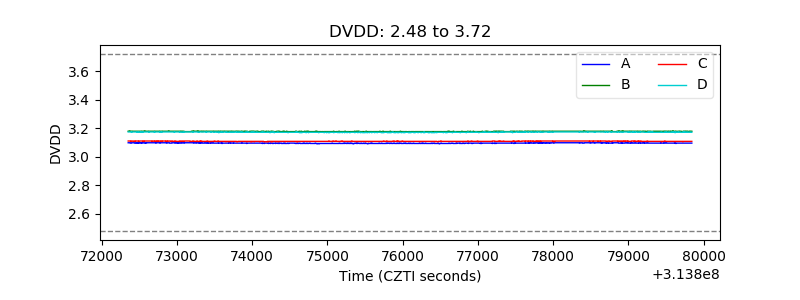 |
| Temperature 1 | 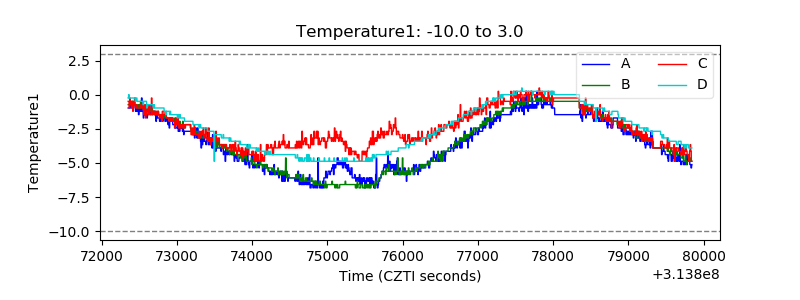 |
| Veto HV Monitor |  |
| Veto LLD | 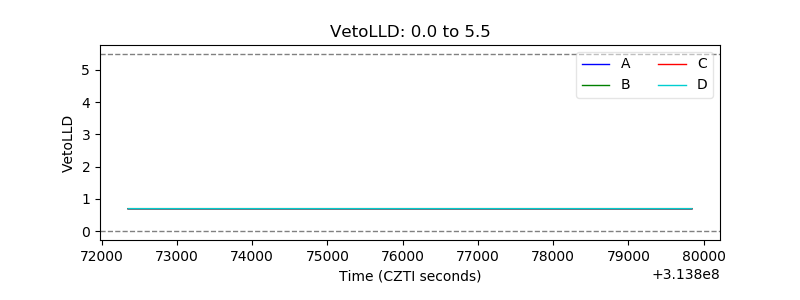 |
| Alpha Counter | 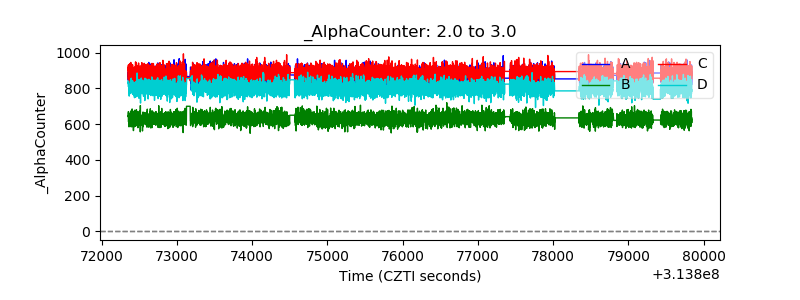 |
| _CPM_Rate | 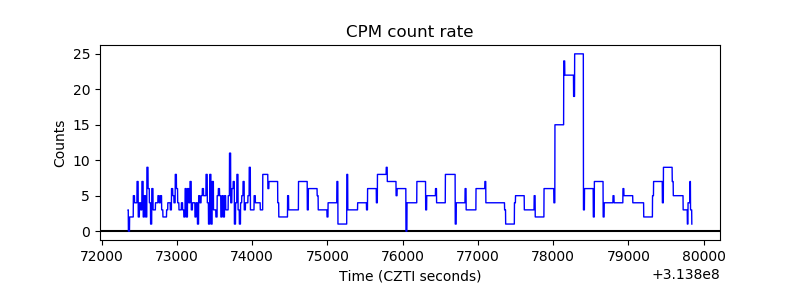 |
| CZT Counter | 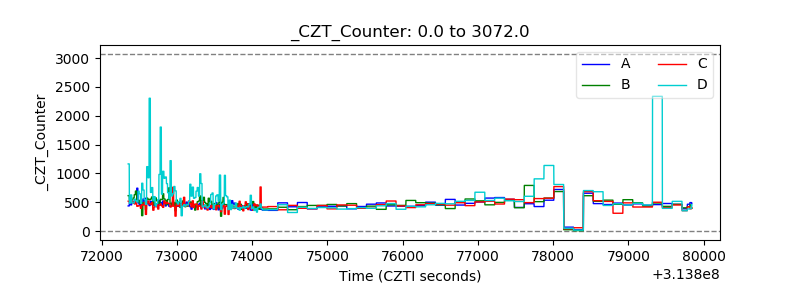 |
| +2.5 Volts monitor |  |
| +5 Volts monitor |  |
| _ROLL_ROT | 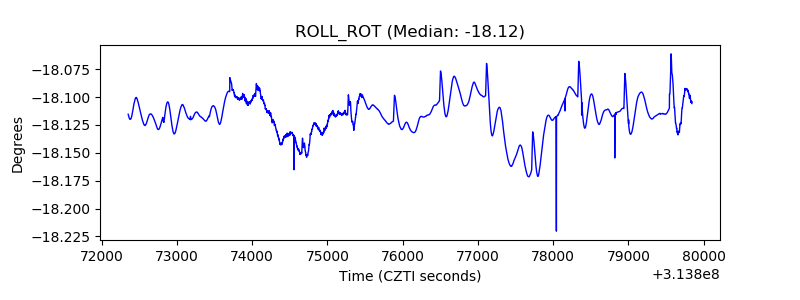 |
| _Roll_DEC | 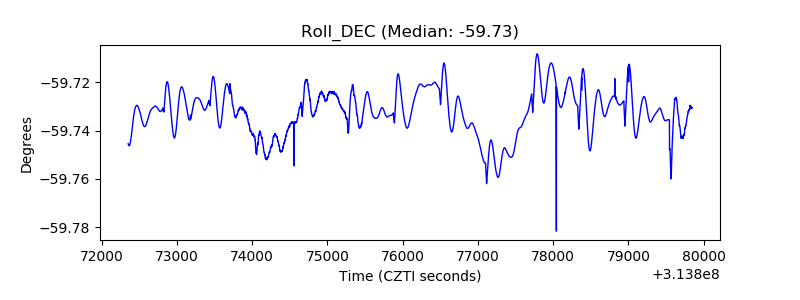 |
| _Roll_RA |  |
| Veto Counter | 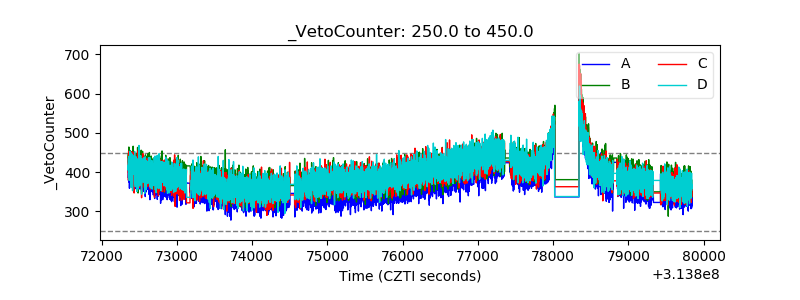 |