| Param | Original file | Final file |
|---|---|---|
| Filename | modeM0/AS1A08_007T01_9000003362_22749cztM0_level2.evt | modeM0/AS1A08_007T01_9000003362_22749cztM0_level2_quad_clean.evt |
| Size (bytes) | 1,310,880,960 | 277,332,480 |
| Size | 1.2 GB | 264.5 MB |
| Events in quadrant A | 8,945,136 | 1,793,352 |
| Events in quadrant B | 9,274,360 | 1,815,493 |
| Events in quadrant C | 9,187,817 | 1,739,619 |
| Events in quadrant D | 10,971,031 | 1,705,502 |
| Mode SS | |||
|---|---|---|---|
| Quadrant | BADHDUFLAG | Total packets | Discarded packets |
| A | 0 | 396 | 0 |
| B | 0 | 396 | 0 |
| C | 0 | 396 | 0 |
| D | 0 | 396 | 0 |
| Mode M0 | |||
|---|---|---|---|
| Quadrant | BADHDUFLAG | Total packets | Discarded packets |
| A | 0 | 39681 | 3 |
| B | 0 | 40286 | 3 |
| C | 0 | 39979 | 3 |
| D | 0 | 45936 | 3 |
| Mode M9 | |||
|---|---|---|---|
| Quadrant | BADHDUFLAG | Total packets | Discarded packets |
| A | 0 | 20 | 0 |
| B | 0 | 20 | 0 |
| C | 0 | 20 | 0 |
| D | 0 | 20 | 0 |
| Quadrant | Total seconds | Saturated seconds | Saturation percentage |
|---|---|---|---|
| A | 19548 | 88 | 0.450174% |
| B | 19549 | 115 | 0.588265% |
| C | 19549 | 174 | 0.890071% |
| D | 19549 | 352 | 1.800604% |
Noise dominated data is calculated using 1-second bins in cleaned event files. If a bin has >2000 counts, and if more than 50% of those come from <1% of pixels, then it is considered to be noise-dominated and hence unusable.
| Quadrant | # 1 sec bins | Bins with >0 counts | Bins with >2000 counts | High rate bins dominated by noise | Noise dominated (total time) | Noise dominated (detector-on time) | Marked lightcurve |
|---|---|---|---|---|---|---|---|
| A | 21453 | 19551 | 0 | 0 | 0.00% | 0.00% | 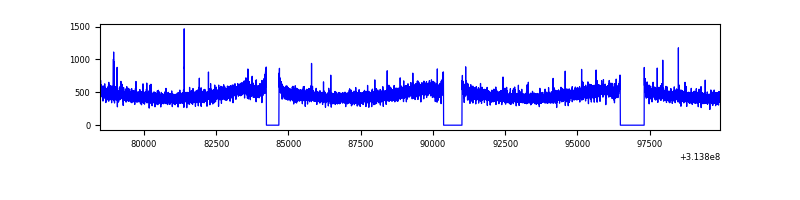 |
| B | 21454 | 19552 | 5 | 5 | 0.02% | 0.03% | 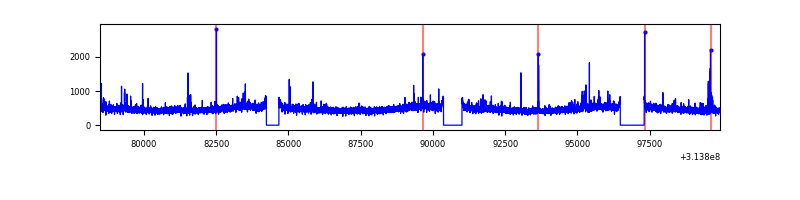 |
| C | 21454 | 19552 | 1 | 1 | 0.00% | 0.01% | 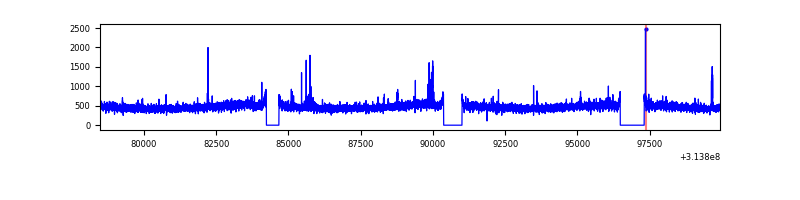 |
| D | 21454 | 19552 | 259 | 259 | 1.21% | 1.32% | 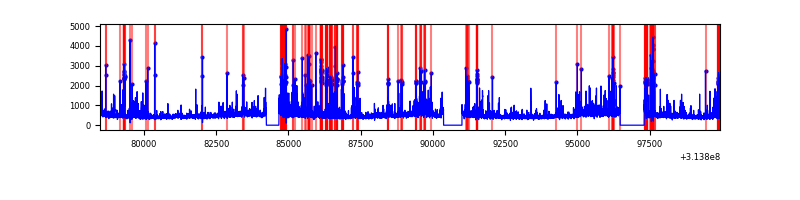 |
Top three noisy pixels from each quadrant. If the there are fewer than three noisy pixels in the level2.evt file, extra rows are filled as -1
| Pixel properties | Quadrant properties | ||||||
|---|---|---|---|---|---|---|---|
| Quadrant | DetID | PixID | Counts | Sigma | Mean | Median | Sigma |
| A | 13 | 254 | 32859 | 66.5 | 2311 | 2262 | 460.1 |
| A | 0 | 226 | 19948 | 38.44 | 2311 | 2262 | 460.1 |
| A | 3 | 137 | 19378 | 37.2 | 2311 | 2262 | 460.1 |
| B | 0 | 190 | 65229 | 143.68 | 2315 | 2254 | 438.3 |
| B | 0 | 230 | 51879 | 113.22 | 2315 | 2254 | 438.3 |
| B | 12 | 111 | 51860 | 113.18 | 2315 | 2254 | 438.3 |
| C | 14 | 238 | 349990 | 668.92 | 2230 | 2246 | 519.9 |
| C | 10 | 22 | 72177 | 134.52 | 2230 | 2246 | 519.9 |
| C | 2 | 16 | 61472 | 113.93 | 2230 | 2246 | 519.9 |
| D | 1 | 52 | 1429078 | 2617.8 | 2252 | 2187 | 545.1 |
| D | 12 | 233 | 308391 | 561.77 | 2252 | 2187 | 545.1 |
| D | 2 | 152 | 236887 | 430.58 | 2252 | 2187 | 545.1 |
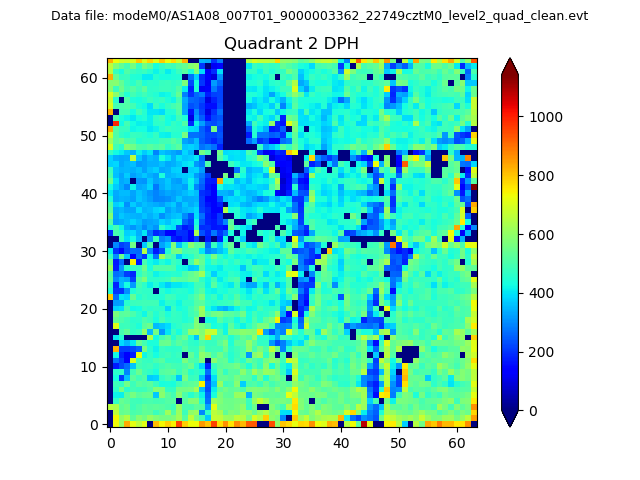
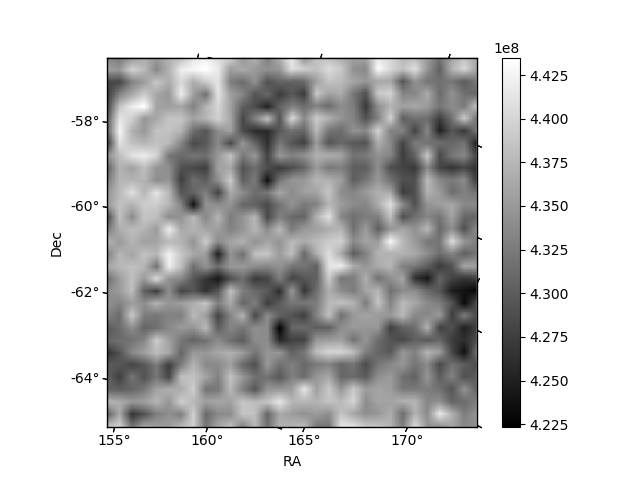
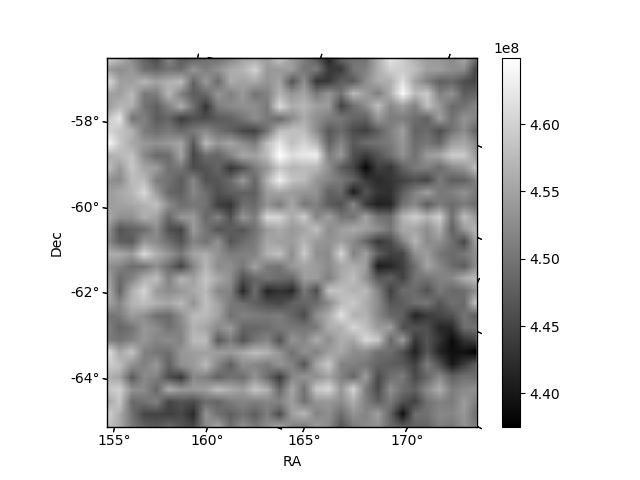
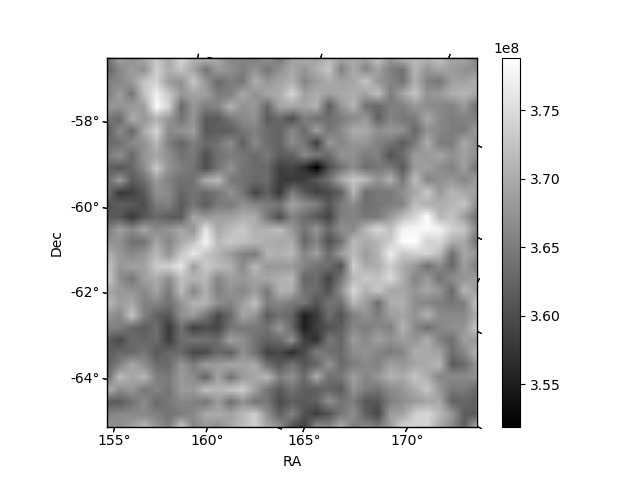
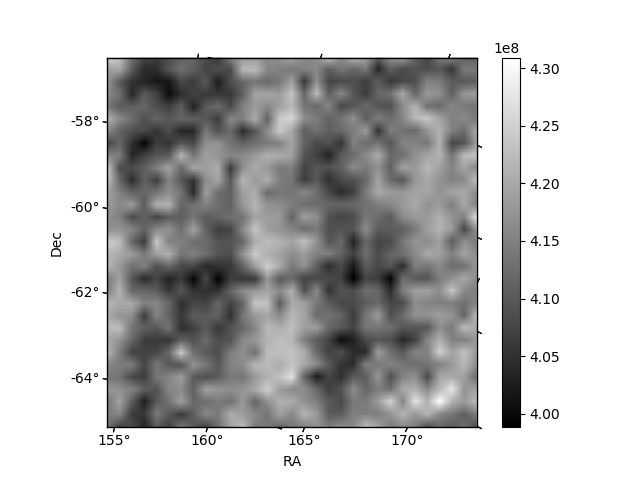
Histogram calculated using DETX and DETY for each event in the final _common_clean file
| Quadrant A | 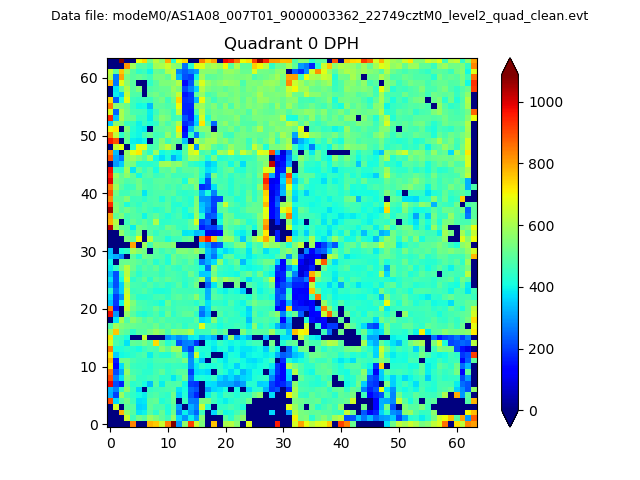 |
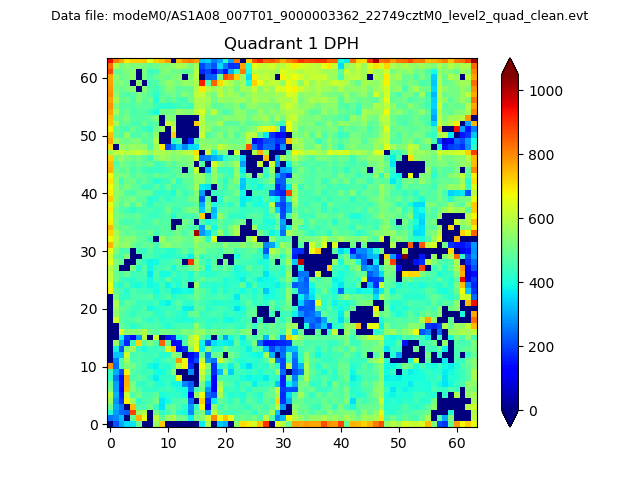 |
Quadrant B |
|---|---|---|---|
| Quadrant D | 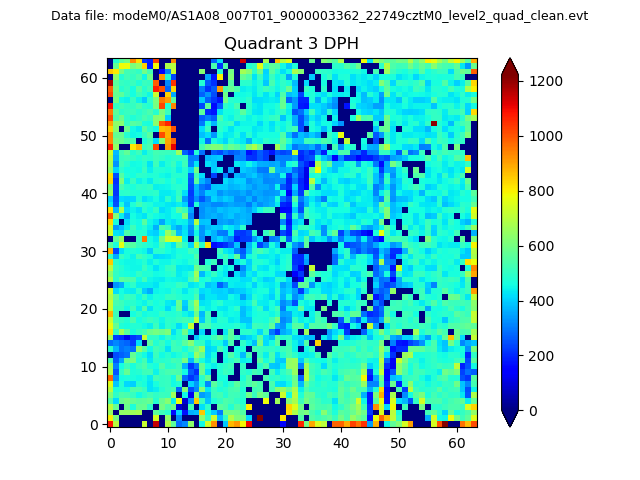 |
 |
Quadrant C |
| Plot type | Count rate plots | Images |
|---|---|---|
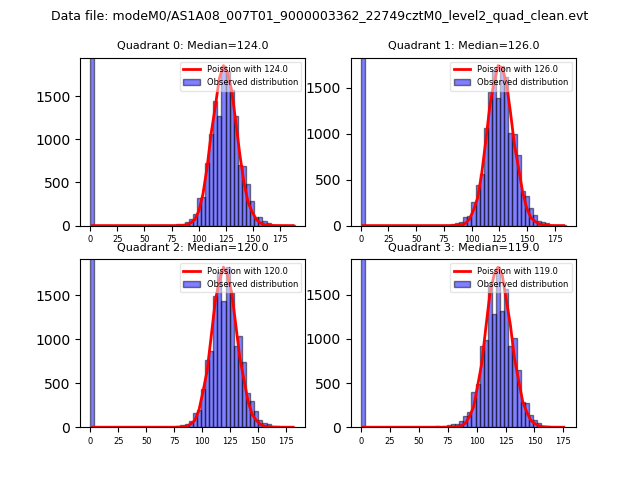
| Comparison with Poisson distribution Blue bars denote a histogram of data divided into 1 sec bins. Red curve is a Poisson curve with rate = median count rate of data. |
 |
 |
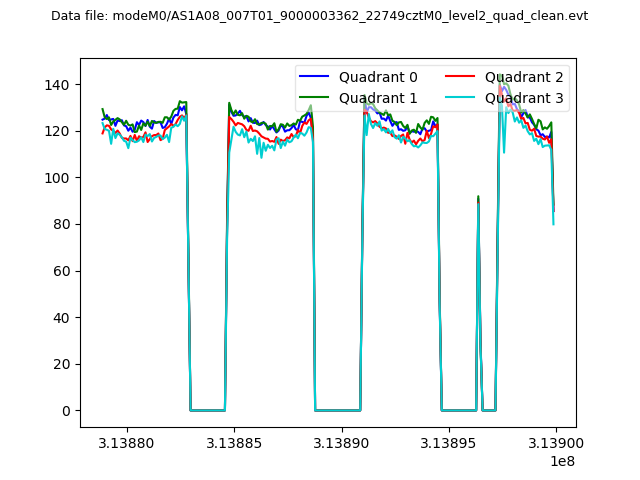
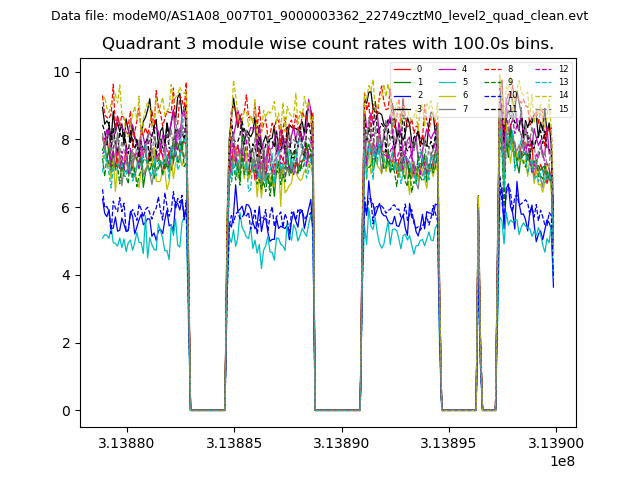
| Quadrant-wise count rates Data is divided into 100 sec bins |
 |
|
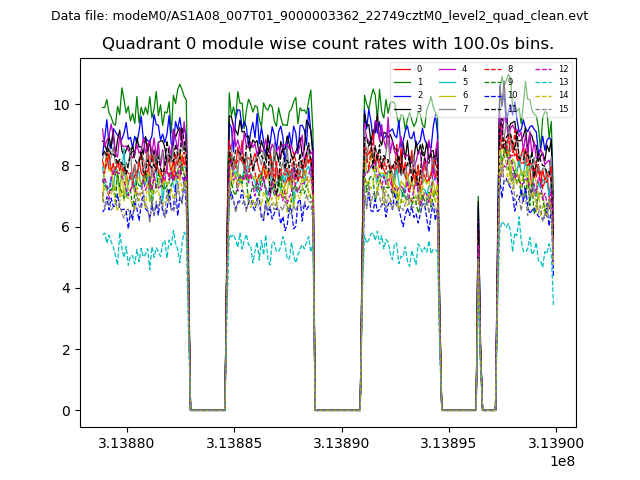
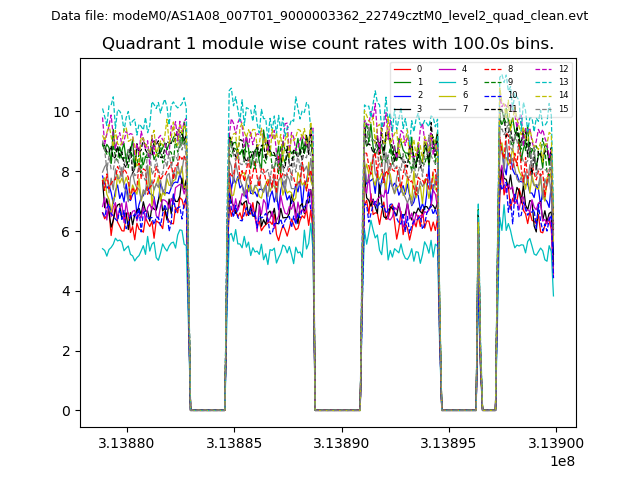
| Module-wise count rates for Quadrant A Data is divided into 100 sec bins |
 |
 |
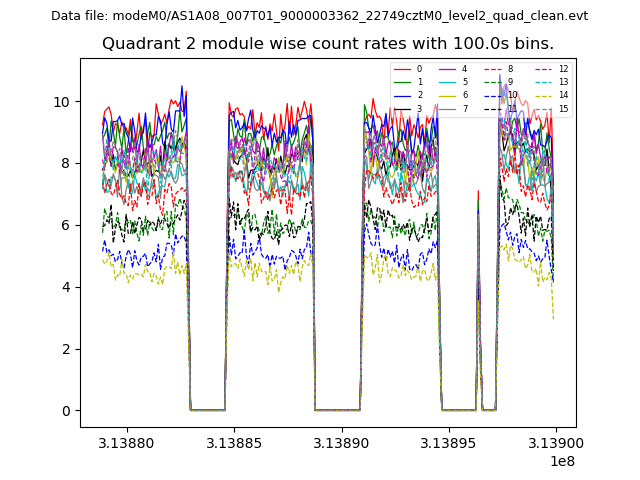
| Module-wise count rates for Quadrant B Data is divided into 100 sec bins |
 |
 |
| Module-wise count rates for Quadrant C Data is divided into 100 sec bins |
 |
 |
| Module-wise count rates for Quadrant D Data is divided into 100 sec bins |
 |
 |
| Parameter | Plot |
|---|---|
| CZT HV Monitor | 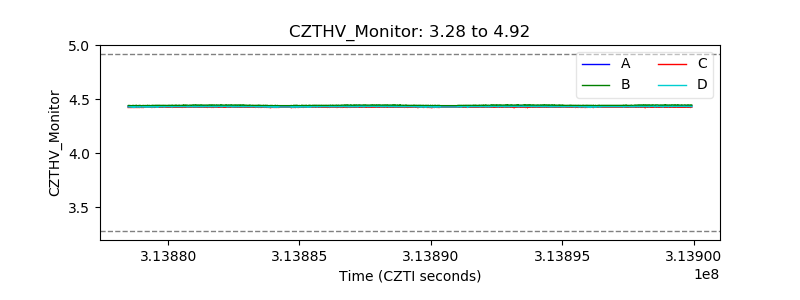 |
| D_VDD | 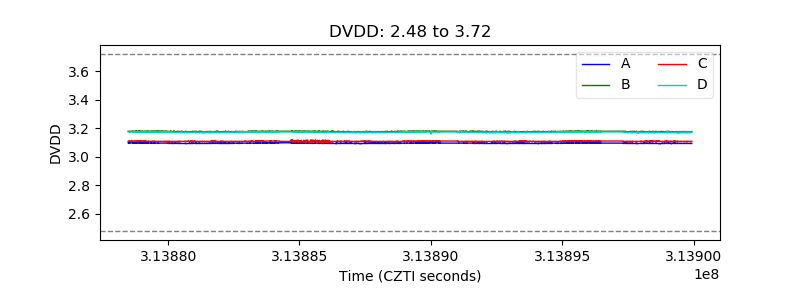 |
| Temperature 1 | 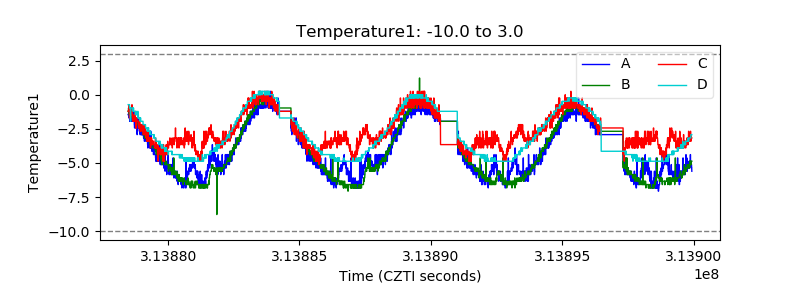 |
| Veto HV Monitor | 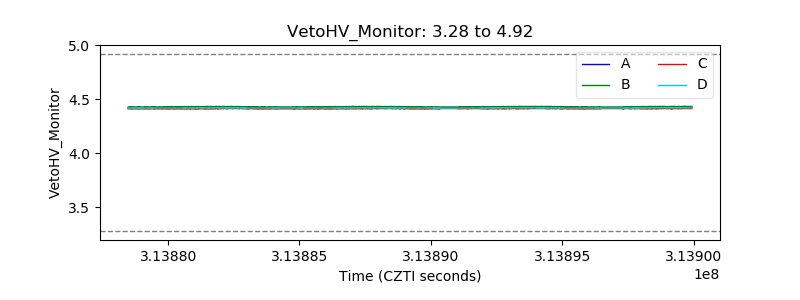 |
| Veto LLD | 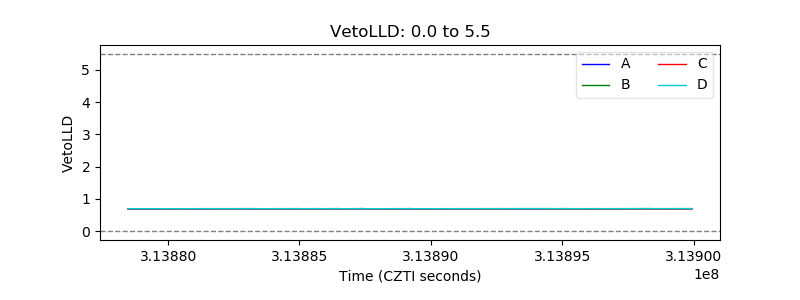 |
| Alpha Counter | 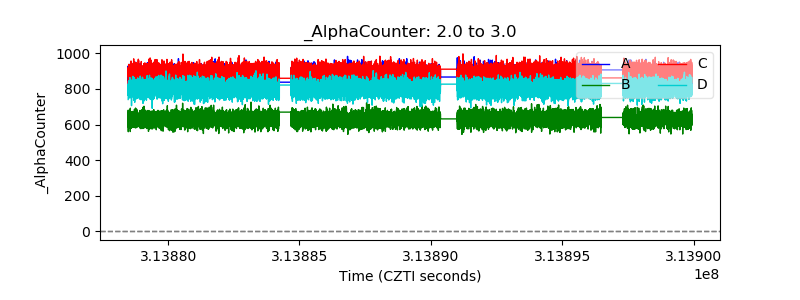 |
| _CPM_Rate | 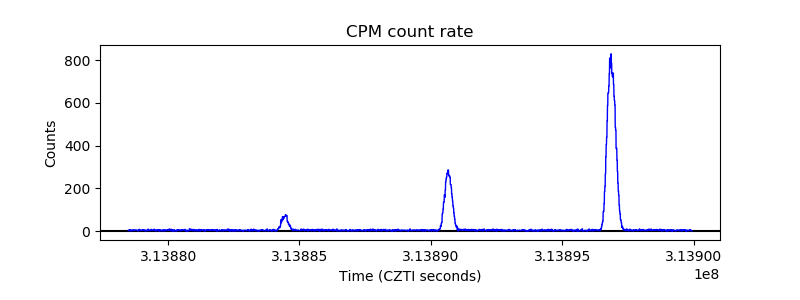 |
| CZT Counter | 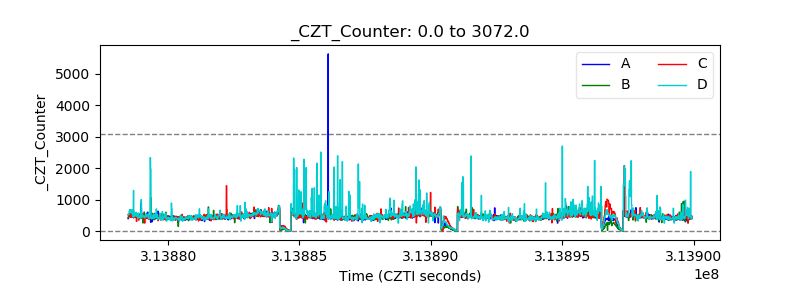 |
| +2.5 Volts monitor | 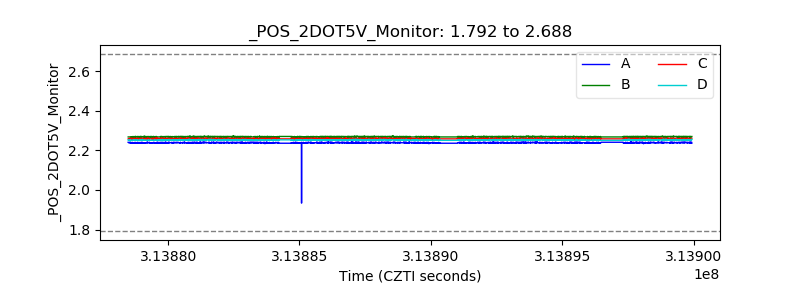 |
| +5 Volts monitor |  |
| _ROLL_ROT | 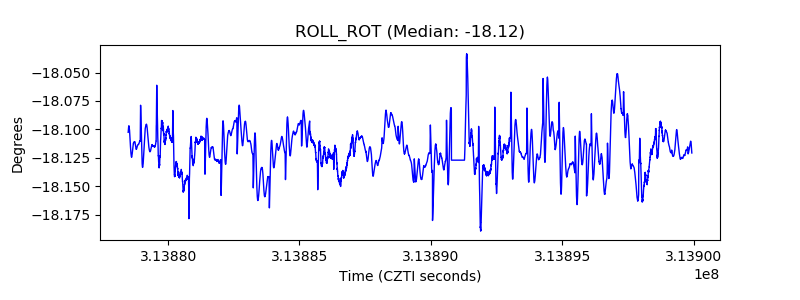 |
| _Roll_DEC | 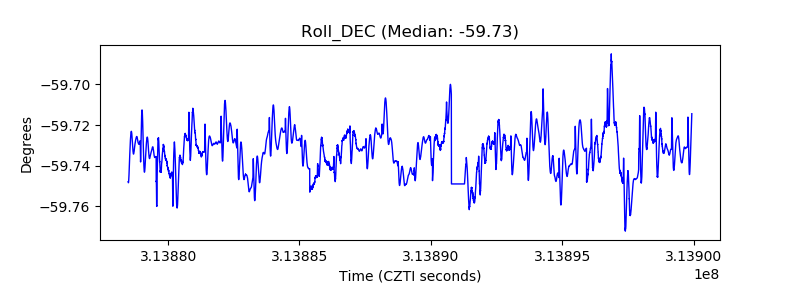 |
| _Roll_RA | 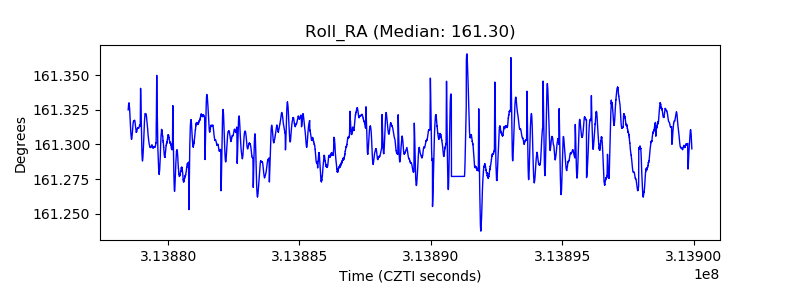 |
| Veto Counter | 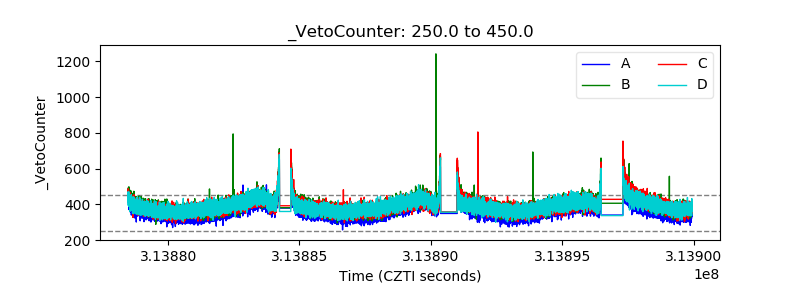 |