| Param | Original file | Final file |
|---|---|---|
| Filename | modeM0/AS1A08_007T01_9000003362_22751cztM0_level2.evt | modeM0/AS1A08_007T01_9000003362_22751cztM0_level2_quad_clean.evt |
| Size (bytes) | 680,690,880 | 125,784,000 |
| Size | 649.2 MB | 120.0 MB |
| Events in quadrant A | 4,473,430 | 798,832 |
| Events in quadrant B | 4,769,783 | 814,976 |
| Events in quadrant C | 4,596,544 | 791,704 |
| Events in quadrant D | 6,142,878 | 756,607 |
| Mode SS | |||
|---|---|---|---|
| Quadrant | BADHDUFLAG | Total packets | Discarded packets |
| A | 0 | 188 | 0 |
| B | 0 | 188 | 0 |
| C | 0 | 188 | 0 |
| D | 0 | 188 | 0 |
| Mode M0 | |||
|---|---|---|---|
| Quadrant | BADHDUFLAG | Total packets | Discarded packets |
| A | 0 | 19117 | 2 |
| B | 0 | 20014 | 2 |
| C | 0 | 19405 | 2 |
| D | 0 | 24399 | 3 |
| Mode M9 | |||
|---|---|---|---|
| Quadrant | BADHDUFLAG | Total packets | Discarded packets |
| A | 0 | 22 | 0 |
| B | 0 | 22 | 0 |
| C | 0 | 22 | 0 |
| D | 0 | 22 | 0 |
| Quadrant | Total seconds | Saturated seconds | Saturation percentage |
|---|---|---|---|
| A | 9341 | 15 | 0.160582% |
| B | 9342 | 58 | 0.620852% |
| C | 9342 | 77 | 0.824235% |
| D | 9341 | 294 | 3.147415% |
Noise dominated data is calculated using 1-second bins in cleaned event files. If a bin has >2000 counts, and if more than 50% of those come from <1% of pixels, then it is considered to be noise-dominated and hence unusable.
| Quadrant | # 1 sec bins | Bins with >0 counts | Bins with >2000 counts | High rate bins dominated by noise | Noise dominated (total time) | Noise dominated (detector-on time) | Marked lightcurve |
|---|---|---|---|---|---|---|---|
| A | 11486 | 9343 | 0 | 0 | 0.00% | 0.00% | 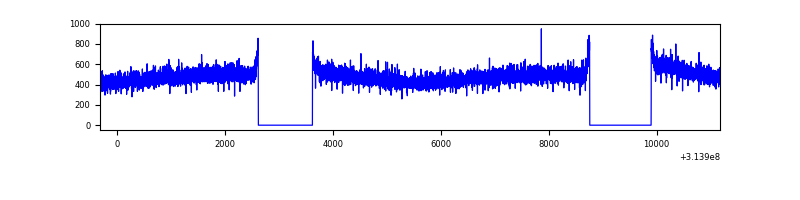 |
| B | 11487 | 9344 | 11 | 11 | 0.10% | 0.12% |  |
| C | 11487 | 9344 | 3 | 3 | 0.03% | 0.03% | 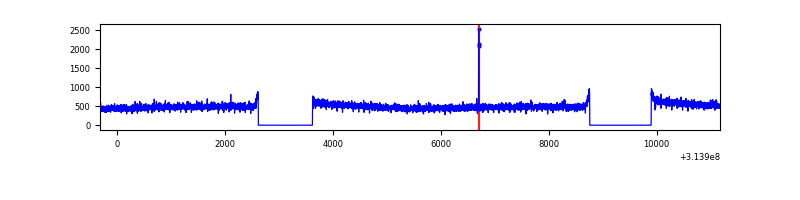 |
| D | 11486 | 9343 | 210 | 210 | 1.83% | 2.25% | 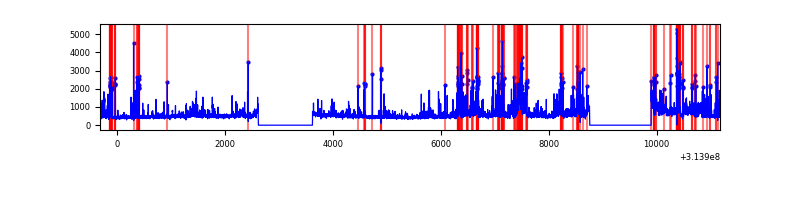 |
Top three noisy pixels from each quadrant. If the there are fewer than three noisy pixels in the level2.evt file, extra rows are filled as -1
| Pixel properties | Quadrant properties | ||||||
|---|---|---|---|---|---|---|---|
| Quadrant | DetID | PixID | Counts | Sigma | Mean | Median | Sigma |
| A | 13 | 254 | 14735 | 58.56 | 1160 | 1138 | 232.2 |
| A | 0 | 226 | 10182 | 38.95 | 1160 | 1138 | 232.2 |
| A | 3 | 137 | 9249 | 34.93 | 1160 | 1138 | 232.2 |
| B | 10 | 247 | 130657 | 599.93 | 1156 | 1128 | 215.9 |
| B | 0 | 190 | 53293 | 241.61 | 1156 | 1128 | 215.9 |
| B | 0 | 230 | 25560 | 113.16 | 1156 | 1128 | 215.9 |
| C | 14 | 238 | 177089 | 670.38 | 1129 | 1137 | 262.5 |
| C | 10 | 22 | 14727 | 51.78 | 1129 | 1137 | 262.5 |
| C | 13 | 61 | 7822 | 25.47 | 1129 | 1137 | 262.5 |
| D | 1 | 52 | 1572746 | 5764.18 | 1131 | 1098 | 272.7 |
| D | 2 | 152 | 201620 | 735.43 | 1131 | 1098 | 272.7 |
| D | 2 | 234 | 39086 | 139.32 | 1131 | 1098 | 272.7 |
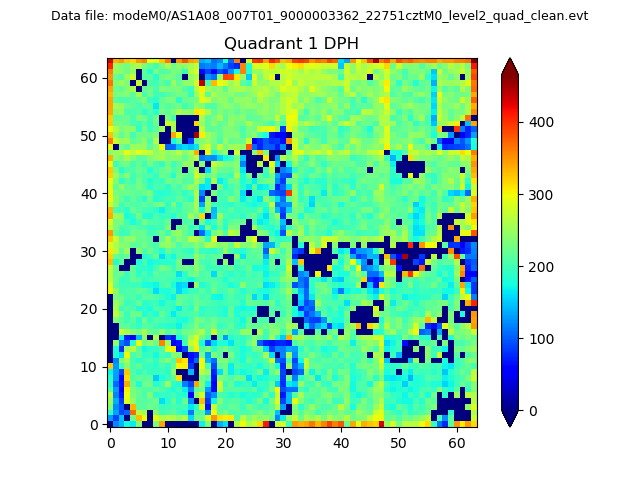
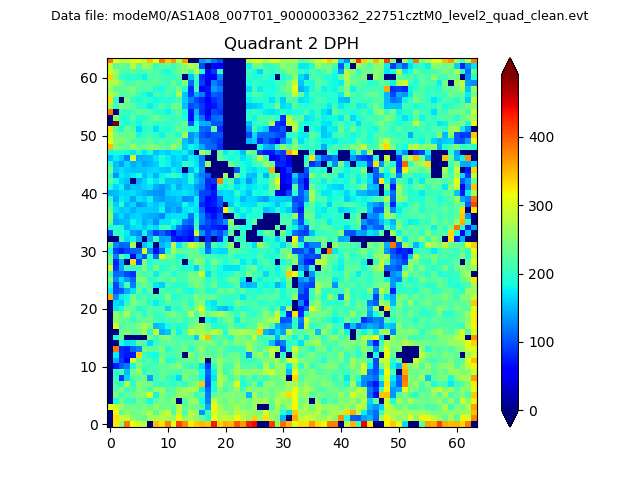
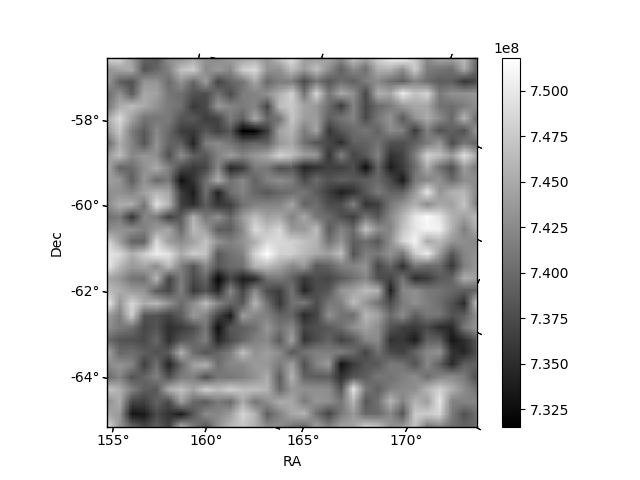
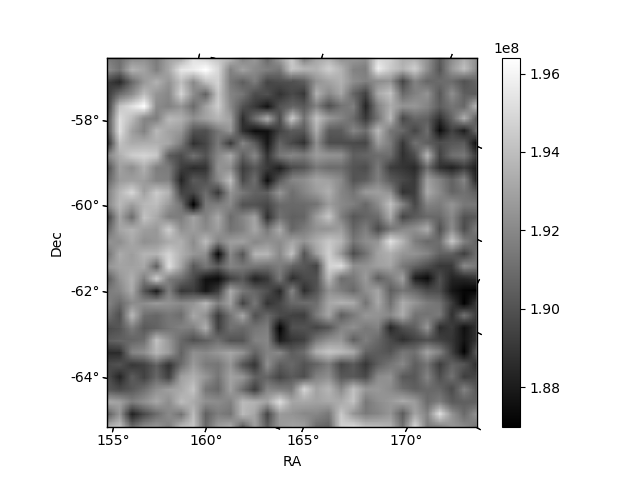
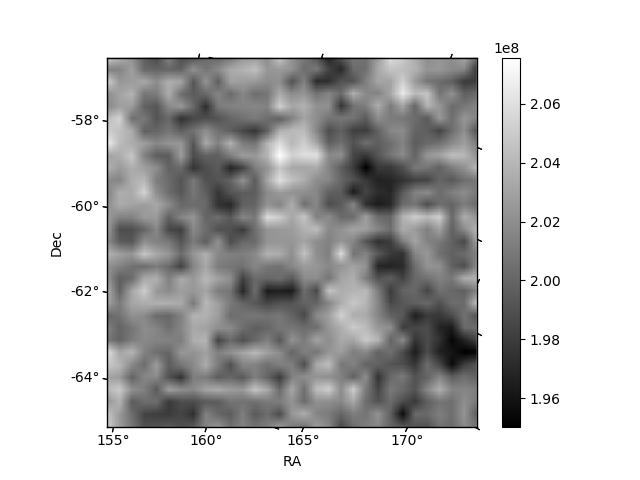
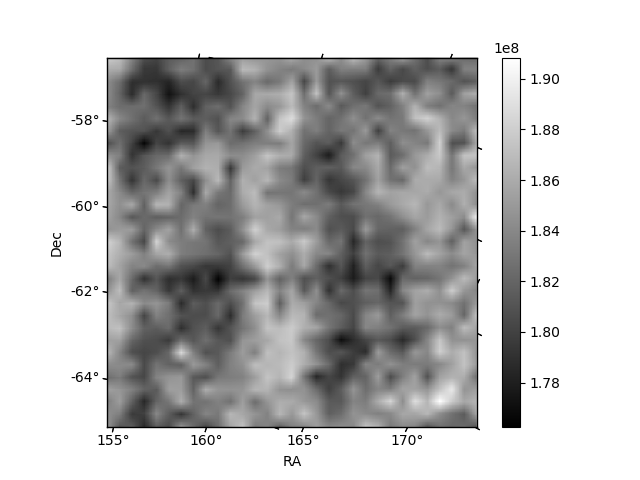
Histogram calculated using DETX and DETY for each event in the final _common_clean file
| Quadrant A | 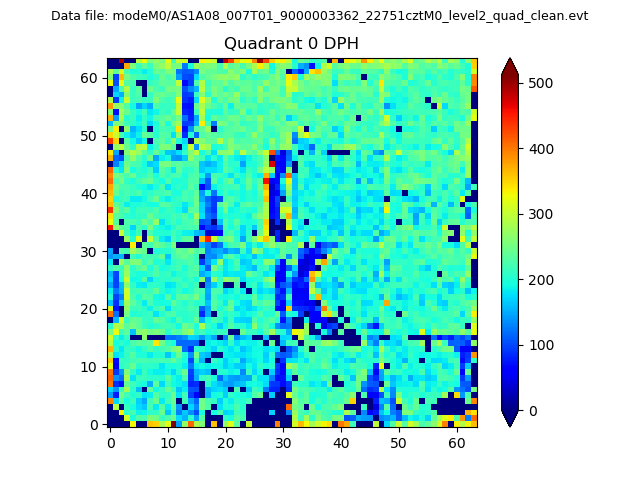 |
 |
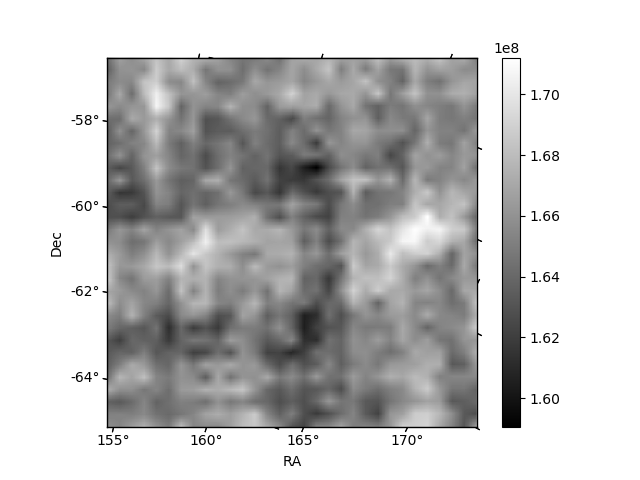
Quadrant B |
|---|---|---|---|
| Quadrant D | 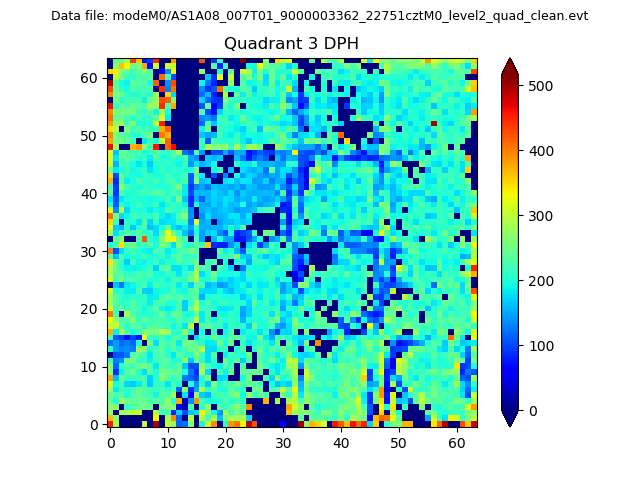 |
 |
Quadrant C |
| Plot type | Count rate plots | Images |
|---|---|---|
| Comparison with Poisson distribution Blue bars denote a histogram of data divided into 1 sec bins. Red curve is a Poisson curve with rate = median count rate of data. |
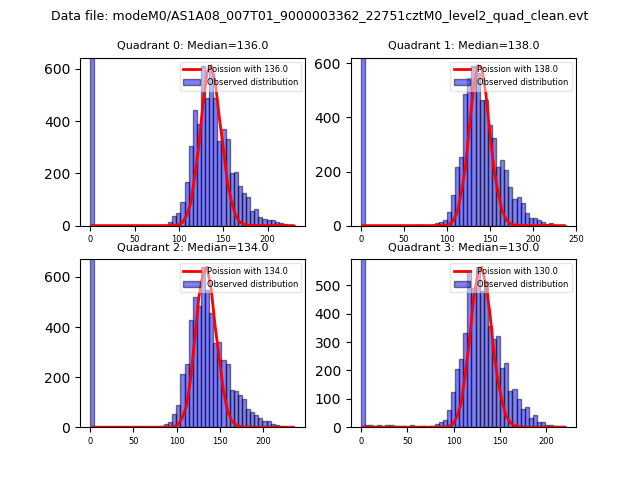 |
 |
| Quadrant-wise count rates Data is divided into 100 sec bins |
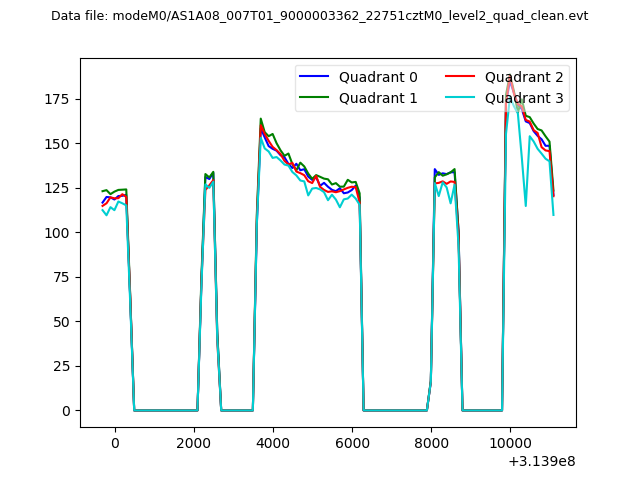 |
|
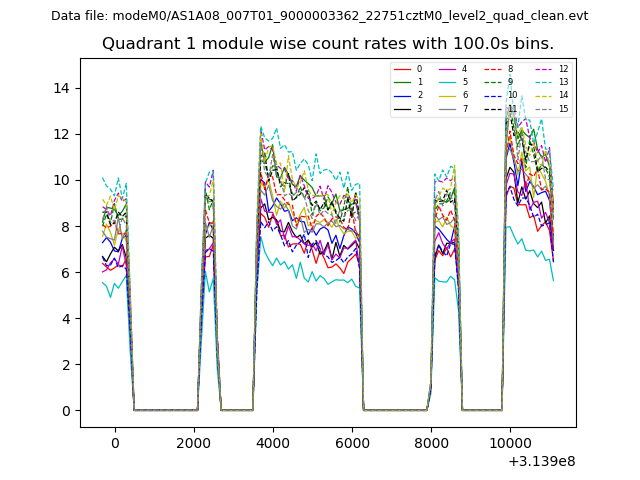
| Module-wise count rates for Quadrant A Data is divided into 100 sec bins |
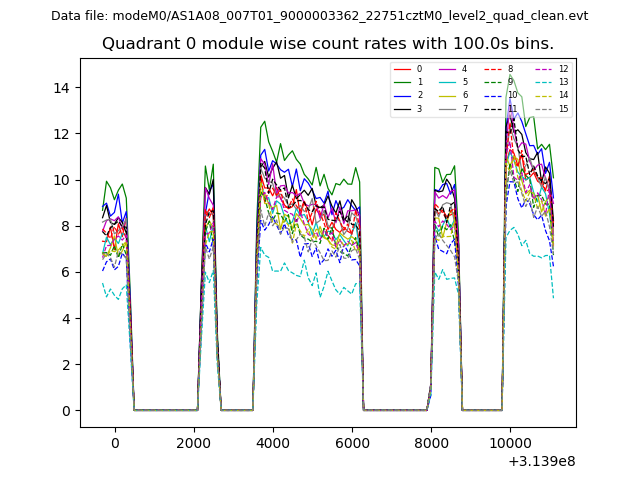 |
 |
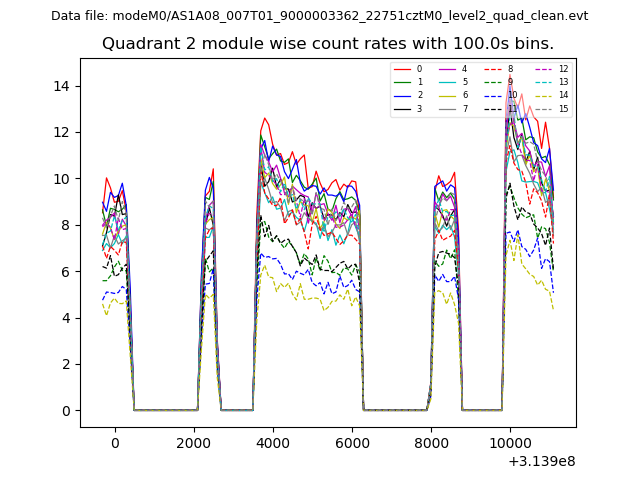
| Module-wise count rates for Quadrant B Data is divided into 100 sec bins |
 |
 |
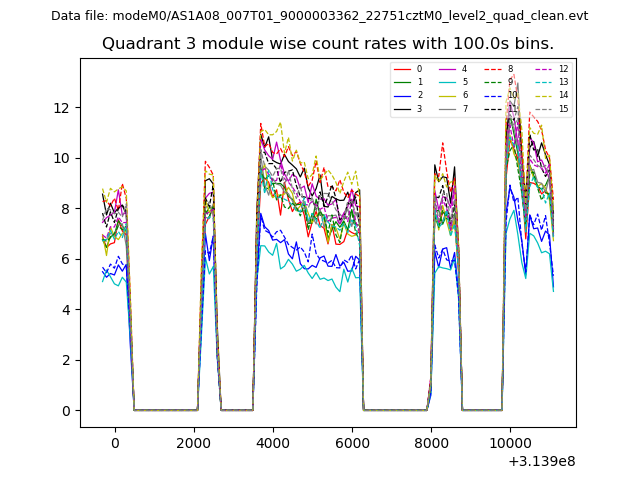
| Module-wise count rates for Quadrant C Data is divided into 100 sec bins |
 |
 |
| Module-wise count rates for Quadrant D Data is divided into 100 sec bins |
 |
 |
| Parameter | Plot |
|---|---|
| CZT HV Monitor | 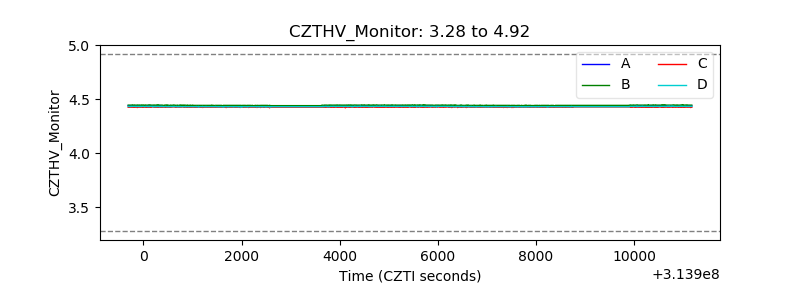 |
| D_VDD |  |
| Temperature 1 | 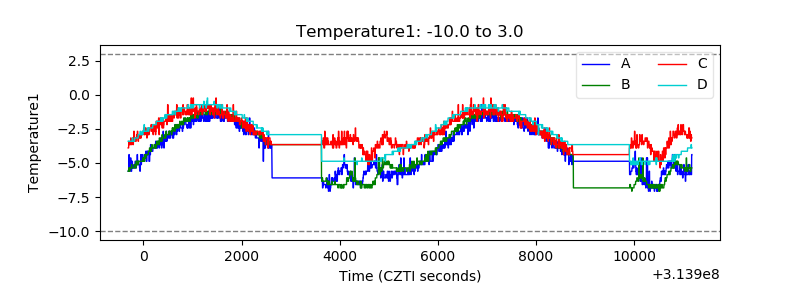 |
| Veto HV Monitor | 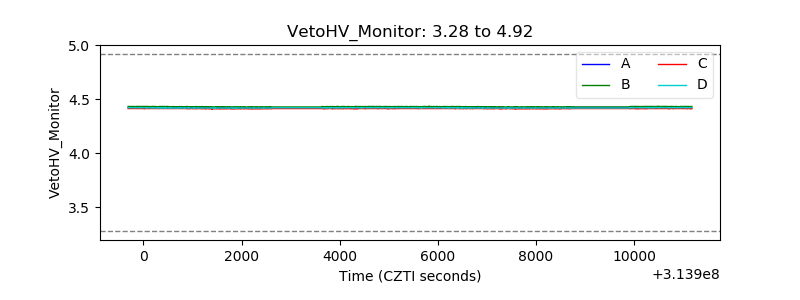 |
| Veto LLD | 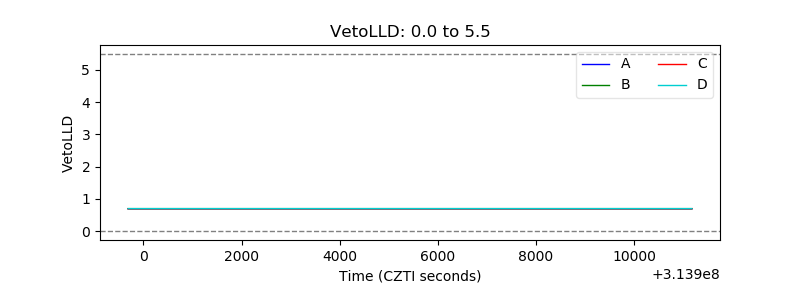 |
| Alpha Counter | 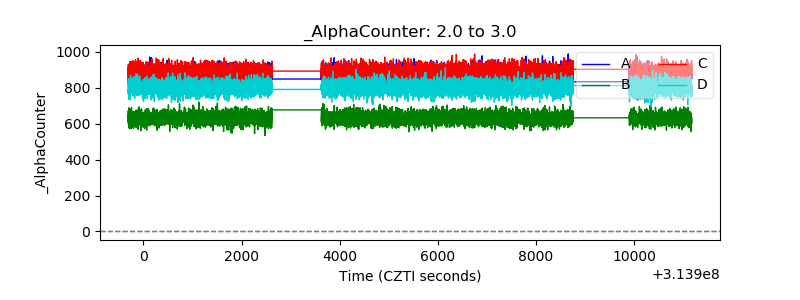 |
| _CPM_Rate | 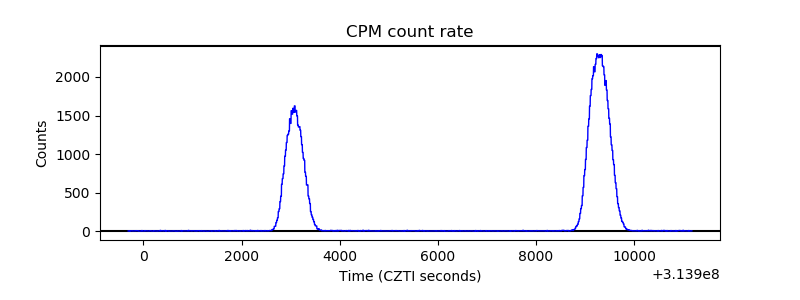 |
| CZT Counter | 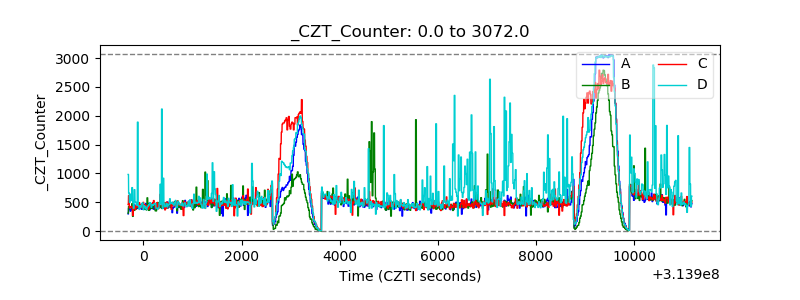 |
| +2.5 Volts monitor |  |
| +5 Volts monitor |  |
| _ROLL_ROT | 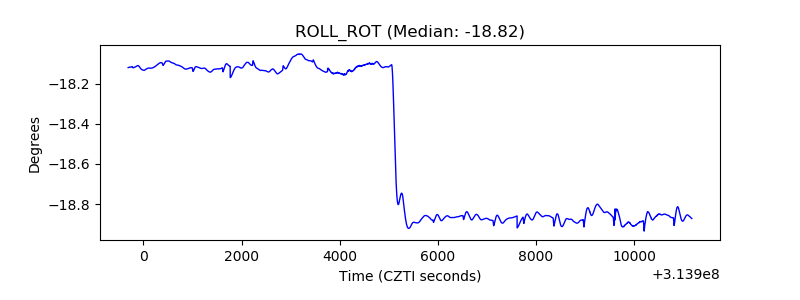 |
| _Roll_DEC | 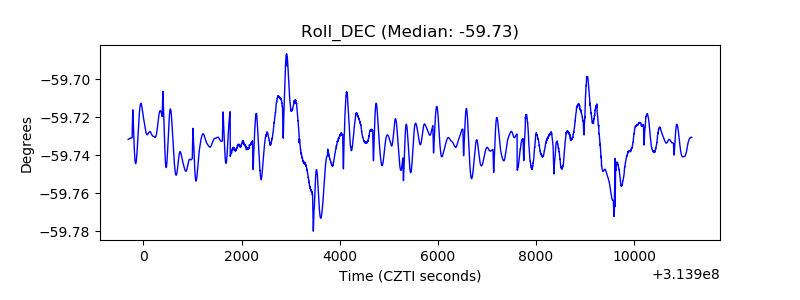 |
| _Roll_RA | 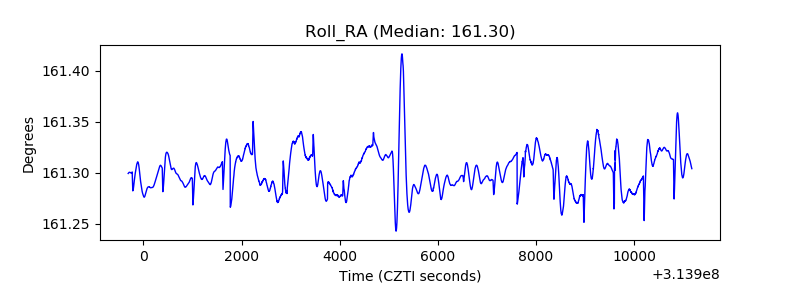 |
| Veto Counter | 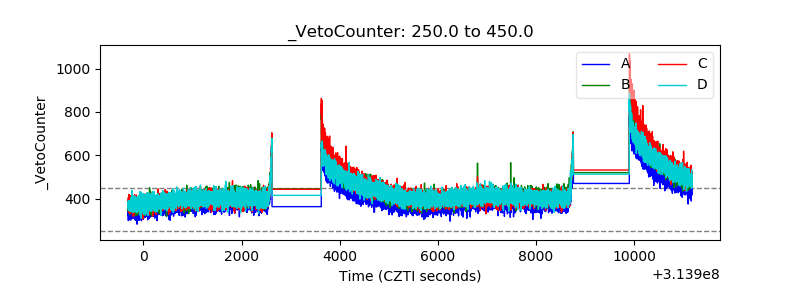 |