| Param | Original file | Final file |
|---|---|---|
| Filename | modeM0/AS1A08_007T01_9000003362_22752cztM0_level2.evt | modeM0/AS1A08_007T01_9000003362_22752cztM0_level2_quad_clean.evt |
| Size (bytes) | 480,614,400 | 99,383,040 |
| Size | 458.3 MB | 94.8 MB |
| Events in quadrant A | 3,047,846 | 656,665 |
| Events in quadrant B | 3,176,915 | 672,527 |
| Events in quadrant C | 3,147,565 | 647,367 |
| Events in quadrant D | 4,774,105 | 612,266 |
| Mode SS | |||
|---|---|---|---|
| Quadrant | BADHDUFLAG | Total packets | Discarded packets |
| A | 0 | 122 | 0 |
| B | 0 | 122 | 0 |
| C | 0 | 122 | 0 |
| D | 0 | 122 | 0 |
| Mode M0 | |||
|---|---|---|---|
| Quadrant | BADHDUFLAG | Total packets | Discarded packets |
| A | 0 | 12717 | 1 |
| B | 0 | 13014 | 1 |
| C | 0 | 13042 | 1 |
| D | 0 | 18116 | 1 |
| Mode M9 | |||
|---|---|---|---|
| Quadrant | BADHDUFLAG | Total packets | Discarded packets |
| A | 0 | 12 | 0 |
| B | 0 | 12 | 0 |
| C | 0 | 12 | 0 |
| D | 0 | 12 | 0 |
| Quadrant | Total seconds | Saturated seconds | Saturation percentage |
|---|---|---|---|
| A | 6029 | 42 | 0.696633% |
| B | 6029 | 60 | 0.995190% |
| C | 6029 | 76 | 1.260574% |
| D | 6029 | 389 | 6.452148% |
Noise dominated data is calculated using 1-second bins in cleaned event files. If a bin has >2000 counts, and if more than 50% of those come from <1% of pixels, then it is considered to be noise-dominated and hence unusable.
| Quadrant | # 1 sec bins | Bins with >0 counts | Bins with >2000 counts | High rate bins dominated by noise | Noise dominated (total time) | Noise dominated (detector-on time) | Marked lightcurve |
|---|---|---|---|---|---|---|---|
| A | 7239 | 6030 | 0 | 0 | 0.00% | 0.00% | 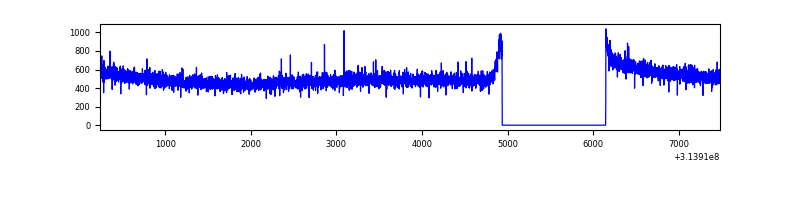 |
| B | 7239 | 6030 | 3 | 3 | 0.04% | 0.05% | 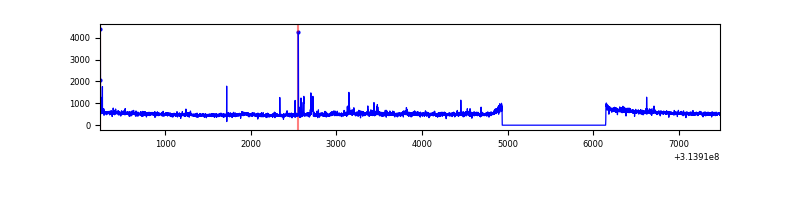 |
| C | 7239 | 6030 | 0 | 0 | 0.00% | 0.00% |  |
| D | 7239 | 6030 | 208 | 208 | 2.87% | 3.45% | 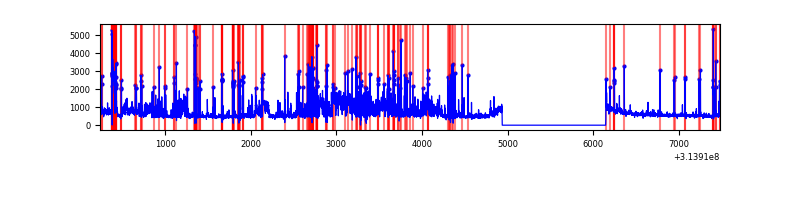 |
Top three noisy pixels from each quadrant. If the there are fewer than three noisy pixels in the level2.evt file, extra rows are filled as -1
| Pixel properties | Quadrant properties | ||||||
|---|---|---|---|---|---|---|---|
| Quadrant | DetID | PixID | Counts | Sigma | Mean | Median | Sigma |
| A | 13 | 254 | 10120 | 59.93 | 790 | 776 | 155.9 |
| A | 0 | 226 | 7008 | 39.97 | 790 | 776 | 155.9 |
| A | 3 | 137 | 6032 | 33.71 | 790 | 776 | 155.9 |
| B | 0 | 190 | 38940 | 262.86 | 785 | 766 | 145.2 |
| B | 0 | 230 | 32115 | 215.86 | 785 | 766 | 145.2 |
| B | 12 | 111 | 16505 | 108.37 | 785 | 766 | 145.2 |
| C | 14 | 238 | 121716 | 667.19 | 775 | 779 | 181.3 |
| C | 13 | 61 | 5395 | 25.47 | 775 | 779 | 181.3 |
| C | 10 | 22 | 5102 | 23.85 | 775 | 779 | 181.3 |
| D | 1 | 52 | 1712881 | 9339.36 | 762 | 743 | 183.3 |
| D | 2 | 152 | 128794 | 698.49 | 762 | 743 | 183.3 |
| D | 2 | 234 | 25456 | 134.8 | 762 | 743 | 183.3 |
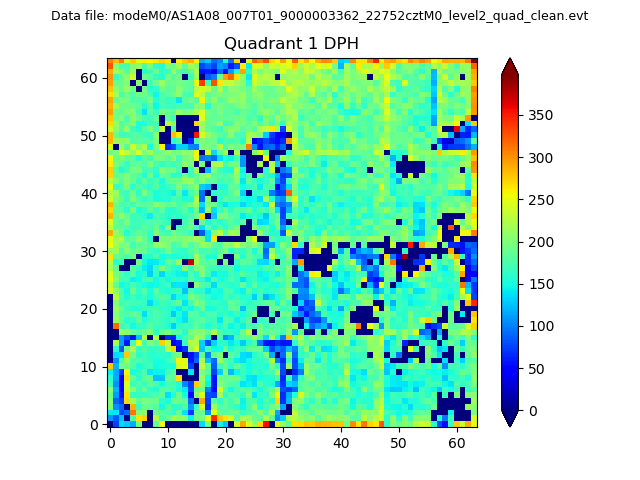
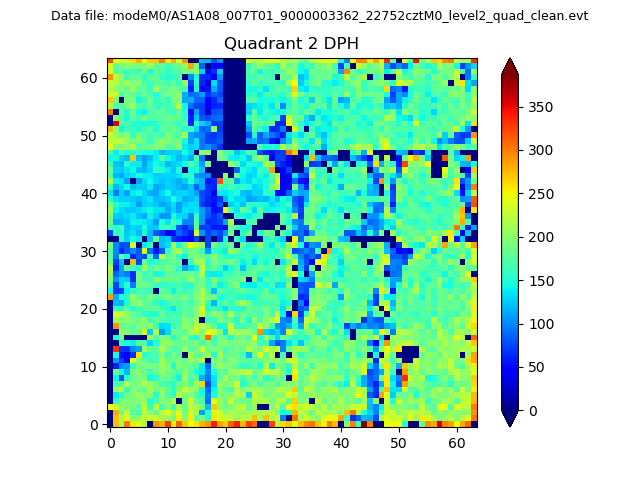
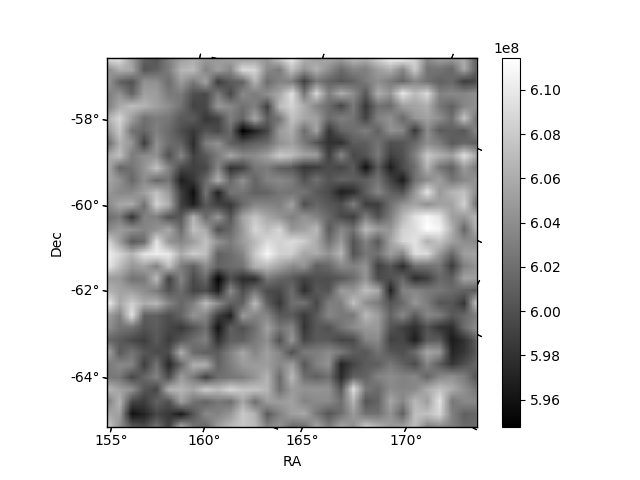
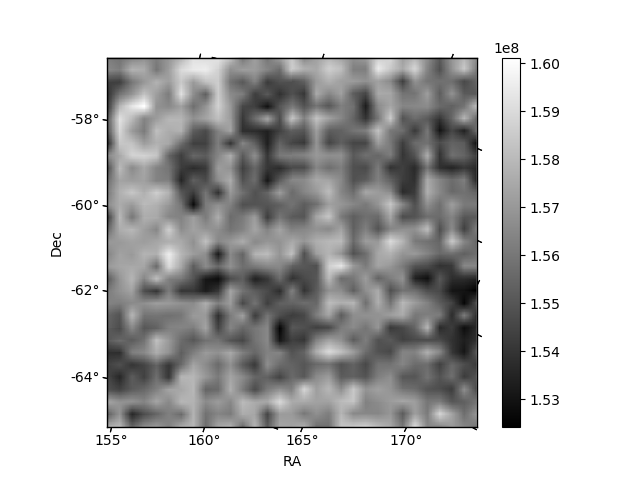
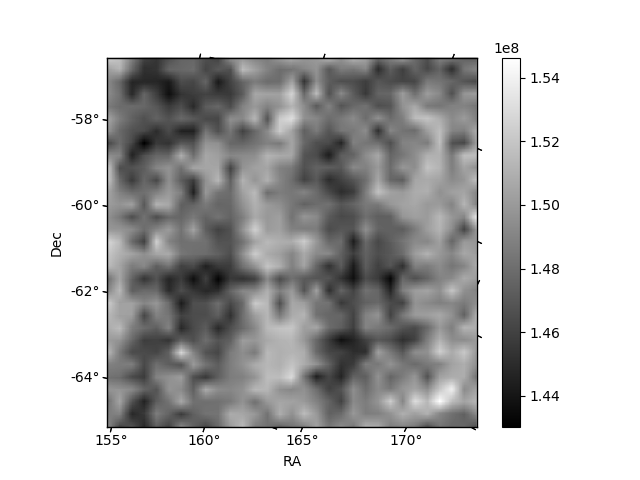
Histogram calculated using DETX and DETY for each event in the final _common_clean file
| Quadrant A | 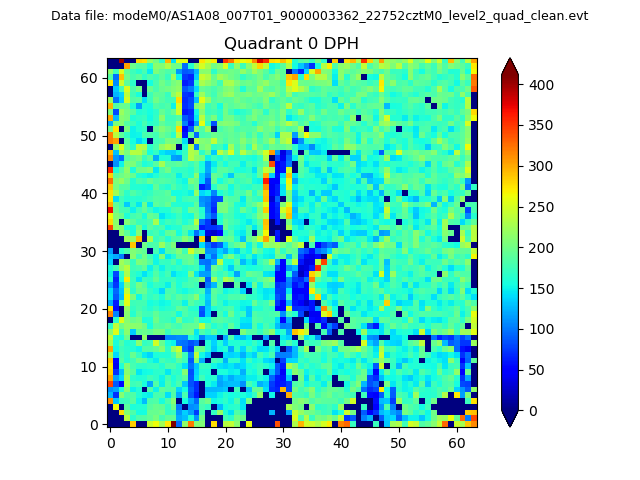 |
 |
Quadrant B |
|---|---|---|---|
| Quadrant D | 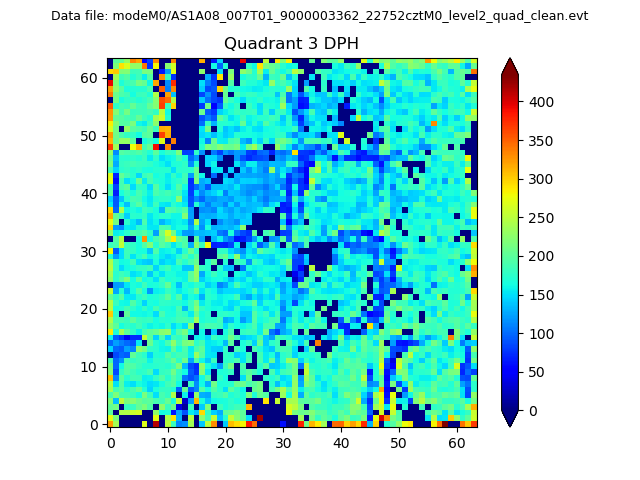 |
 |
Quadrant C |
| Plot type | Count rate plots | Images |
|---|---|---|
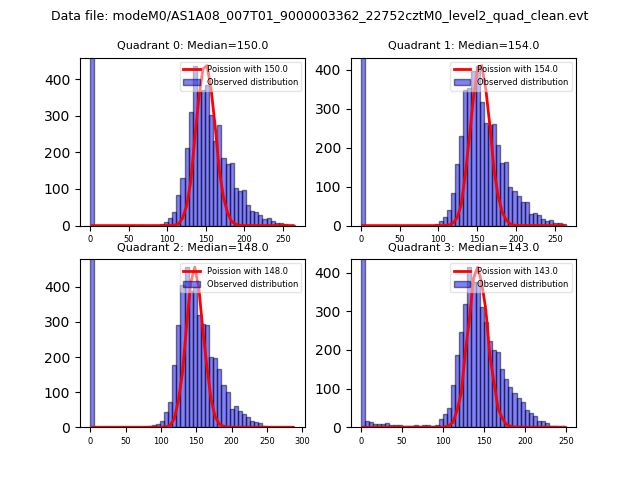
| Comparison with Poisson distribution Blue bars denote a histogram of data divided into 1 sec bins. Red curve is a Poisson curve with rate = median count rate of data. |
 |
 |
| Quadrant-wise count rates Data is divided into 100 sec bins |
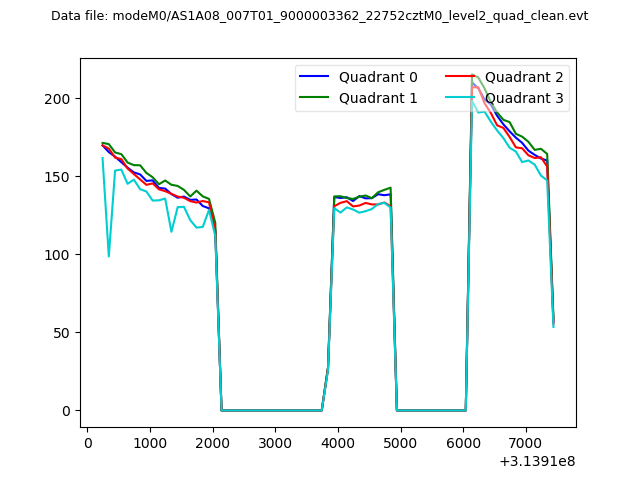 |
|
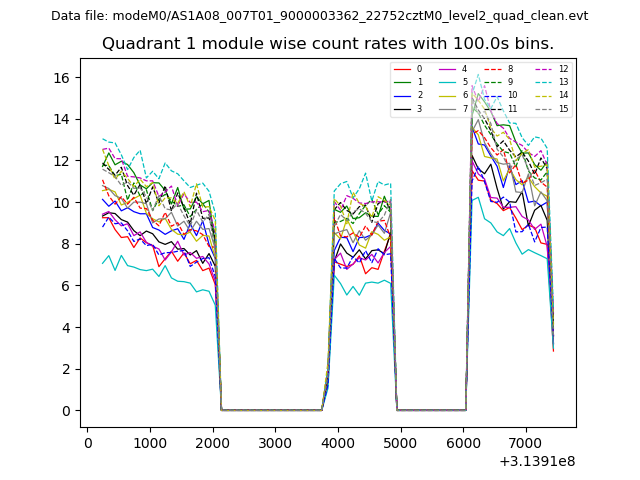
| Module-wise count rates for Quadrant A Data is divided into 100 sec bins |
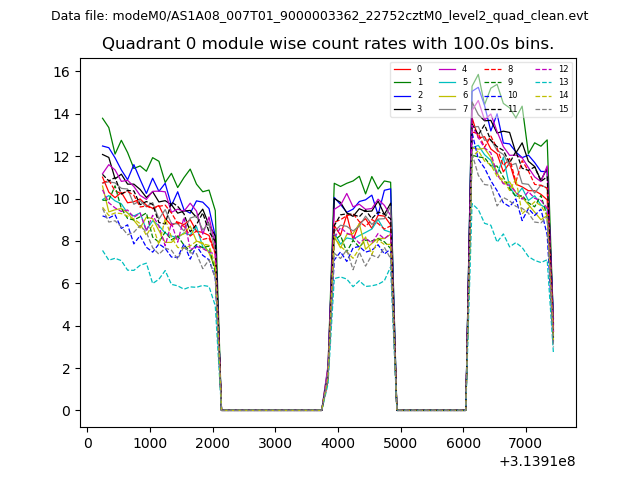 |
 |
| Module-wise count rates for Quadrant B Data is divided into 100 sec bins |
 |
 |
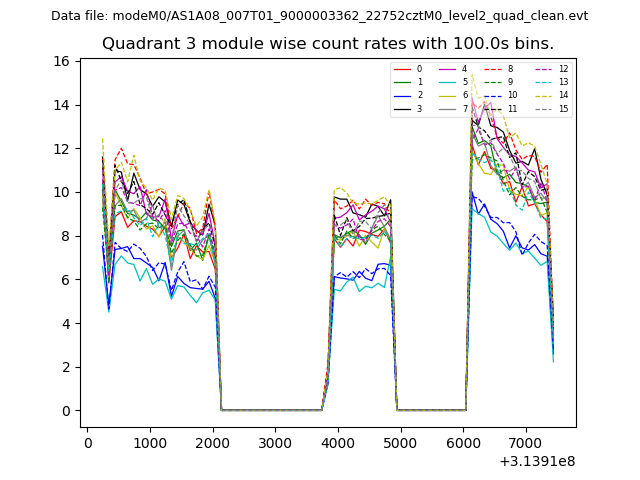
| Module-wise count rates for Quadrant C Data is divided into 100 sec bins |
 |
 |
| Module-wise count rates for Quadrant D Data is divided into 100 sec bins |
 |
 |
| Parameter | Plot |
|---|---|
| CZT HV Monitor | 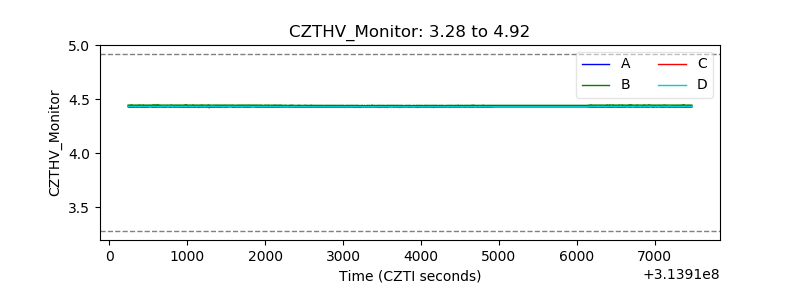 |
| D_VDD | 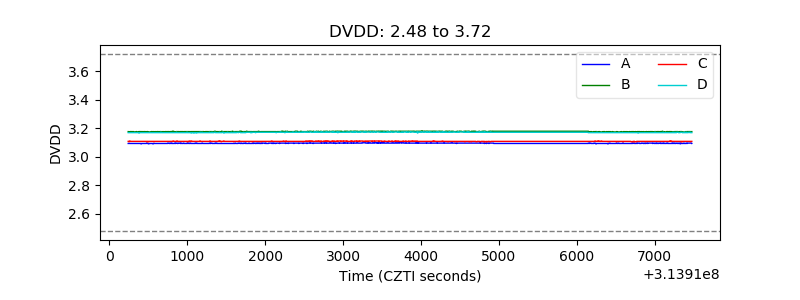 |
| Temperature 1 | 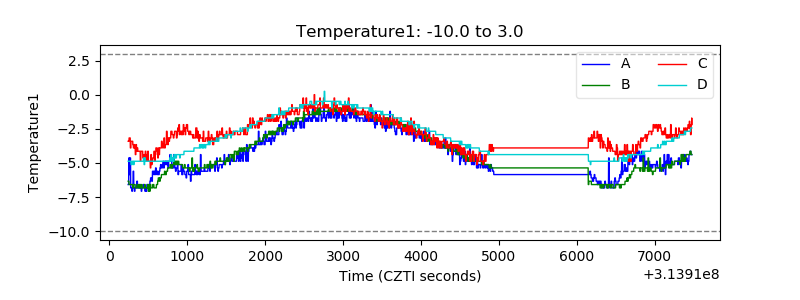 |
| Veto HV Monitor |  |
| Veto LLD | 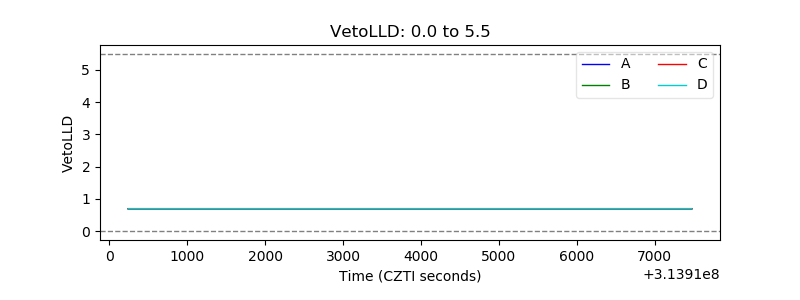 |
| Alpha Counter | 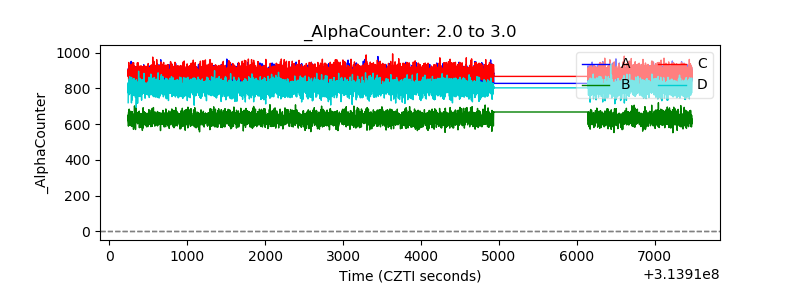 |
| _CPM_Rate | 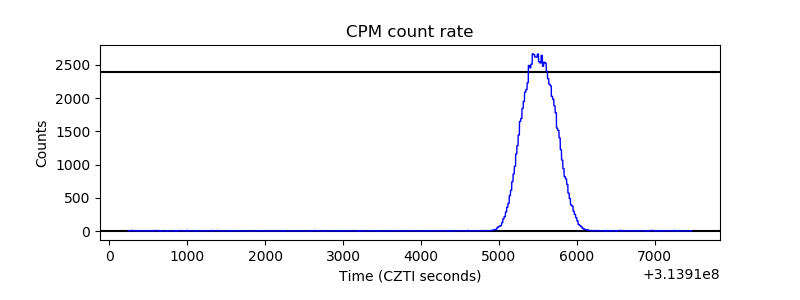 |
| CZT Counter | 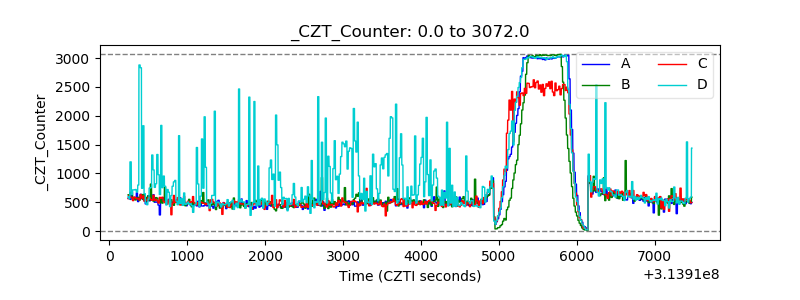 |
| +2.5 Volts monitor |  |
| +5 Volts monitor |  |
| _ROLL_ROT | 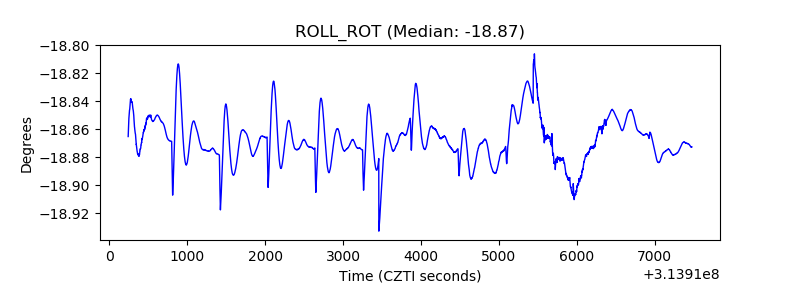 |
| _Roll_DEC | 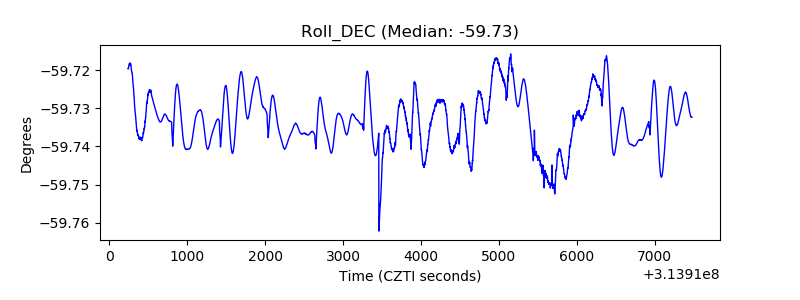 |
| _Roll_RA | 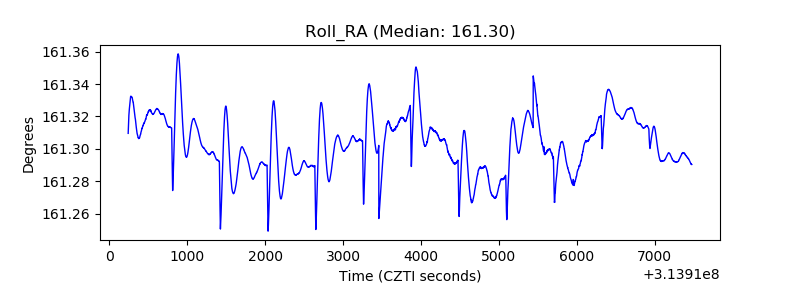 |
| Veto Counter | 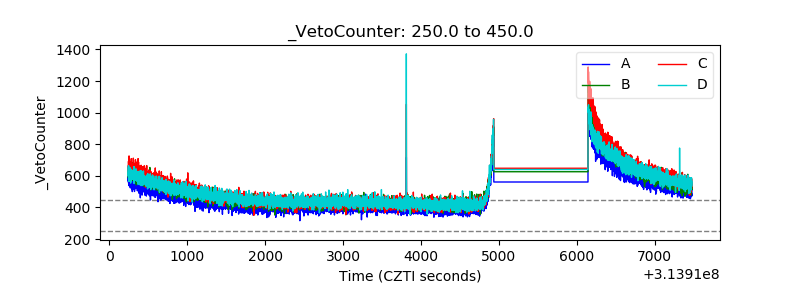 |