| Param | Original file | Final file |
|---|---|---|
| Filename | modeM0/AS1A08_007T01_9000003362_22753cztM0_level2.evt | modeM0/AS1A08_007T01_9000003362_22753cztM0_level2_quad_clean.evt |
| Size (bytes) | 495,734,400 | 108,501,120 |
| Size | 472.8 MB | 103.5 MB |
| Events in quadrant A | 3,264,066 | 725,861 |
| Events in quadrant B | 3,343,179 | 738,830 |
| Events in quadrant C | 3,346,924 | 706,583 |
| Events in quadrant D | 4,644,161 | 687,654 |
| Mode SS | |||
|---|---|---|---|
| Quadrant | BADHDUFLAG | Total packets | Discarded packets |
| A | 0 | 126 | 0 |
| B | 0 | 126 | 0 |
| C | 0 | 126 | 0 |
| D | 0 | 126 | 0 |
| Mode M0 | |||
|---|---|---|---|
| Quadrant | BADHDUFLAG | Total packets | Discarded packets |
| A | 0 | 13393 | 1 |
| B | 0 | 13606 | 1 |
| C | 0 | 13771 | 1 |
| D | 0 | 17852 | 1 |
| Mode M9 | |||
|---|---|---|---|
| Quadrant | BADHDUFLAG | Total packets | Discarded packets |
| A | 0 | 12 | 0 |
| B | 0 | 12 | 0 |
| C | 0 | 12 | 0 |
| D | 0 | 12 | 0 |
| Quadrant | Total seconds | Saturated seconds | Saturation percentage |
|---|---|---|---|
| A | 6112 | 64 | 1.047120% |
| B | 6113 | 55 | 0.899722% |
| C | 6113 | 111 | 1.815802% |
| D | 6113 | 352 | 5.758220% |
Noise dominated data is calculated using 1-second bins in cleaned event files. If a bin has >2000 counts, and if more than 50% of those come from <1% of pixels, then it is considered to be noise-dominated and hence unusable.
| Quadrant | # 1 sec bins | Bins with >0 counts | Bins with >2000 counts | High rate bins dominated by noise | Noise dominated (total time) | Noise dominated (detector-on time) | Marked lightcurve |
|---|---|---|---|---|---|---|---|
| A | 7402 | 6113 | 0 | 0 | 0.00% | 0.00% | 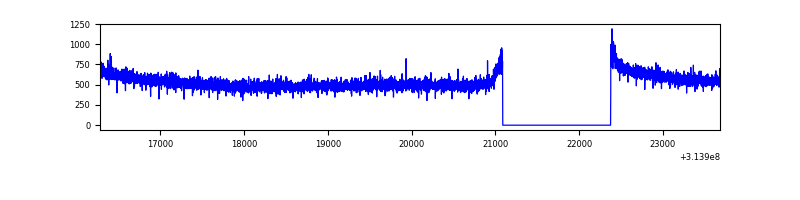 |
| B | 7403 | 6114 | 2 | 2 | 0.03% | 0.03% | 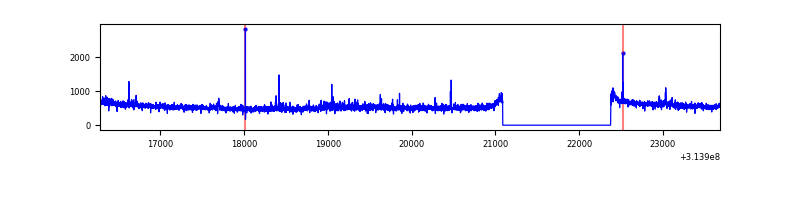 |
| C | 7403 | 6114 | 0 | 0 | 0.00% | 0.00% | 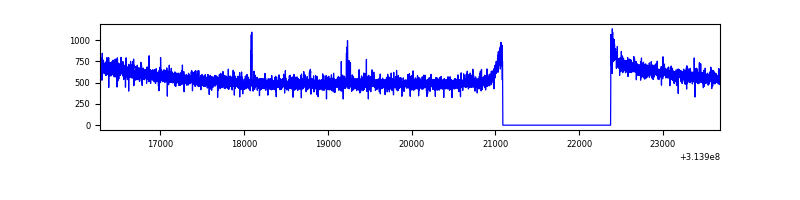 |
| D | 7403 | 6114 | 228 | 228 | 3.08% | 3.73% | 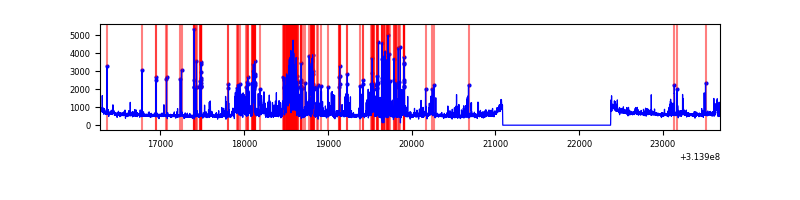 |
Top three noisy pixels from each quadrant. If the there are fewer than three noisy pixels in the level2.evt file, extra rows are filled as -1
| Pixel properties | Quadrant properties | ||||||
|---|---|---|---|---|---|---|---|
| Quadrant | DetID | PixID | Counts | Sigma | Mean | Median | Sigma |
| A | 13 | 254 | 10761 | 59.98 | 846 | 830 | 165.6 |
| A | 0 | 226 | 7536 | 40.5 | 846 | 830 | 165.6 |
| A | 3 | 137 | 6333 | 33.24 | 846 | 830 | 165.6 |
| B | 0 | 228 | 31785 | 202.66 | 835 | 817 | 152.8 |
| B | 0 | 230 | 17152 | 106.9 | 835 | 817 | 152.8 |
| B | 12 | 111 | 16848 | 104.91 | 835 | 817 | 152.8 |
| C | 14 | 238 | 130858 | 691.51 | 820 | 828 | 188.0 |
| C | 2 | 16 | 9813 | 47.78 | 820 | 828 | 188.0 |
| C | 10 | 22 | 8776 | 42.27 | 820 | 828 | 188.0 |
| D | 1 | 52 | 1179591 | 6035.11 | 822 | 800 | 195.3 |
| D | 2 | 152 | 120816 | 614.45 | 822 | 800 | 195.3 |
| D | 10 | 230 | 82671 | 419.16 | 822 | 800 | 195.3 |
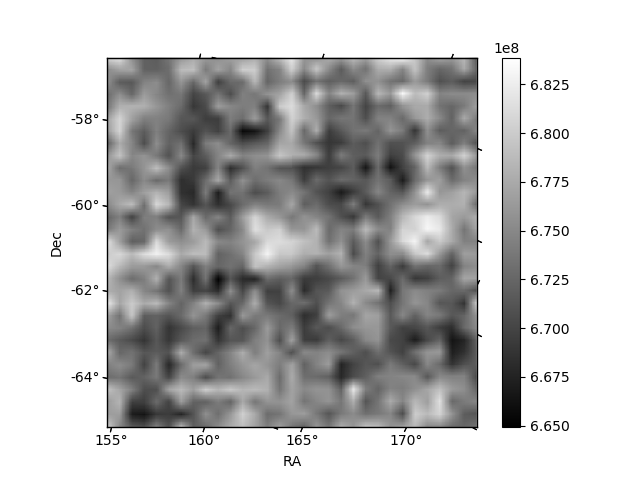
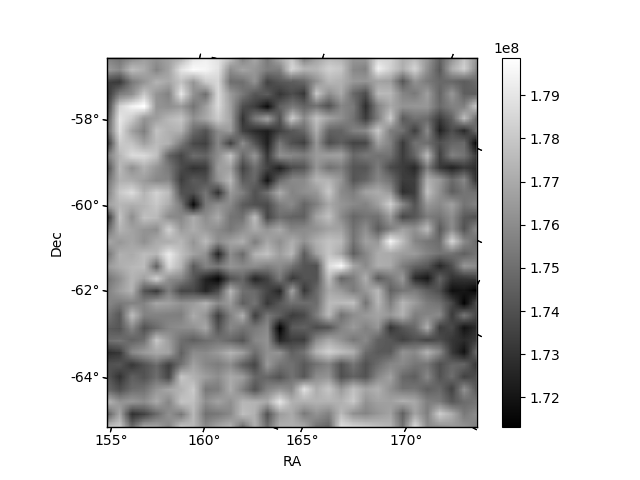
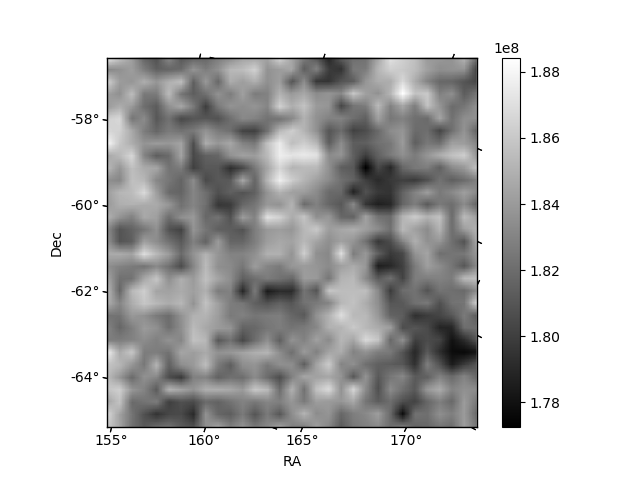
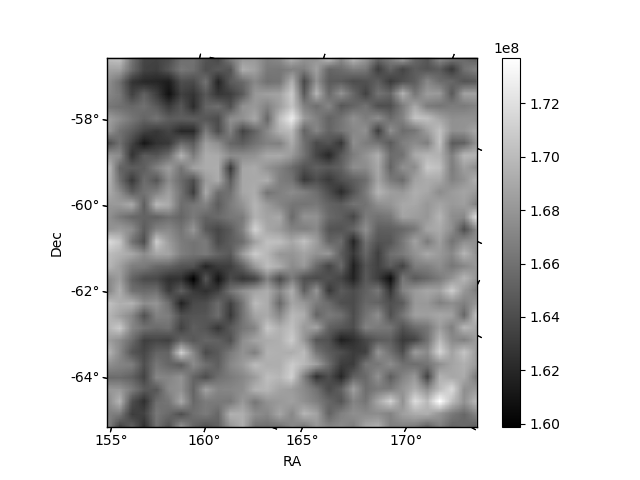
Histogram calculated using DETX and DETY for each event in the final _common_clean file
| Quadrant A | 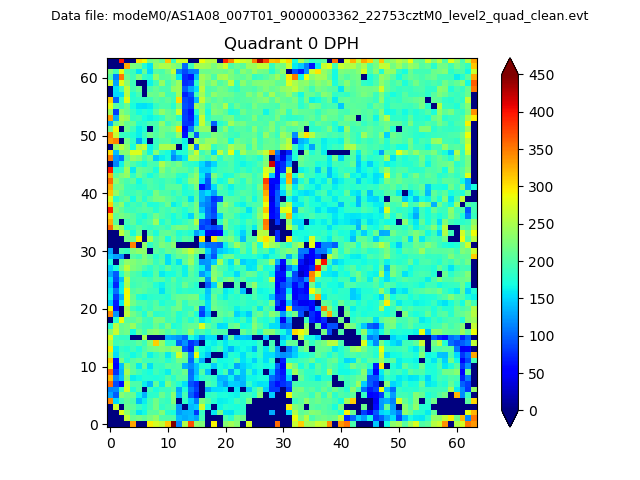 |
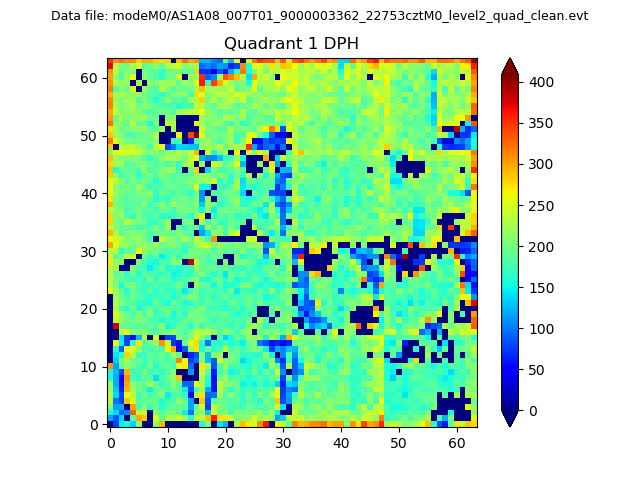 |
Quadrant B |
|---|---|---|---|
| Quadrant D |  |
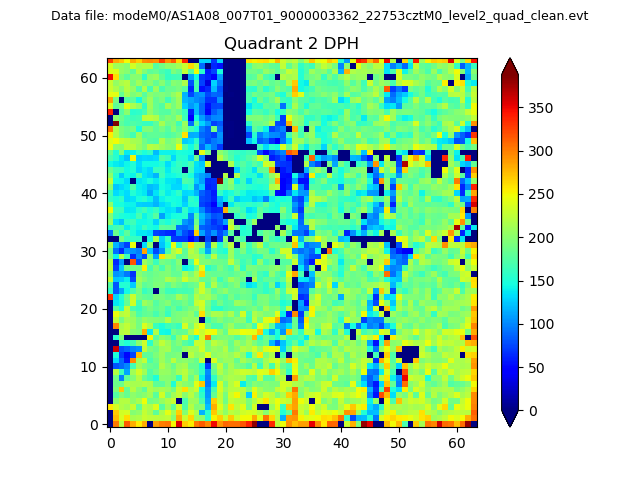 |
Quadrant C |
| Plot type | Count rate plots | Images |
|---|---|---|
| Comparison with Poisson distribution Blue bars denote a histogram of data divided into 1 sec bins. Red curve is a Poisson curve with rate = median count rate of data. |
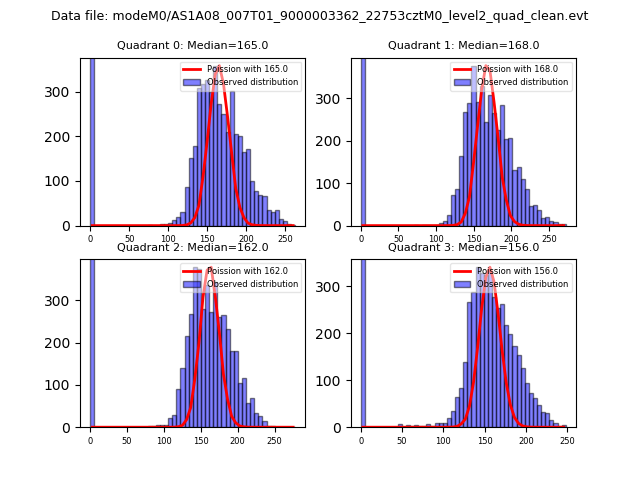 |
 |
| Quadrant-wise count rates Data is divided into 100 sec bins |
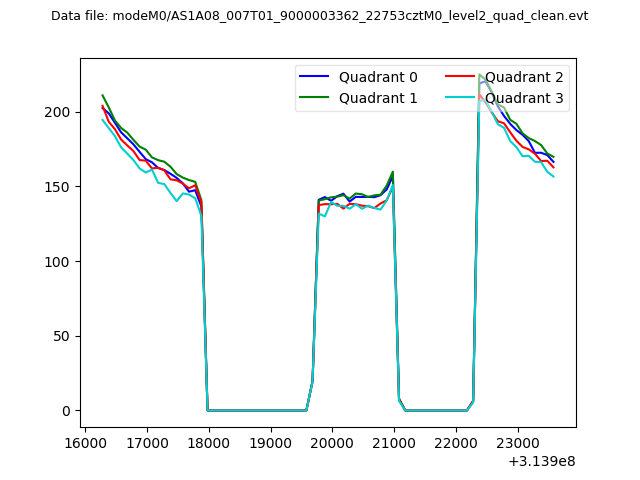 |
|
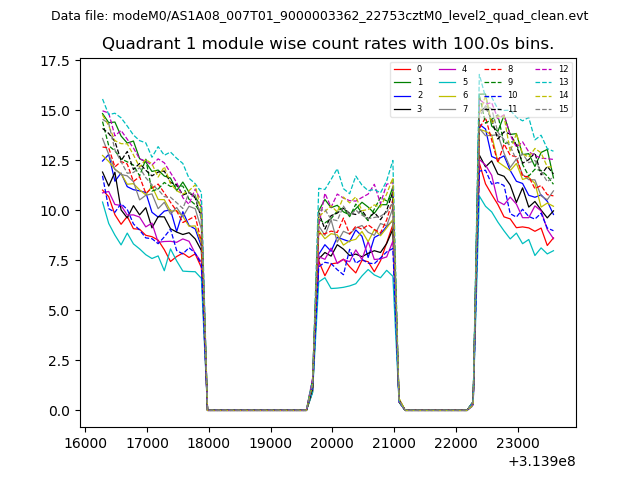
| Module-wise count rates for Quadrant A Data is divided into 100 sec bins |
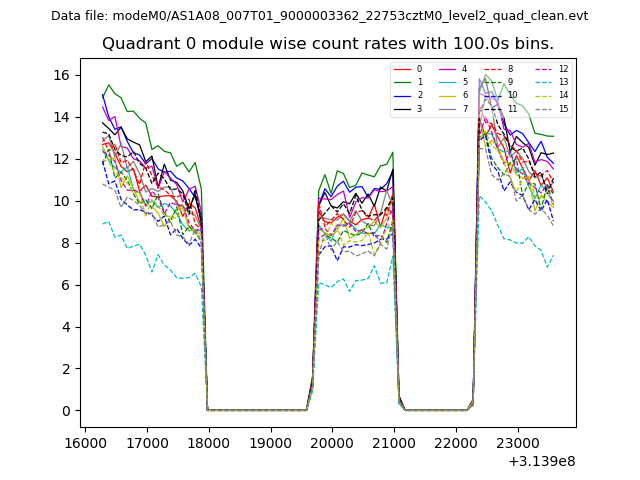 |
 |
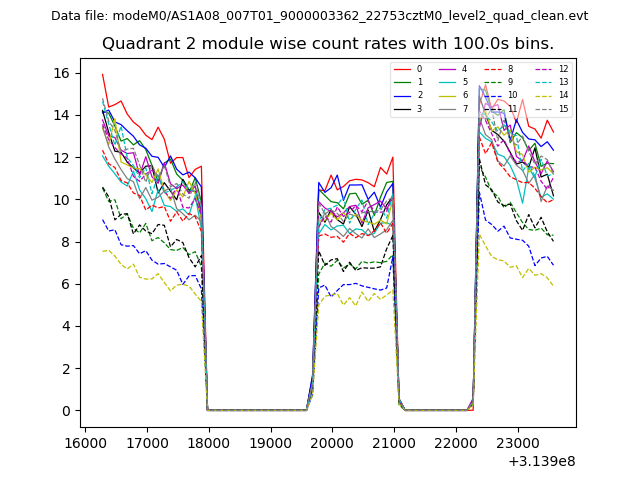
| Module-wise count rates for Quadrant B Data is divided into 100 sec bins |
 |
 |
| Module-wise count rates for Quadrant C Data is divided into 100 sec bins |
 |
 |
| Module-wise count rates for Quadrant D Data is divided into 100 sec bins |
 |
 |
| Parameter | Plot |
|---|---|
| CZT HV Monitor | 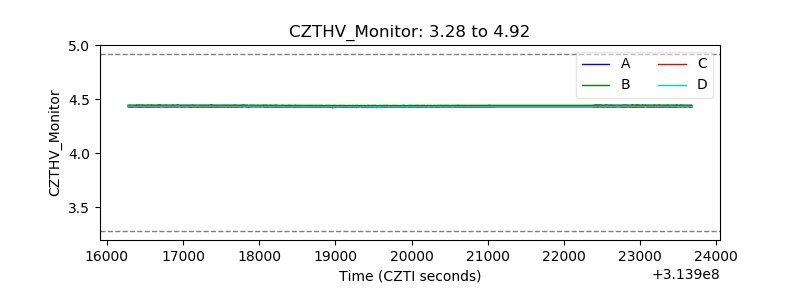 |
| D_VDD | 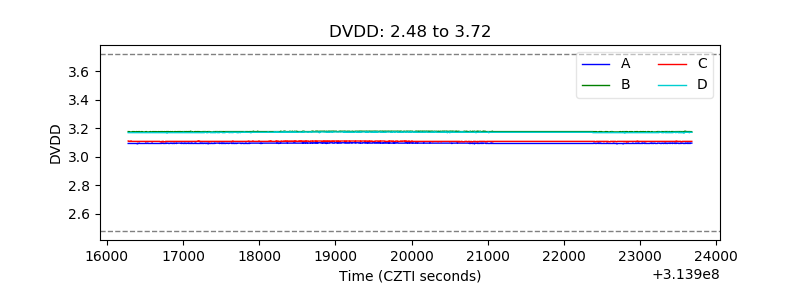 |
| Temperature 1 | 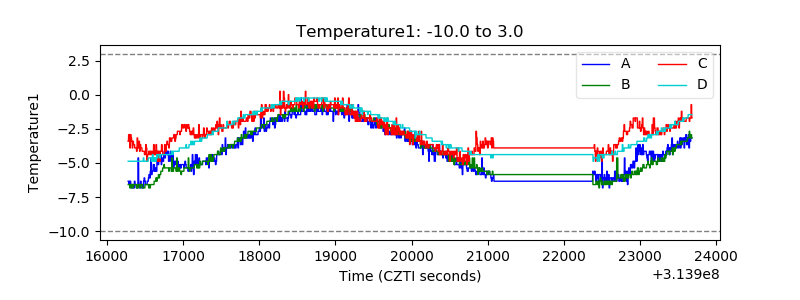 |
| Veto HV Monitor | 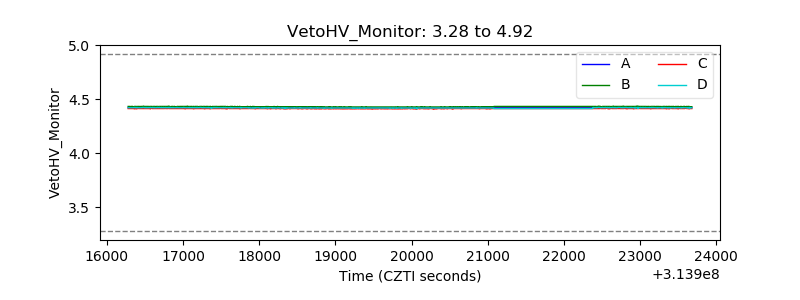 |
| Veto LLD | 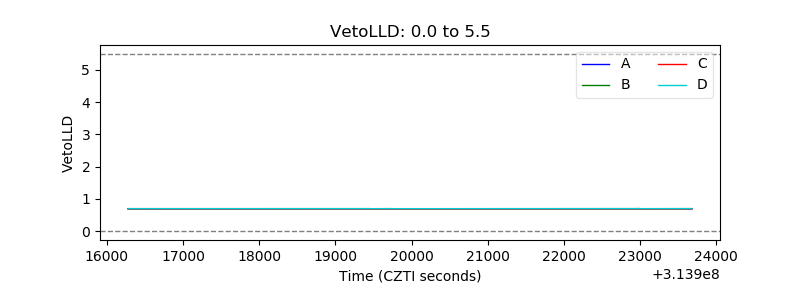 |
| Alpha Counter | 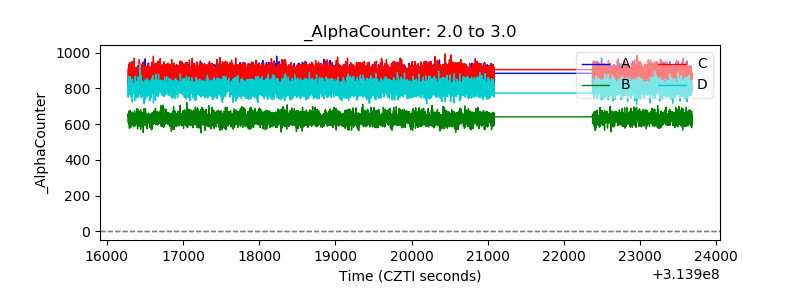 |
| _CPM_Rate | 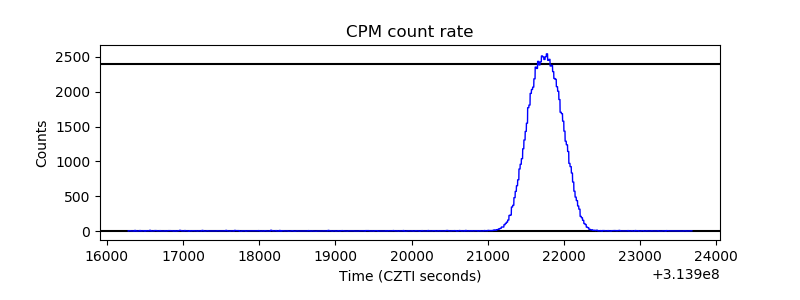 |
| CZT Counter | 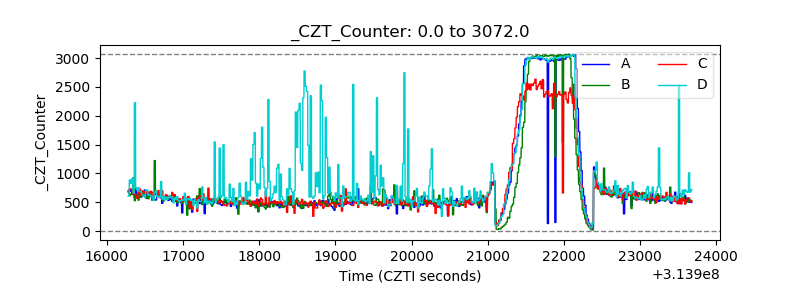 |
| +2.5 Volts monitor |  |
| +5 Volts monitor | 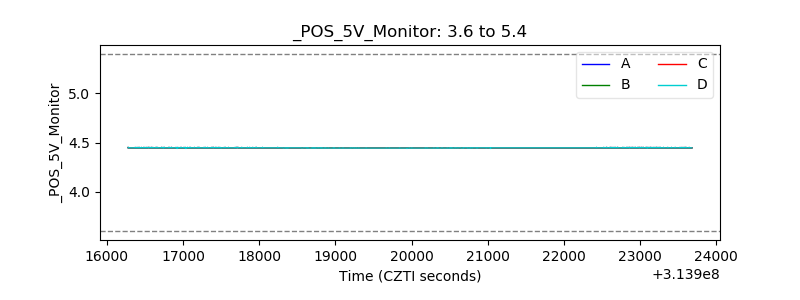 |
| _ROLL_ROT | 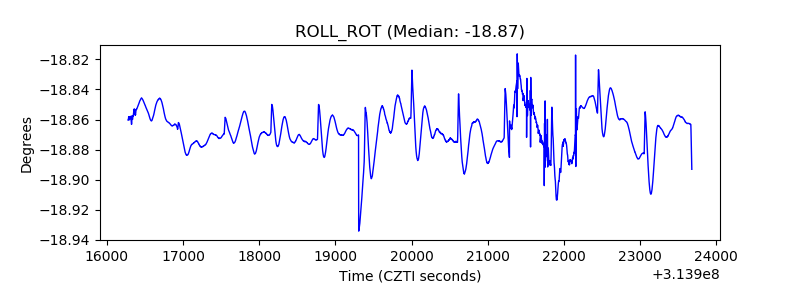 |
| _Roll_DEC |  |
| _Roll_RA | 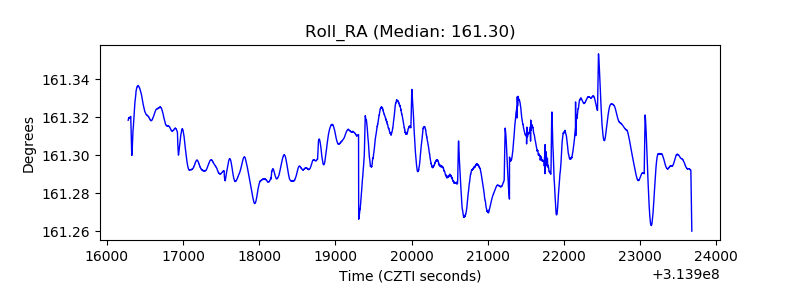 |
| Veto Counter |  |