| Param | Original file | Final file |
|---|---|---|
| Filename | modeM0/AS1A08_007T01_9000003362_22754cztM0_level2.evt | modeM0/AS1A08_007T01_9000003362_22754cztM0_level2_quad_clean.evt |
| Size (bytes) | 559,013,760 | 101,727,360 |
| Size | 533.1 MB | 97.0 MB |
| Events in quadrant A | 3,275,928 | 689,453 |
| Events in quadrant B | 3,366,273 | 696,761 |
| Events in quadrant C | 3,313,506 | 661,648 |
| Events in quadrant D | 6,567,480 | 613,422 |
| Mode SS | |||
|---|---|---|---|
| Quadrant | BADHDUFLAG | Total packets | Discarded packets |
| A | 0 | 122 | 0 |
| B | 0 | 122 | 0 |
| C | 0 | 122 | 0 |
| D | 0 | 122 | 0 |
| Mode M0 | |||
|---|---|---|---|
| Quadrant | BADHDUFLAG | Total packets | Discarded packets |
| A | 0 | 13380 | 1 |
| B | 0 | 13690 | 1 |
| C | 0 | 13574 | 1 |
| D | 0 | 23842 | 1 |
| Mode M9 | |||
|---|---|---|---|
| Quadrant | BADHDUFLAG | Total packets | Discarded packets |
| A | 0 | 13 | 0 |
| B | 0 | 13 | 0 |
| C | 0 | 13 | 0 |
| D | 0 | 13 | 0 |
| Quadrant | Total seconds | Saturated seconds | Saturation percentage |
|---|---|---|---|
| A | 6006 | 60 | 0.999001% |
| B | 6006 | 63 | 1.048951% |
| C | 6006 | 103 | 1.714952% |
| D | 6006 | 853 | 14.202464% |
Noise dominated data is calculated using 1-second bins in cleaned event files. If a bin has >2000 counts, and if more than 50% of those come from <1% of pixels, then it is considered to be noise-dominated and hence unusable.
| Quadrant | # 1 sec bins | Bins with >0 counts | Bins with >2000 counts | High rate bins dominated by noise | Noise dominated (total time) | Noise dominated (detector-on time) | Marked lightcurve |
|---|---|---|---|---|---|---|---|
| A | 7351 | 6007 | 0 | 0 | 0.00% | 0.00% | 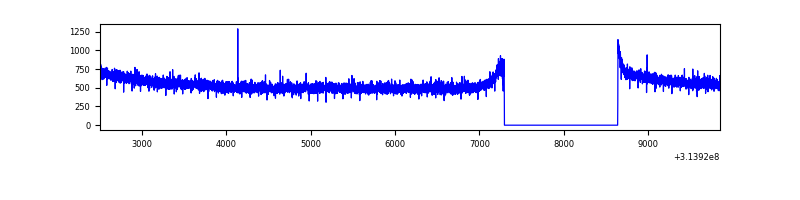 |
| B | 7351 | 6007 | 2 | 2 | 0.03% | 0.03% | 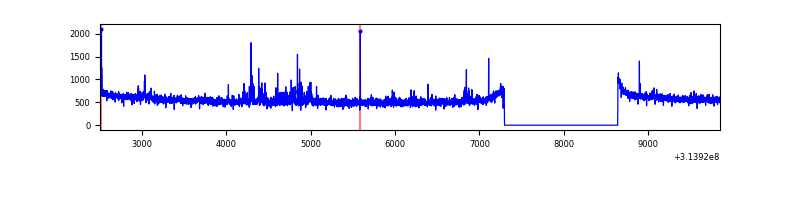 |
| C | 7351 | 6007 | 0 | 0 | 0.00% | 0.00% | 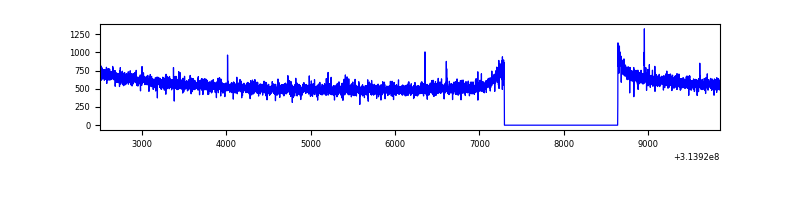 |
| D | 7351 | 6007 | 776 | 776 | 10.56% | 12.92% | 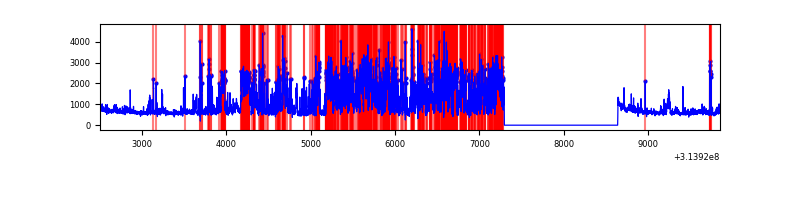 |
Top three noisy pixels from each quadrant. If the there are fewer than three noisy pixels in the level2.evt file, extra rows are filled as -1
| Pixel properties | Quadrant properties | ||||||
|---|---|---|---|---|---|---|---|
| Quadrant | DetID | PixID | Counts | Sigma | Mean | Median | Sigma |
| A | 13 | 254 | 10273 | 56.61 | 849 | 832 | 166.8 |
| A | 0 | 226 | 7490 | 39.92 | 849 | 832 | 166.8 |
| A | 12 | 194 | 6276 | 32.64 | 849 | 832 | 166.8 |
| B | 0 | 230 | 31497 | 202.83 | 832 | 816 | 151.3 |
| B | 3 | 64 | 24265 | 155.02 | 832 | 816 | 151.3 |
| B | 0 | 228 | 21785 | 138.62 | 832 | 816 | 151.3 |
| C | 14 | 238 | 129358 | 691.66 | 812 | 819 | 185.8 |
| C | 2 | 16 | 11565 | 57.82 | 812 | 819 | 185.8 |
| C | 10 | 22 | 6196 | 28.93 | 812 | 819 | 185.8 |
| D | 1 | 52 | 2946953 | 15569.11 | 793 | 773 | 189.2 |
| D | 12 | 227 | 303287 | 1598.64 | 793 | 773 | 189.2 |
| D | 13 | 172 | 130172 | 683.81 | 793 | 773 | 189.2 |
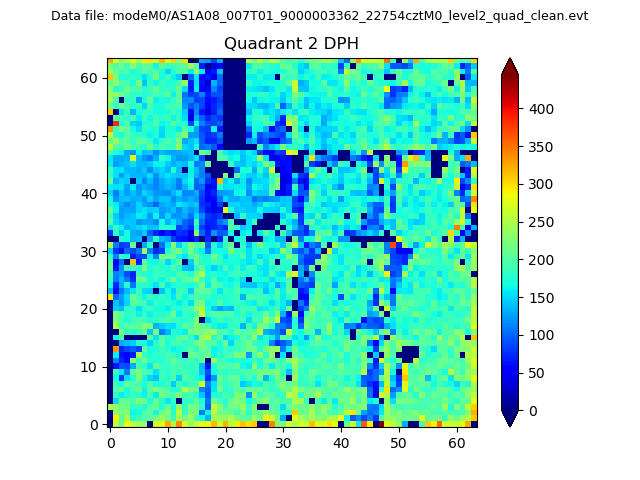
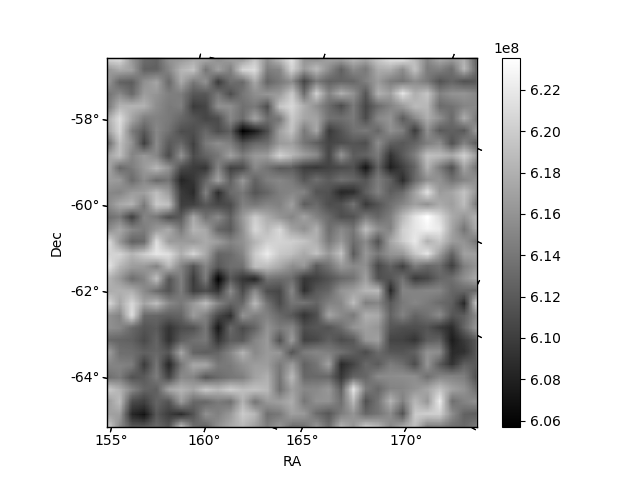
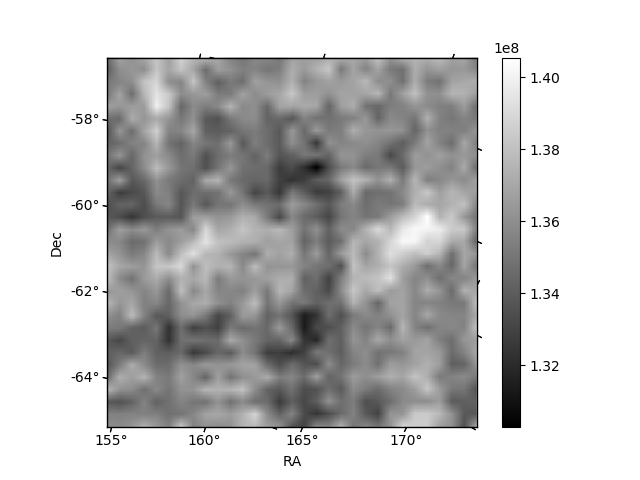
Histogram calculated using DETX and DETY for each event in the final _common_clean file
| Quadrant A | 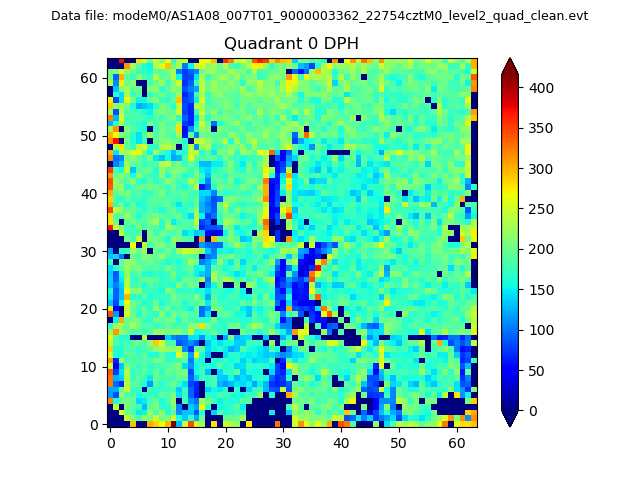 |
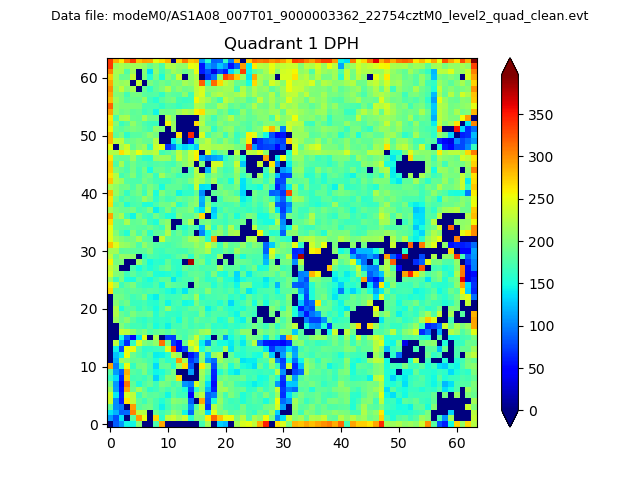 |
Quadrant B |
|---|---|---|---|
| Quadrant D | 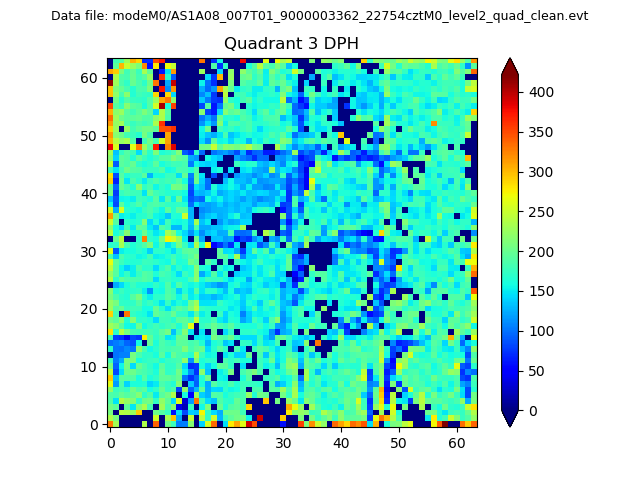 |
 |
Quadrant C |
| Plot type | Count rate plots | Images |
|---|---|---|
| Comparison with Poisson distribution Blue bars denote a histogram of data divided into 1 sec bins. Red curve is a Poisson curve with rate = median count rate of data. |
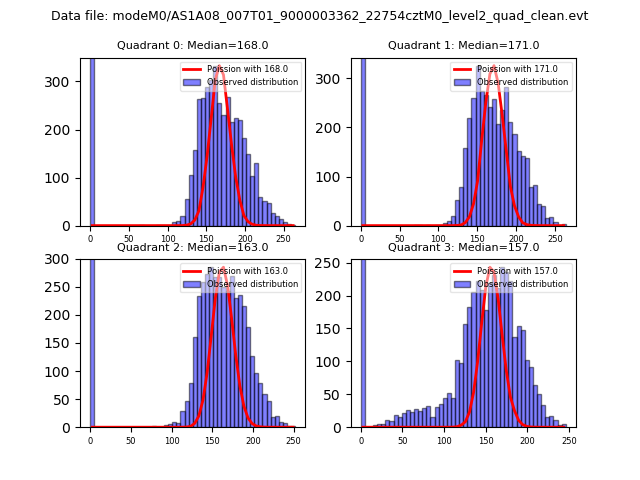 |
 |
| Quadrant-wise count rates Data is divided into 100 sec bins |
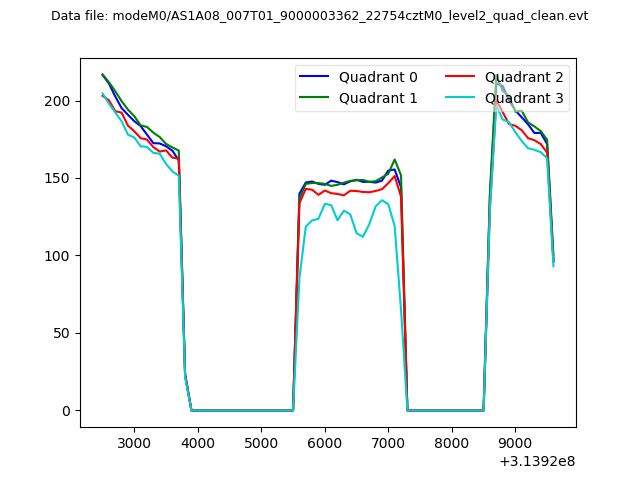 |
|
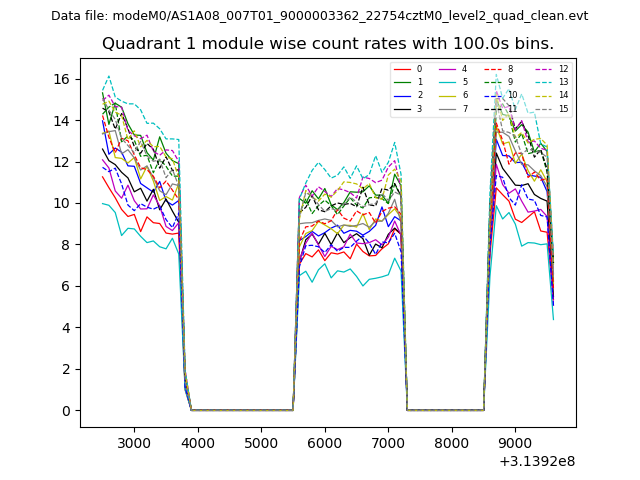
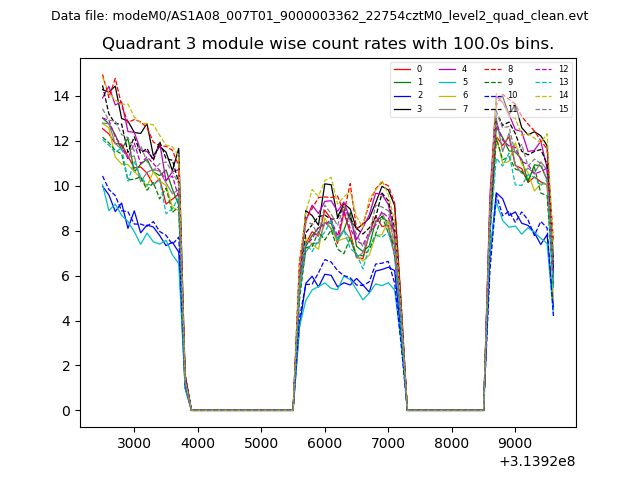
| Module-wise count rates for Quadrant A Data is divided into 100 sec bins |
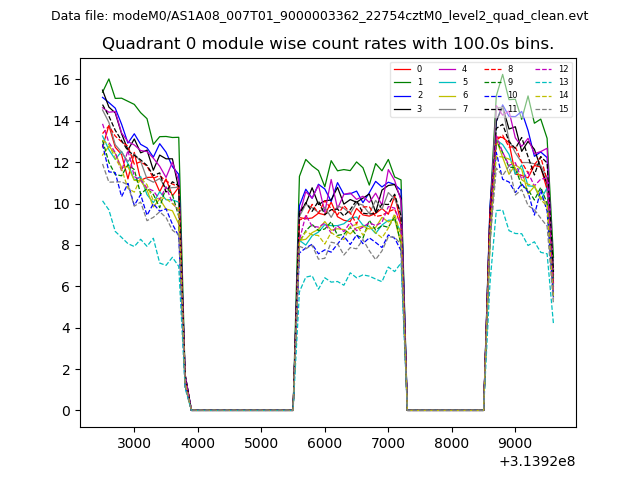 |
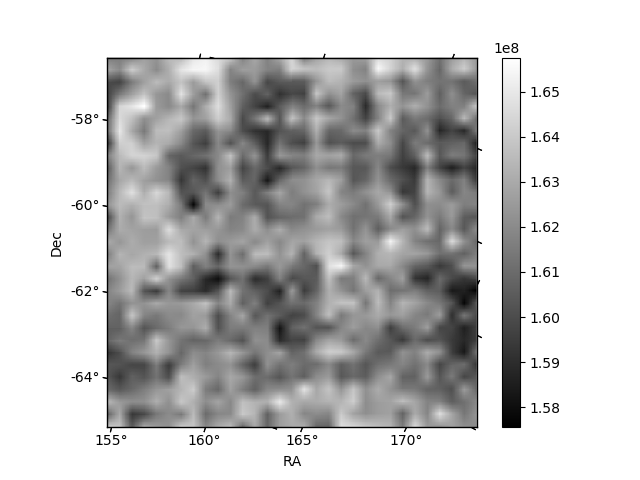 |
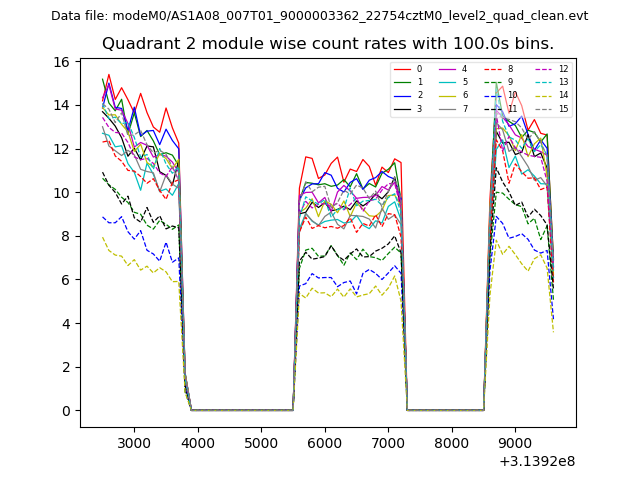
| Module-wise count rates for Quadrant B Data is divided into 100 sec bins |
 |
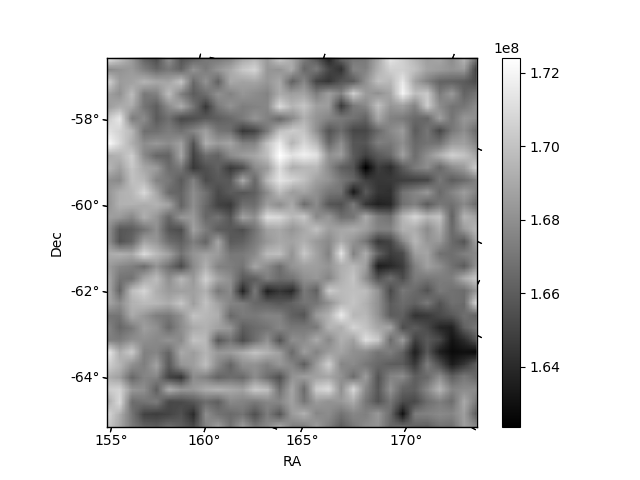 |
| Module-wise count rates for Quadrant C Data is divided into 100 sec bins |
 |
 |
| Module-wise count rates for Quadrant D Data is divided into 100 sec bins |
 |
 |
| Parameter | Plot |
|---|---|
| CZT HV Monitor | 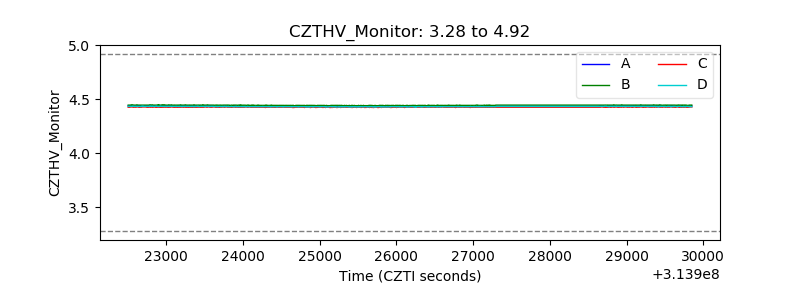 |
| D_VDD | 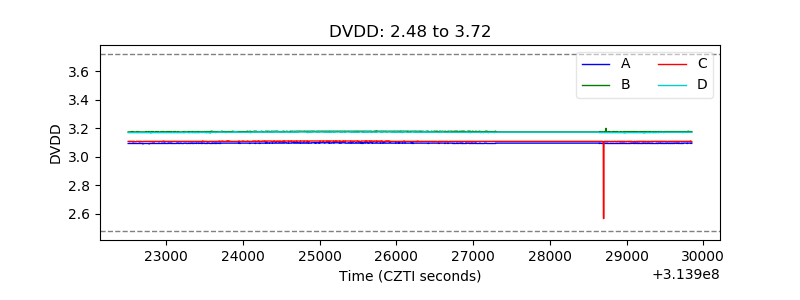 |
| Temperature 1 | 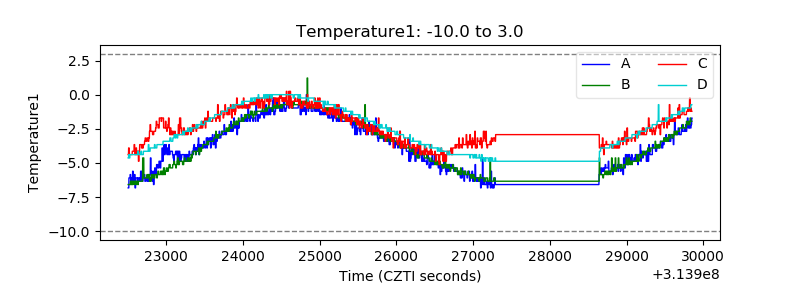 |
| Veto HV Monitor | 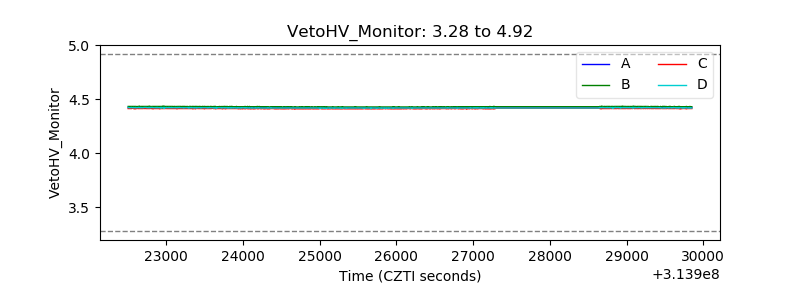 |
| Veto LLD | 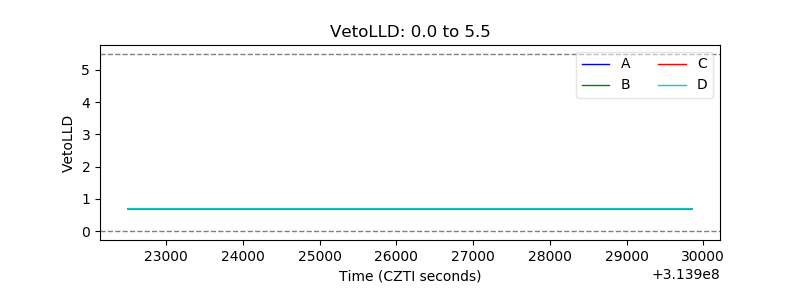 |
| Alpha Counter | 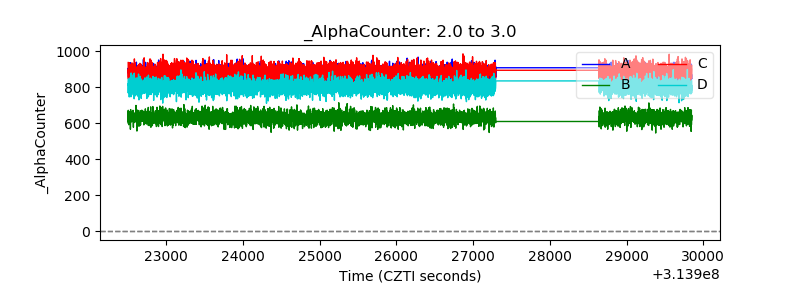 |
| _CPM_Rate | 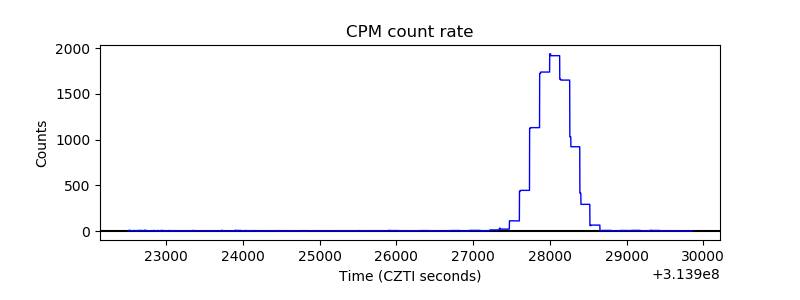 |
| CZT Counter | 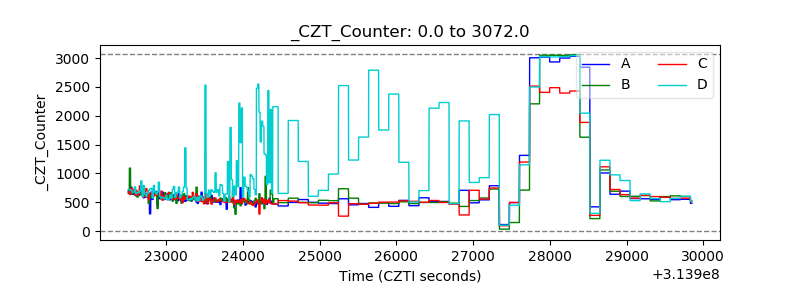 |
| +2.5 Volts monitor |  |
| +5 Volts monitor |  |
| _ROLL_ROT | 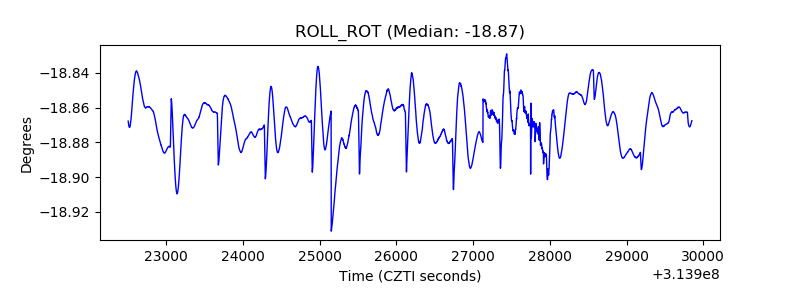 |
| _Roll_DEC | 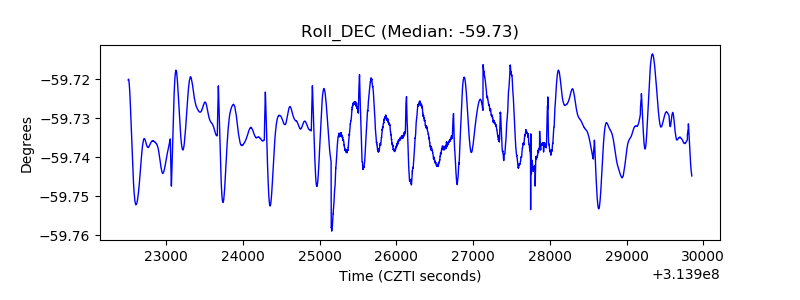 |
| _Roll_RA | 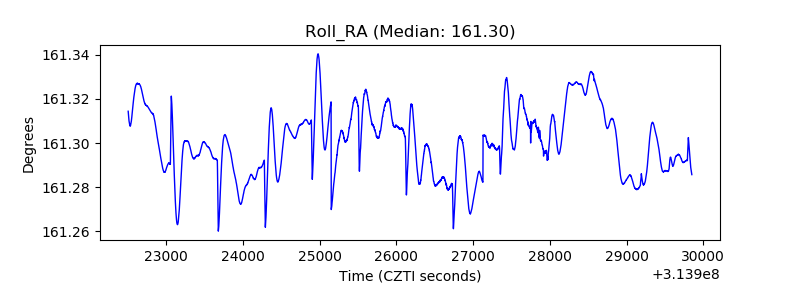 |
| Veto Counter | 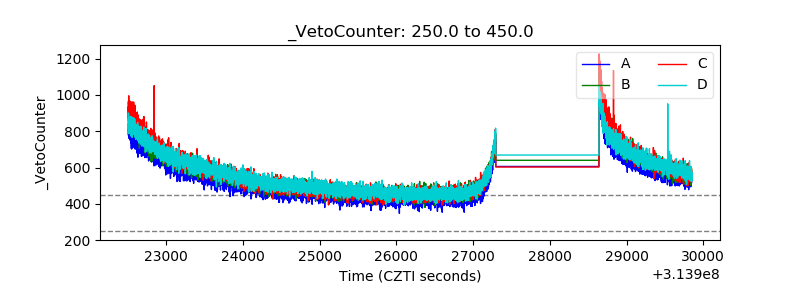 |