| Param | Original file | Final file |
|---|---|---|
| Filename | modeM0/AS1A08_007T01_9000003362_22755cztM0_level2.evt | modeM0/AS1A08_007T01_9000003362_22755cztM0_level2_quad_clean.evt |
| Size (bytes) | 600,235,200 | 92,505,600 |
| Size | 572.4 MB | 88.2 MB |
| Events in quadrant A | 3,495,985 | 609,897 |
| Events in quadrant B | 3,737,984 | 612,009 |
| Events in quadrant C | 3,511,853 | 579,059 |
| Events in quadrant D | 6,988,922 | 543,544 |
| Mode SS | |||
|---|---|---|---|
| Quadrant | BADHDUFLAG | Total packets | Discarded packets |
| A | 0 | 132 | 0 |
| B | 0 | 132 | 0 |
| C | 0 | 132 | 0 |
| D | 0 | 132 | 0 |
| Mode M0 | |||
|---|---|---|---|
| Quadrant | BADHDUFLAG | Total packets | Discarded packets |
| A | 0 | 14272 | 1 |
| B | 0 | 15079 | 1 |
| C | 0 | 14372 | 1 |
| D | 0 | 25446 | 7 |
| Mode M9 | |||
|---|---|---|---|
| Quadrant | BADHDUFLAG | Total packets | Discarded packets |
| A | 0 | 13 | 0 |
| B | 0 | 13 | 0 |
| C | 0 | 13 | 0 |
| D | 0 | 13 | 0 |
| Quadrant | Total seconds | Saturated seconds | Saturation percentage |
|---|---|---|---|
| A | 6551 | 99 | 1.511220% |
| B | 6551 | 125 | 1.908106% |
| C | 6552 | 147 | 2.243590% |
| D | 6551 | 957 | 14.608457% |
Noise dominated data is calculated using 1-second bins in cleaned event files. If a bin has >2000 counts, and if more than 50% of those come from <1% of pixels, then it is considered to be noise-dominated and hence unusable.
| Quadrant | # 1 sec bins | Bins with >0 counts | Bins with >2000 counts | High rate bins dominated by noise | Noise dominated (total time) | Noise dominated (detector-on time) | Marked lightcurve |
|---|---|---|---|---|---|---|---|
| A | 7851 | 6552 | 0 | 0 | 0.00% | 0.00% | 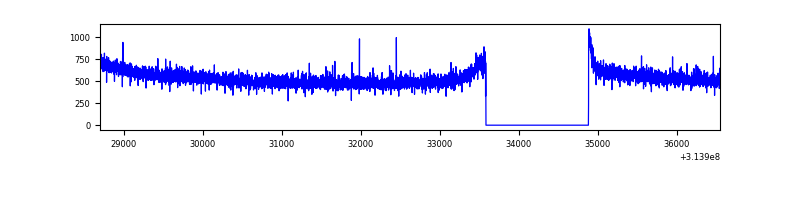 |
| B | 7851 | 6552 | 16 | 16 | 0.20% | 0.24% | 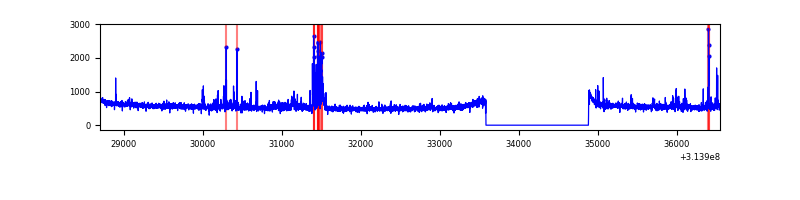 |
| C | 7852 | 6553 | 2 | 2 | 0.03% | 0.03% | 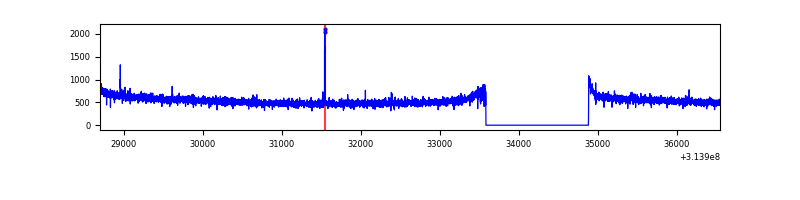 |
| D | 7851 | 6552 | 811 | 811 | 10.33% | 12.38% | 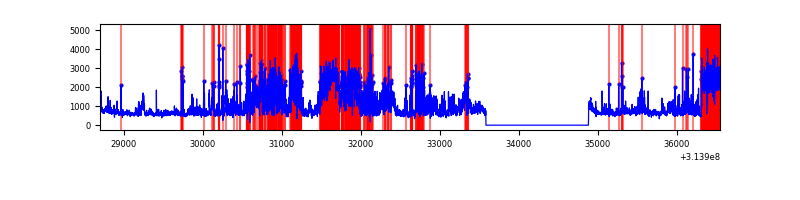 |
Top three noisy pixels from each quadrant. If the there are fewer than three noisy pixels in the level2.evt file, extra rows are filled as -1
| Pixel properties | Quadrant properties | ||||||
|---|---|---|---|---|---|---|---|
| Quadrant | DetID | PixID | Counts | Sigma | Mean | Median | Sigma |
| A | 13 | 254 | 11289 | 58.68 | 907 | 892 | 177.2 |
| A | 0 | 226 | 8164 | 41.04 | 907 | 892 | 177.2 |
| A | 3 | 137 | 6560 | 31.99 | 907 | 892 | 177.2 |
| B | 7 | 219 | 94276 | 578.43 | 889 | 873 | 161.5 |
| B | 0 | 228 | 61452 | 375.16 | 889 | 873 | 161.5 |
| B | 0 | 190 | 24415 | 145.79 | 889 | 873 | 161.5 |
| C | 14 | 238 | 140270 | 713.03 | 861 | 868 | 195.5 |
| C | 2 | 16 | 11658 | 55.19 | 861 | 868 | 195.5 |
| C | 13 | 61 | 6068 | 26.6 | 861 | 868 | 195.5 |
| D | 1 | 52 | 2988440 | 14869.7 | 838 | 815 | 200.9 |
| D | 2 | 152 | 261960 | 1299.74 | 838 | 815 | 200.9 |
| D | 10 | 230 | 232266 | 1151.95 | 838 | 815 | 200.9 |
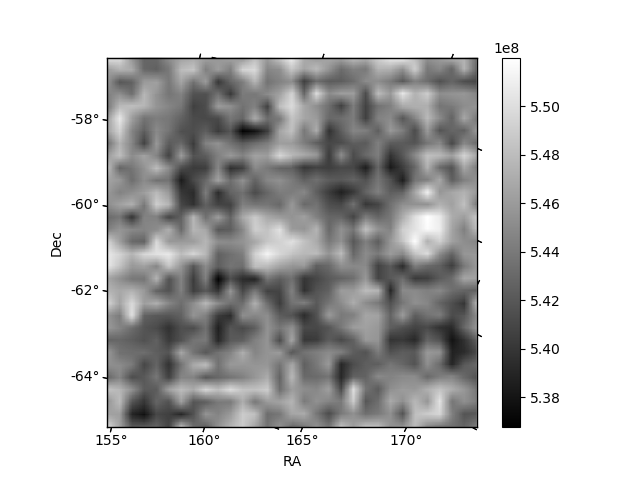
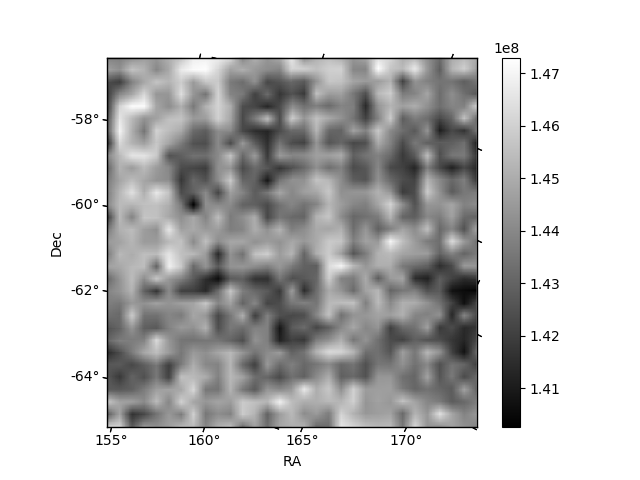
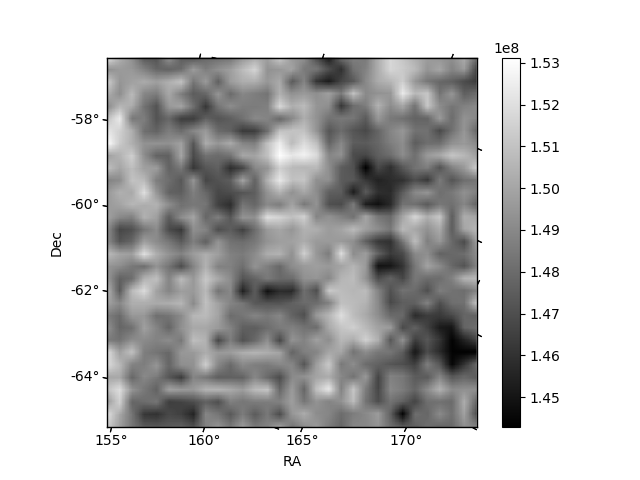
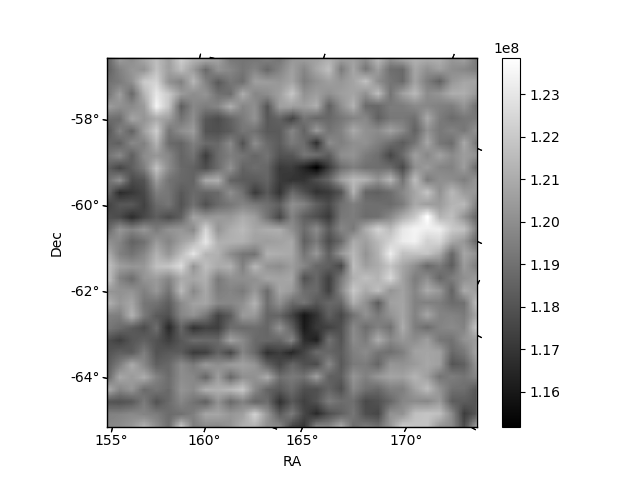
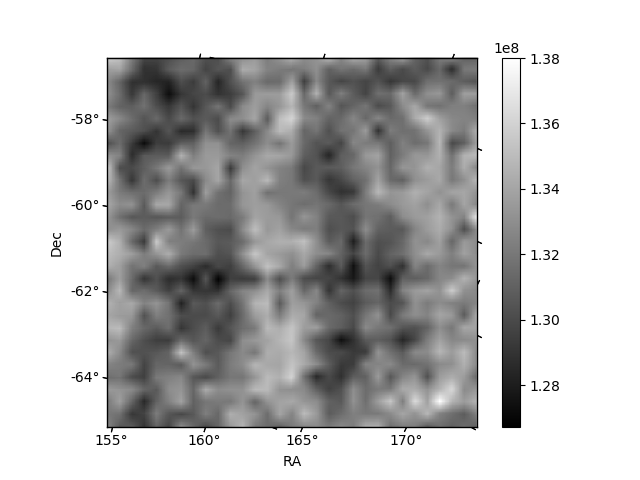
Histogram calculated using DETX and DETY for each event in the final _common_clean file
| Quadrant A | 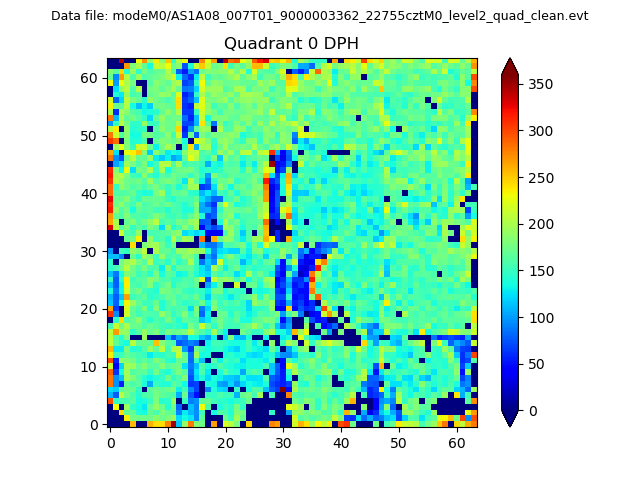 |
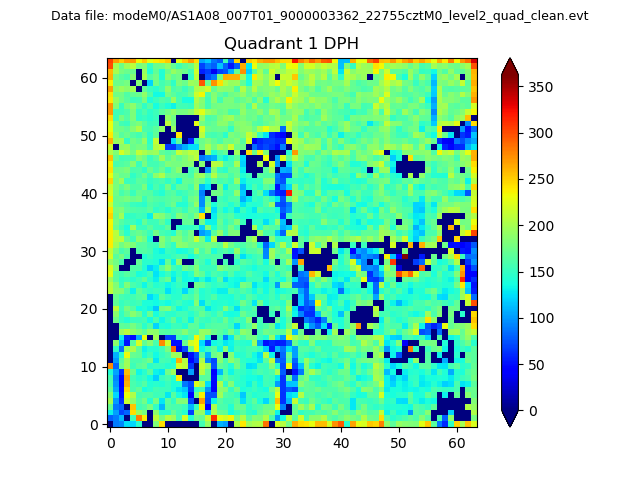 |
Quadrant B |
|---|---|---|---|
| Quadrant D | 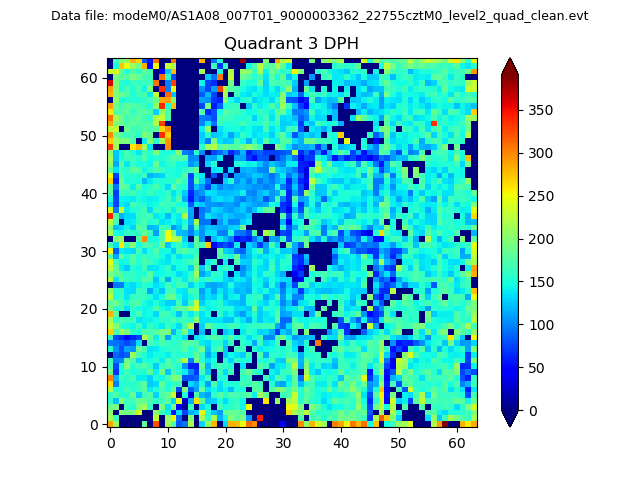 |
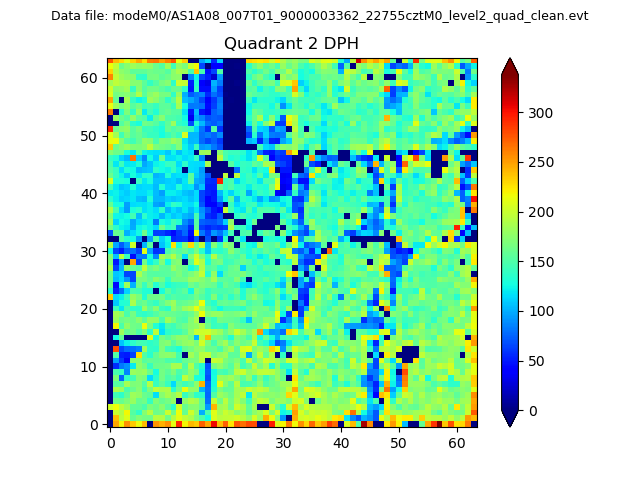 |
Quadrant C |
| Plot type | Count rate plots | Images |
|---|---|---|
| Comparison with Poisson distribution Blue bars denote a histogram of data divided into 1 sec bins. Red curve is a Poisson curve with rate = median count rate of data. |
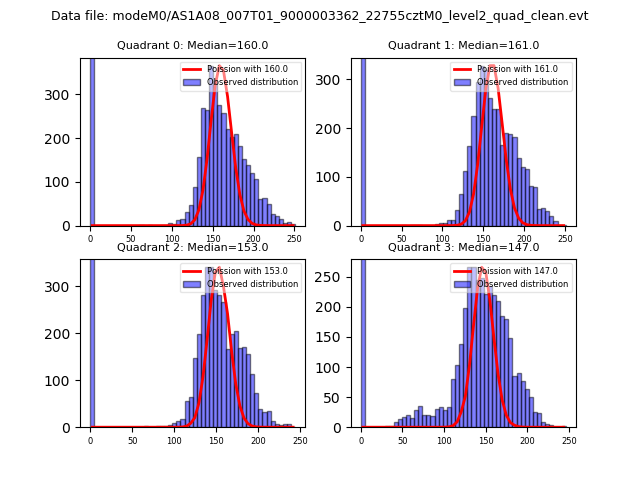 |
 |
| Quadrant-wise count rates Data is divided into 100 sec bins |
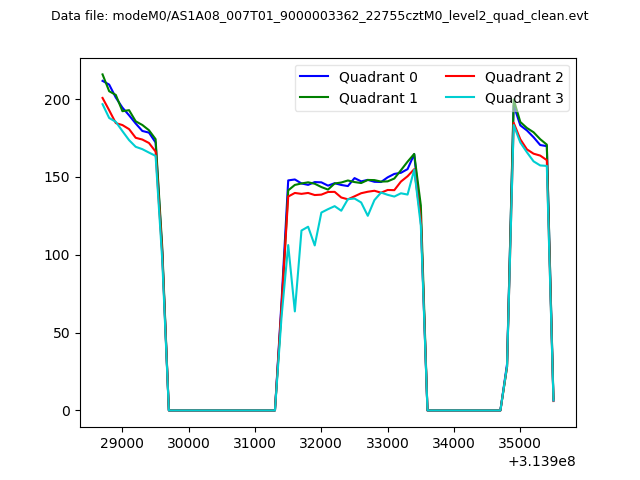 |
|
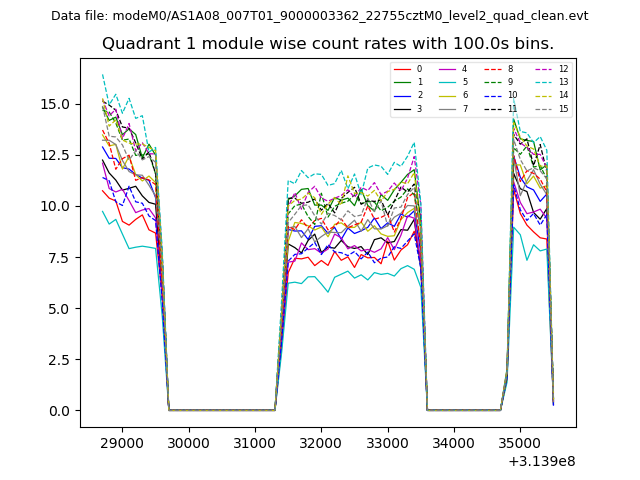
| Module-wise count rates for Quadrant A Data is divided into 100 sec bins |
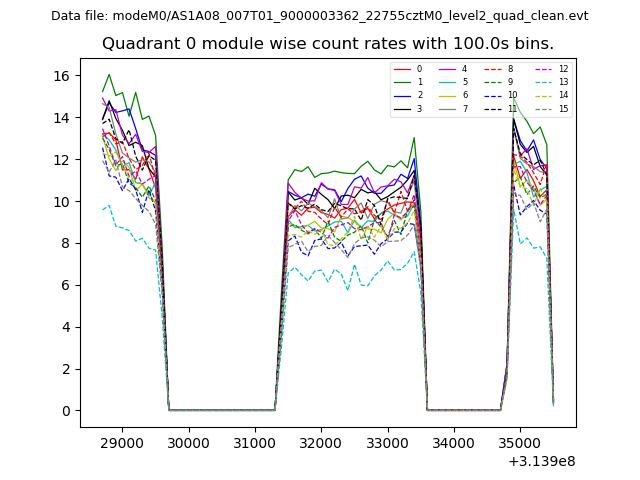 |
 |
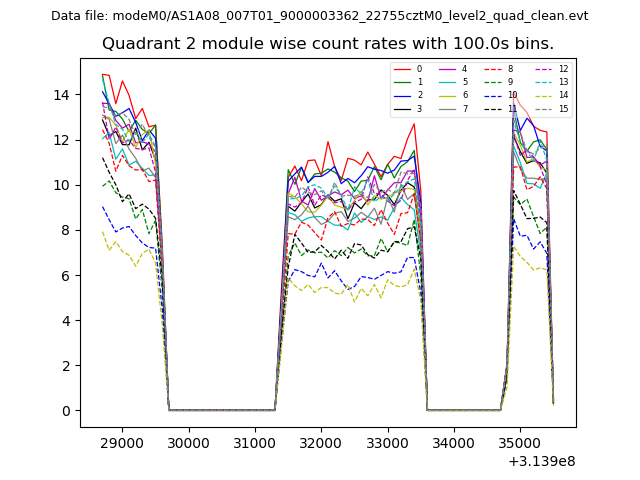
| Module-wise count rates for Quadrant B Data is divided into 100 sec bins |
 |
 |
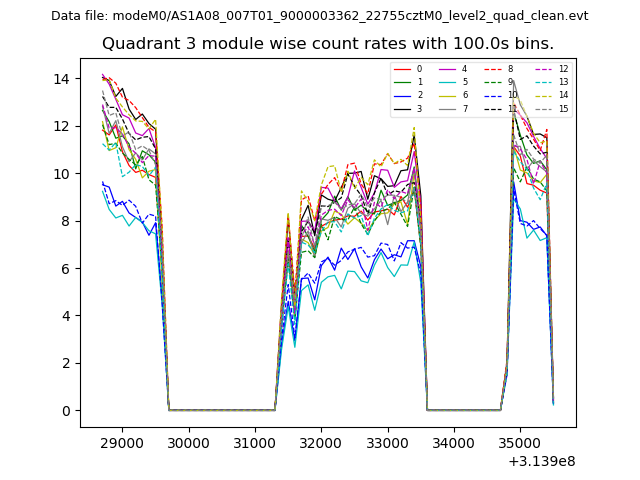
| Module-wise count rates for Quadrant C Data is divided into 100 sec bins |
 |
 |
| Module-wise count rates for Quadrant D Data is divided into 100 sec bins |
 |
 |
| Parameter | Plot |
|---|---|
| CZT HV Monitor | 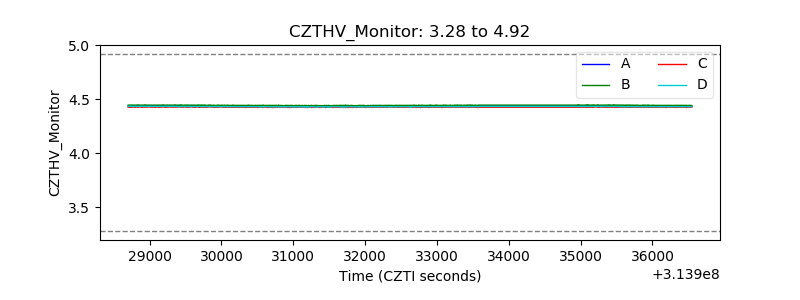 |
| D_VDD | 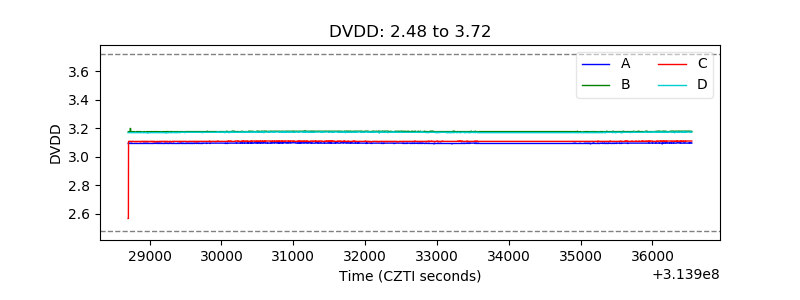 |
| Temperature 1 |  |
| Veto HV Monitor | 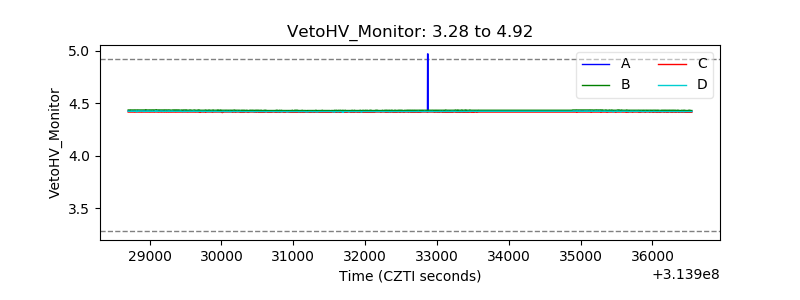 |
| Veto LLD | 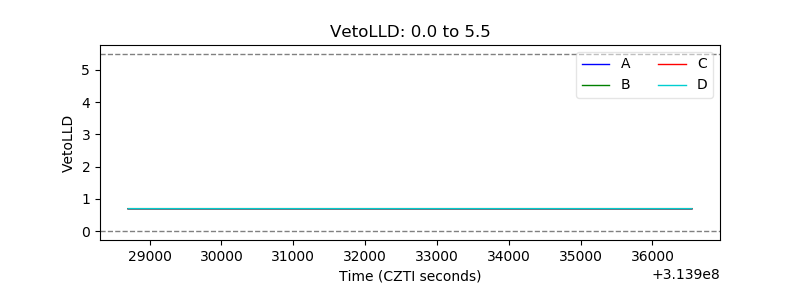 |
| Alpha Counter | 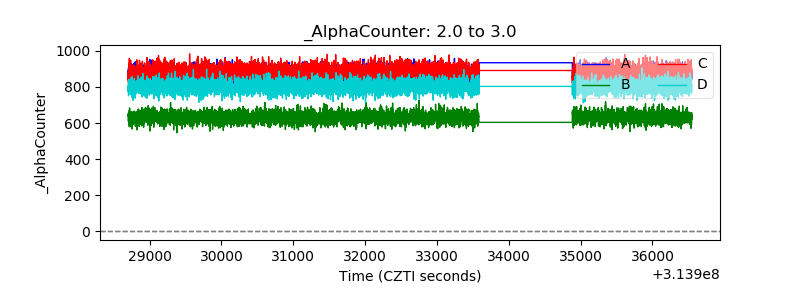 |
| _CPM_Rate | 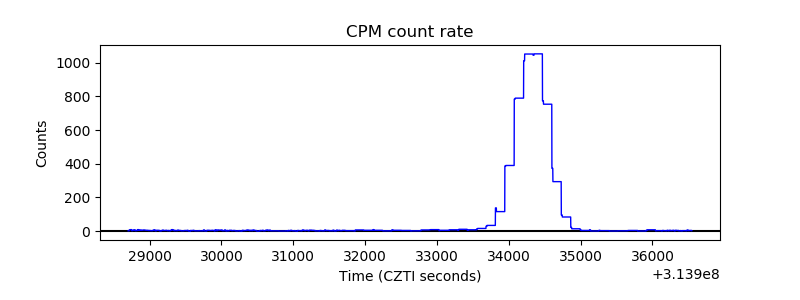 |
| CZT Counter | 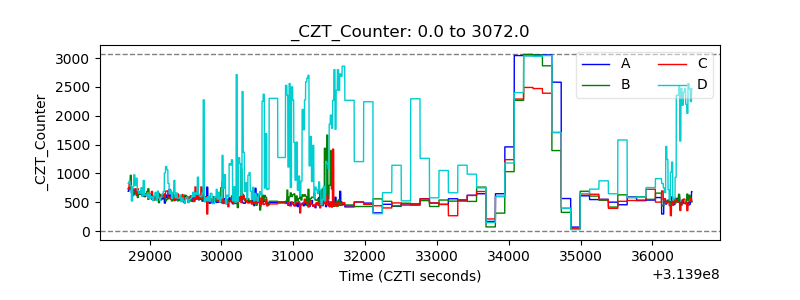 |
| +2.5 Volts monitor |  |
| +5 Volts monitor |  |
| _ROLL_ROT | 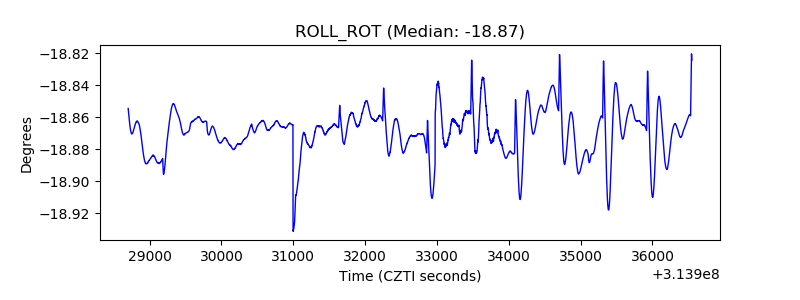 |
| _Roll_DEC | 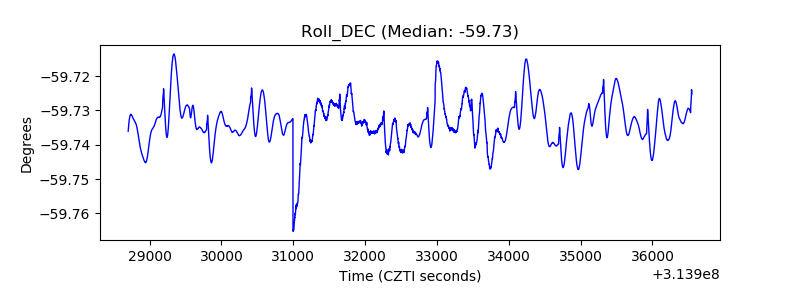 |
| _Roll_RA | 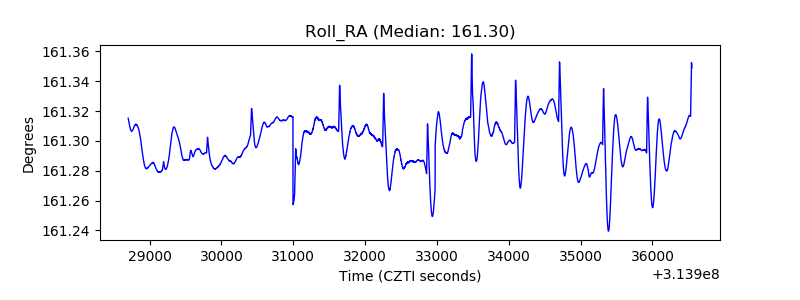 |
| Veto Counter | 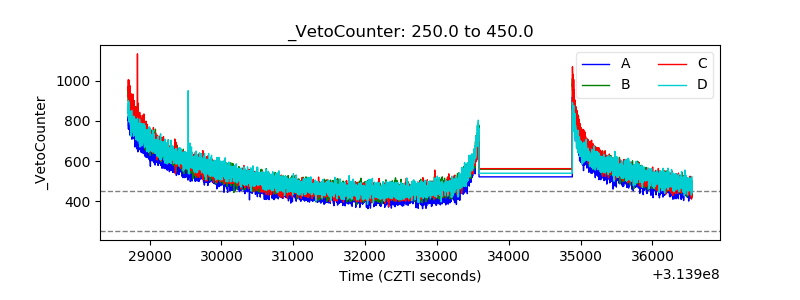 |