| Param | Original file | Final file |
|---|---|---|
| Filename | modeM0/AS1A08_007T01_9000003362_22756cztM0_level2.evt | modeM0/AS1A08_007T01_9000003362_22756cztM0_level2_quad_clean.evt |
| Size (bytes) | 260,138,880 | 32,385,600 |
| Size | 248.1 MB | 30.9 MB |
| Events in quadrant A | 1,555,989 | 198,255 |
| Events in quadrant B | 1,642,992 | 199,078 |
| Events in quadrant C | 1,541,161 | 189,375 |
| Events in quadrant D | 2,928,695 | 175,481 |
| Mode SS | |||
|---|---|---|---|
| Quadrant | BADHDUFLAG | Total packets | Discarded packets |
| A | 0 | 62 | 0 |
| B | 0 | 62 | 0 |
| C | 0 | 62 | 0 |
| D | 0 | 62 | 0 |
| Mode M0 | |||
|---|---|---|---|
| Quadrant | BADHDUFLAG | Total packets | Discarded packets |
| A | 0 | 6426 | 1 |
| B | 0 | 6676 | 1 |
| C | 0 | 6452 | 1 |
| D | 0 | 10880 | 1 |
| Quadrant | Total seconds | Saturated seconds | Saturation percentage |
|---|---|---|---|
| A | 3057 | 2 | 0.065424% |
| B | 3058 | 8 | 0.261609% |
| C | 3058 | 16 | 0.523218% |
| D | 3058 | 472 | 15.434925% |
Noise dominated data is calculated using 1-second bins in cleaned event files. If a bin has >2000 counts, and if more than 50% of those come from <1% of pixels, then it is considered to be noise-dominated and hence unusable.
| Quadrant | # 1 sec bins | Bins with >0 counts | Bins with >2000 counts | High rate bins dominated by noise | Noise dominated (total time) | Noise dominated (detector-on time) | Marked lightcurve |
|---|---|---|---|---|---|---|---|
| A | 3057 | 3057 | 0 | 0 | 0.00% | 0.00% |  |
| B | 3058 | 3058 | 3 | 3 | 0.10% | 0.10% |  |
| C | 3058 | 3058 | 0 | 0 | 0.00% | 0.00% |  |
| D | 3058 | 3058 | 382 | 382 | 12.49% | 12.49% |  |
Top three noisy pixels from each quadrant. If the there are fewer than three noisy pixels in the level2.evt file, extra rows are filled as -1
| Pixel properties | Quadrant properties | ||||||
|---|---|---|---|---|---|---|---|
| Quadrant | DetID | PixID | Counts | Sigma | Mean | Median | Sigma |
| A | 13 | 254 | 4859 | 55.93 | 403 | 397 | 79.8 |
| A | 0 | 226 | 3512 | 39.05 | 403 | 397 | 79.8 |
| A | 3 | 137 | 2916 | 31.58 | 403 | 397 | 79.8 |
| B | 0 | 197 | 26725 | 358.68 | 394 | 386 | 73.4 |
| B | 0 | 228 | 26411 | 354.4 | 394 | 386 | 73.4 |
| B | 0 | 190 | 13682 | 181.06 | 394 | 386 | 73.4 |
| C | 14 | 238 | 63196 | 710.9 | 379 | 381 | 88.4 |
| C | 13 | 61 | 2694 | 26.18 | 379 | 381 | 88.4 |
| C | 3 | 202 | 939 | 6.32 | 379 | 381 | 88.4 |
| D | 1 | 52 | 1394586 | 16041.41 | 360 | 350 | 86.9 |
| D | 2 | 152 | 91803 | 1052.21 | 360 | 350 | 86.9 |
| D | 12 | 233 | 24980 | 283.38 | 360 | 350 | 86.9 |
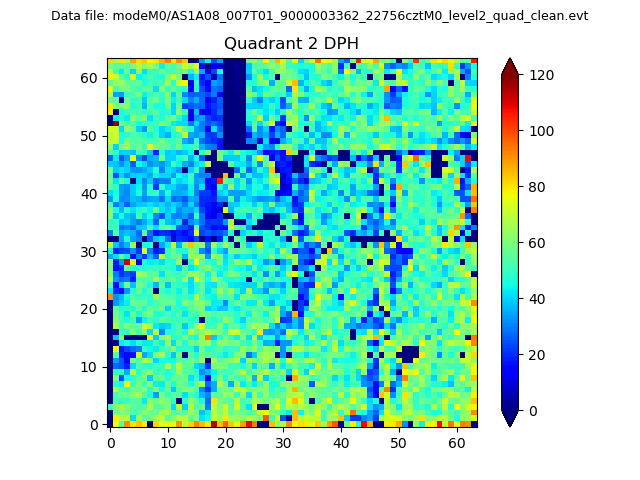
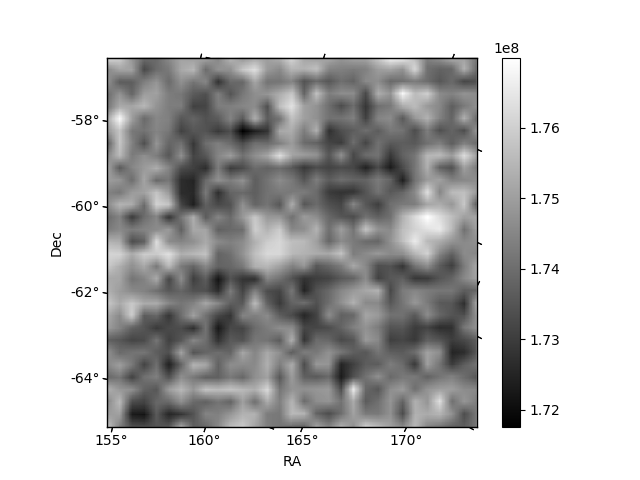
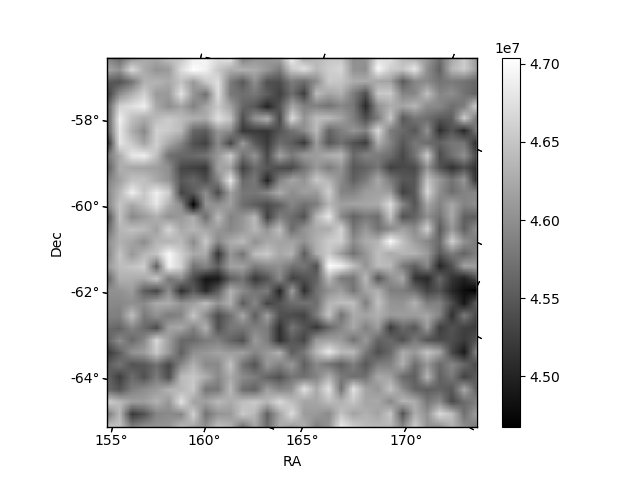
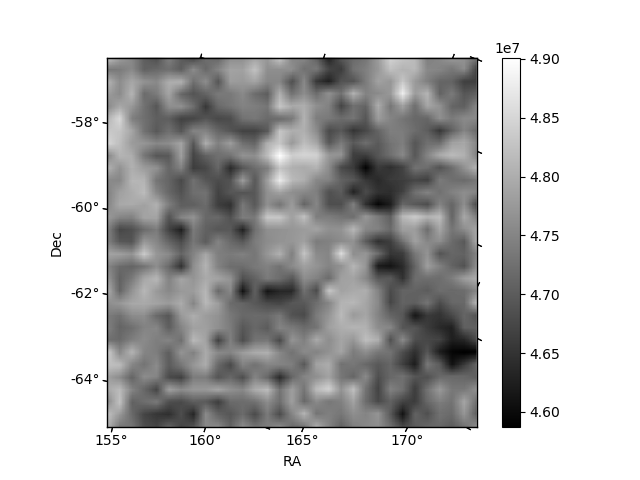
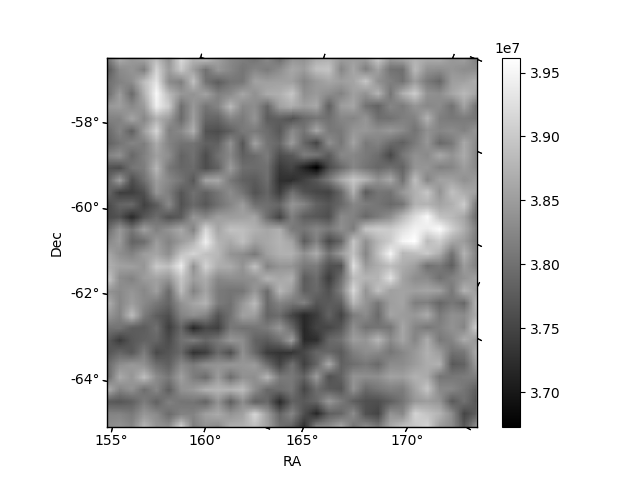
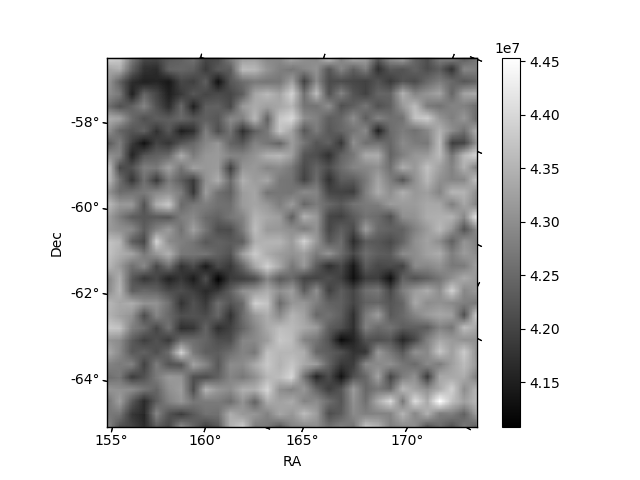
Histogram calculated using DETX and DETY for each event in the final _common_clean file
| Quadrant A | 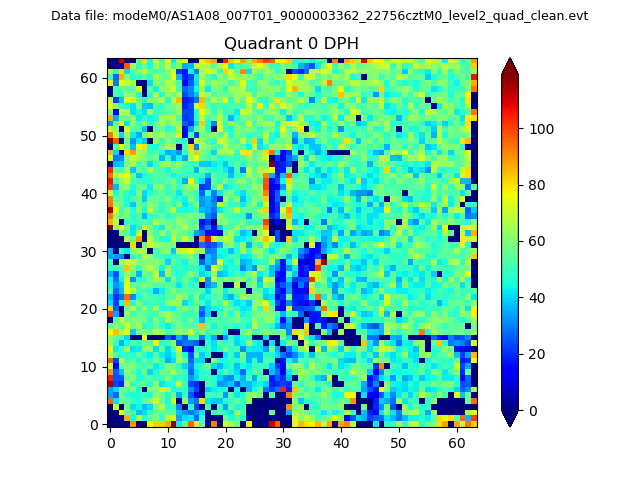 |
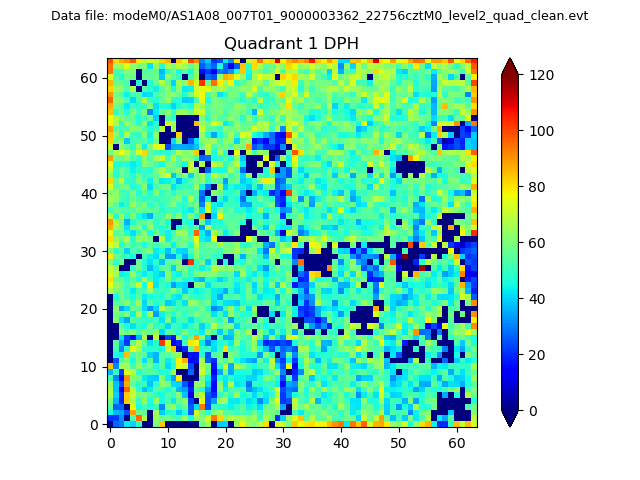 |
Quadrant B |
|---|---|---|---|
| Quadrant D | 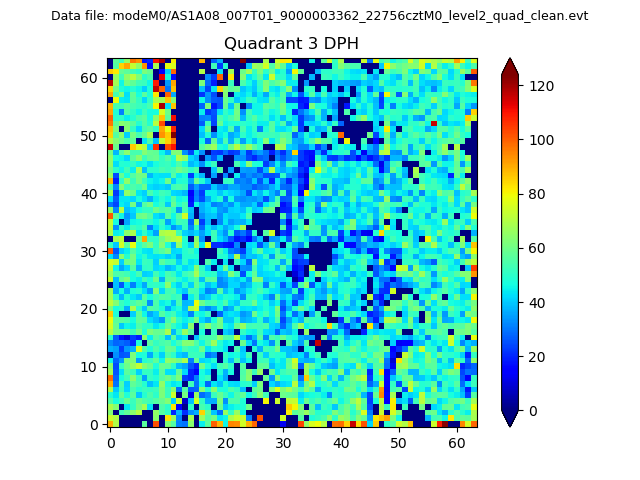 |
 |
Quadrant C |
| Plot type | Count rate plots | Images |
|---|---|---|
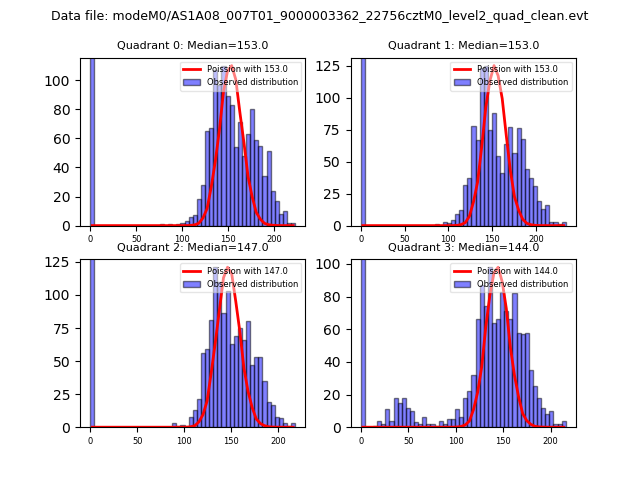
| Comparison with Poisson distribution Blue bars denote a histogram of data divided into 1 sec bins. Red curve is a Poisson curve with rate = median count rate of data. |
 |
 |
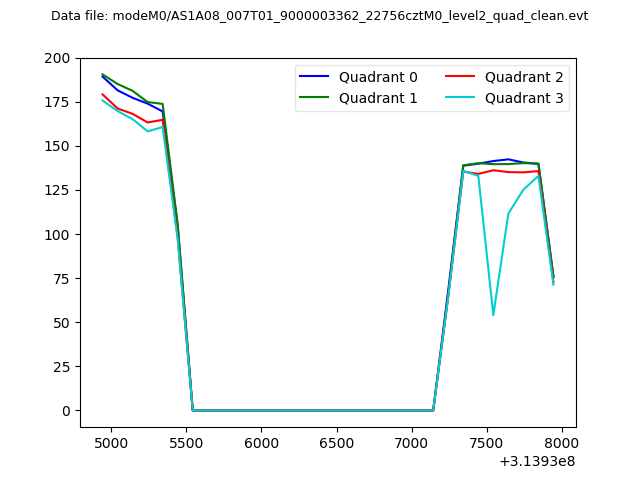
| Quadrant-wise count rates Data is divided into 100 sec bins |
 |
|
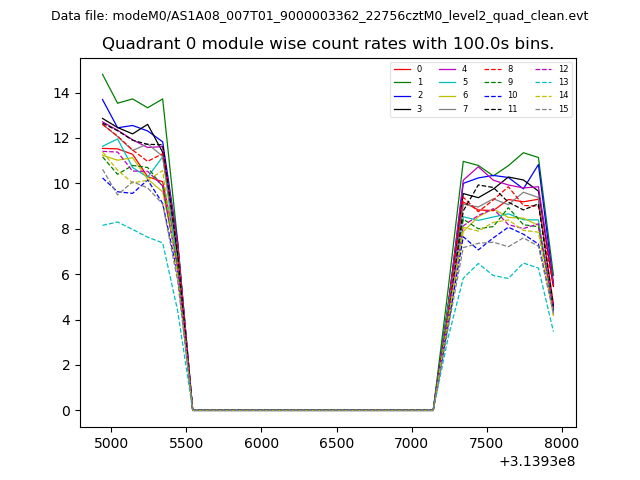
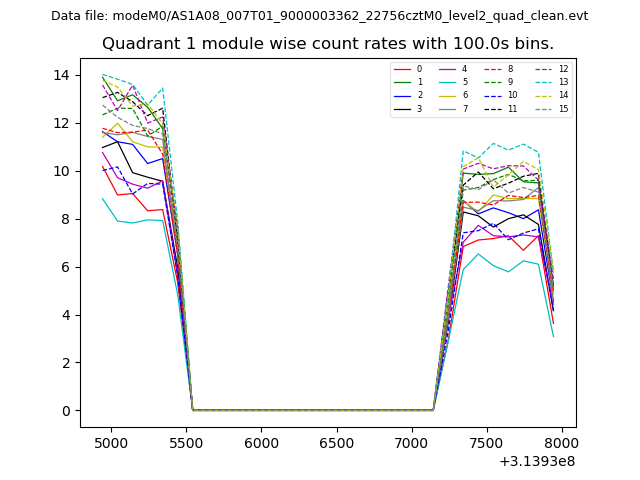
| Module-wise count rates for Quadrant A Data is divided into 100 sec bins |
 |
 |
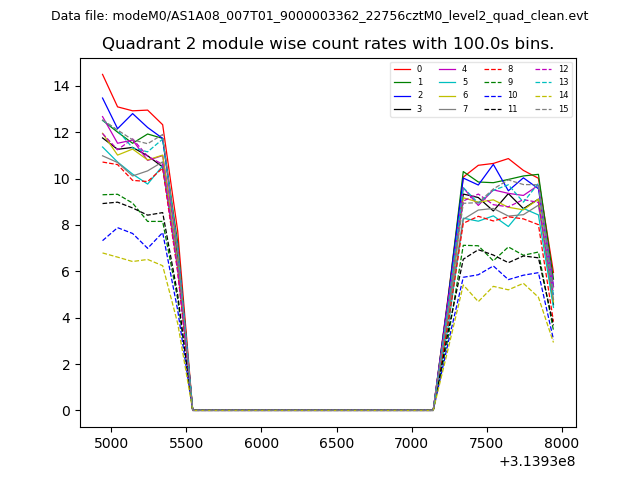
| Module-wise count rates for Quadrant B Data is divided into 100 sec bins |
 |
 |
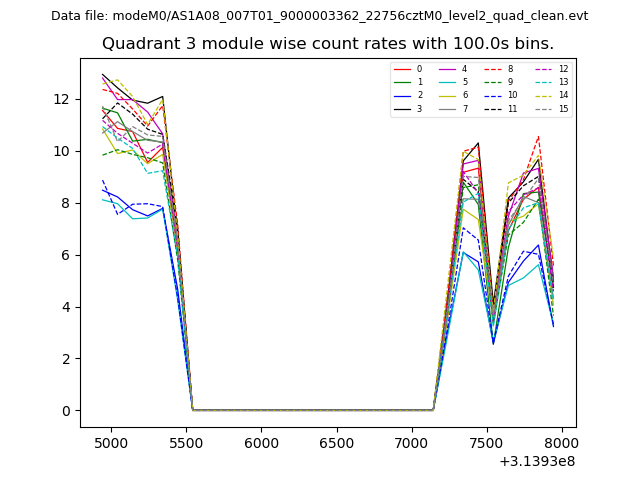
| Module-wise count rates for Quadrant C Data is divided into 100 sec bins |
 |
 |
| Module-wise count rates for Quadrant D Data is divided into 100 sec bins |
 |
 |
| Parameter | Plot |
|---|---|
| CZT HV Monitor | 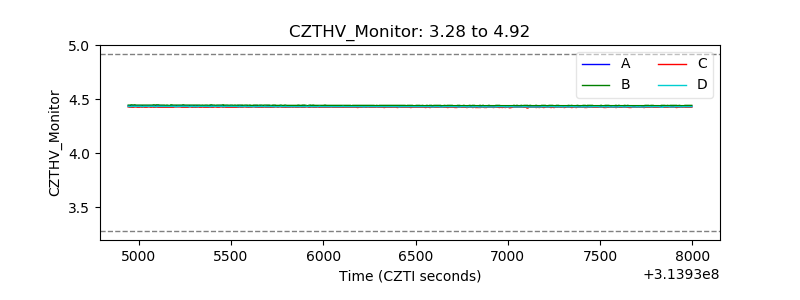 |
| D_VDD | 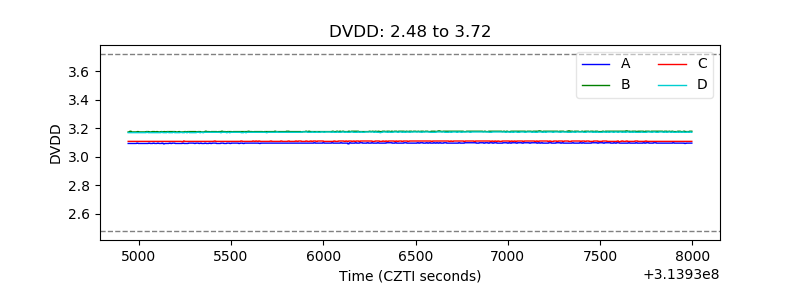 |
| Temperature 1 | 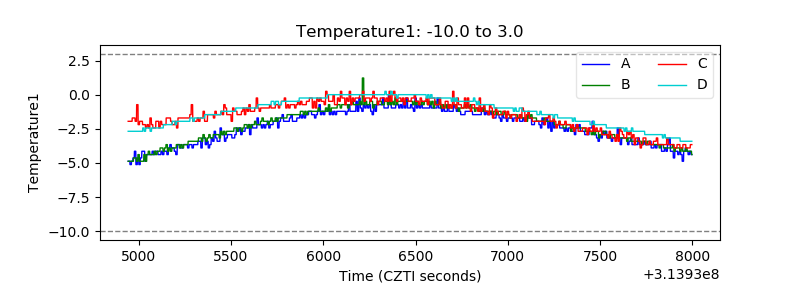 |
| Veto HV Monitor | 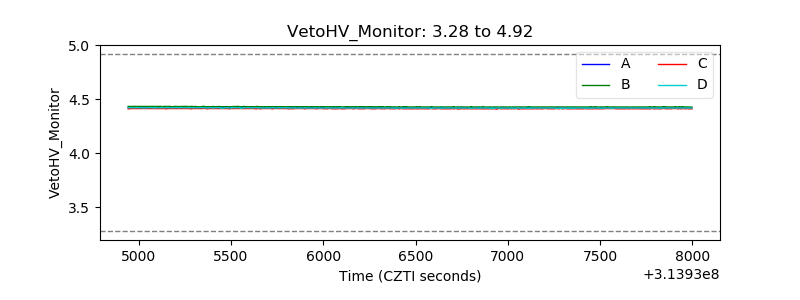 |
| Veto LLD | 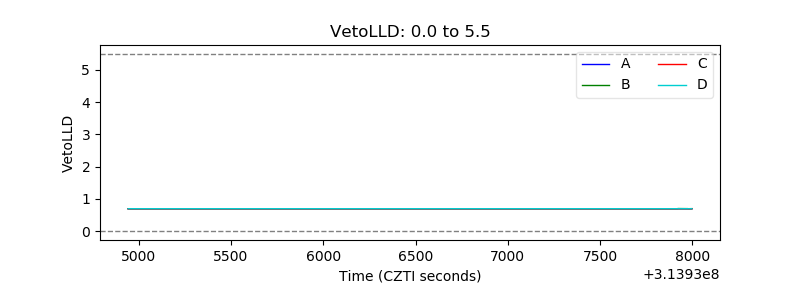 |
| Alpha Counter | 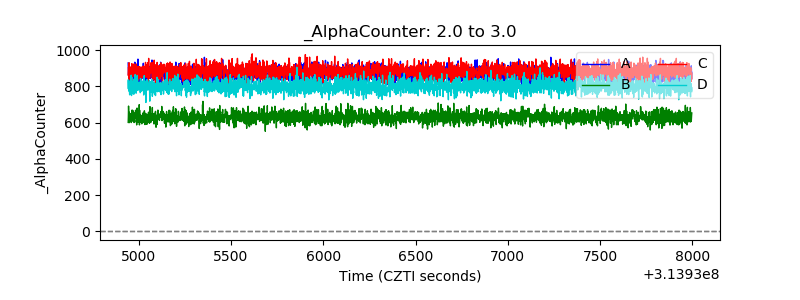 |
| _CPM_Rate | 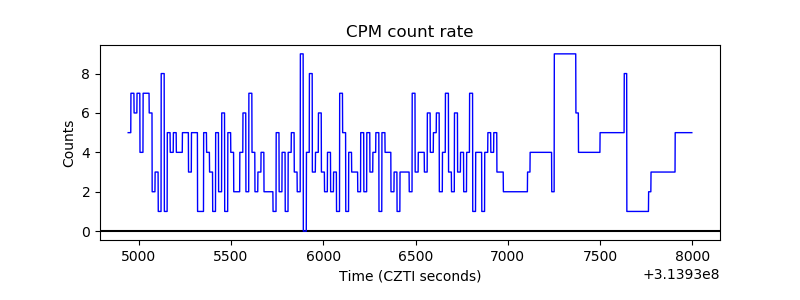 |
| CZT Counter | 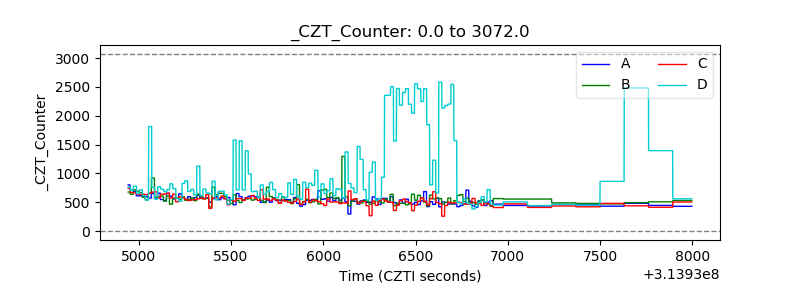 |
| +2.5 Volts monitor |  |
| +5 Volts monitor |  |
| _ROLL_ROT | 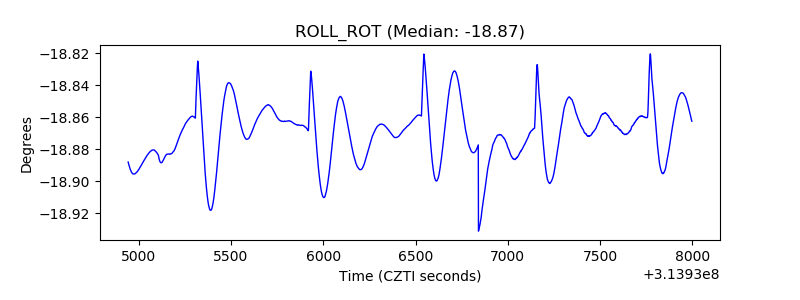 |
| _Roll_DEC | 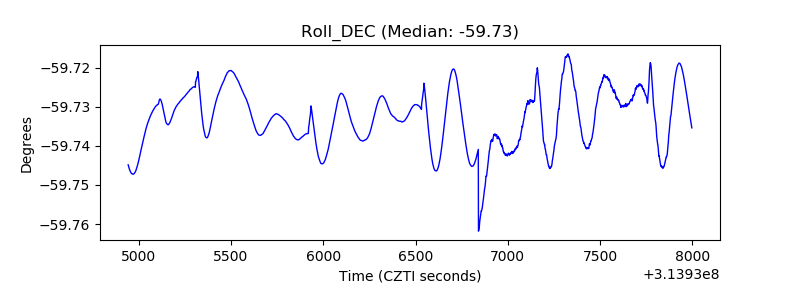 |
| _Roll_RA | 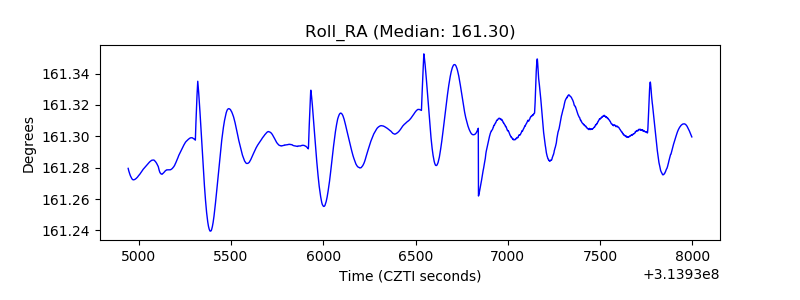 |
| Veto Counter | 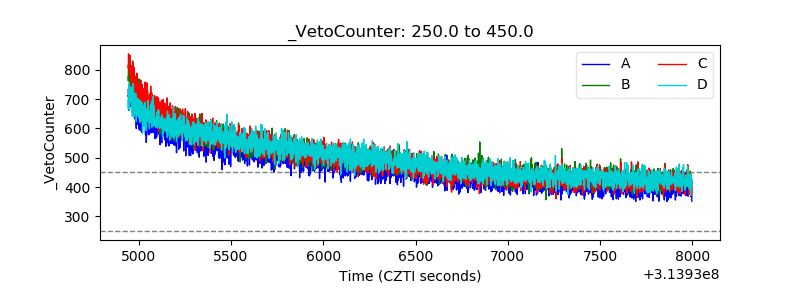 |