| Param | Original file | Final file |
|---|---|---|
| Filename | modeM0/AS1A08_007T01_9000003362_22855cztM0_level2.evt | modeM0/AS1A08_007T01_9000003362_22855cztM0_level2_quad_clean.evt |
| Size (bytes) | 10,324,800 | 3,542,400 |
| Size | 9.8 MB | 3.4 MB |
| Events in quadrant A | 77,645 | 23,460 |
| Events in quadrant B | 71,411 | 22,227 |
| Events in quadrant C | 71,635 | 21,723 |
| Events in quadrant D | 77,919 | 20,307 |
| Mode SS | |||
|---|---|---|---|
| Quadrant | BADHDUFLAG | Total packets | Discarded packets |
| A | 0 | 7 | 5 |
| B | 0 | 8 | 4 |
| C | 0 | 8 | 6 |
| D | 0 | 8 | 4 |
| Mode M0 | |||
|---|---|---|---|
| Quadrant | BADHDUFLAG | Total packets | Discarded packets |
| A | 0 | 731 | 411 |
| B | 0 | 744 | 448 |
| C | 0 | 724 | 414 |
| D | 0 | 863 | 538 |
| Quadrant | Total seconds | Saturated seconds | Saturation percentage |
|---|---|---|---|
| A | 160 | 1 | 0.625000% |
| B | 147 | 0 | 0.000000% |
| C | 154 | 0 | 0.000000% |
| D | 146 | 0 | 0.000000% |
Noise dominated data is calculated using 1-second bins in cleaned event files. If a bin has >2000 counts, and if more than 50% of those come from <1% of pixels, then it is considered to be noise-dominated and hence unusable.
| Quadrant | # 1 sec bins | Bins with >0 counts | Bins with >2000 counts | High rate bins dominated by noise | Noise dominated (total time) | Noise dominated (detector-on time) | Marked lightcurve |
|---|---|---|---|---|---|---|---|
| A | 268 | 199 | 0 | 0 | 0.00% | 0.00% | 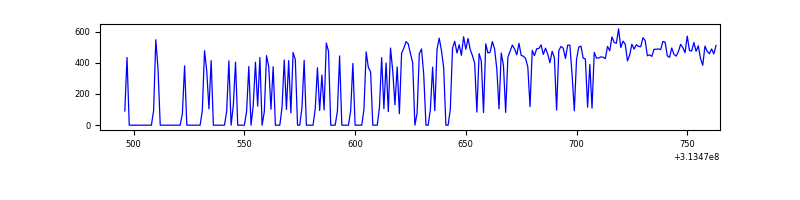 |
| B | 259 | 180 | 0 | 0 | 0.00% | 0.00% | 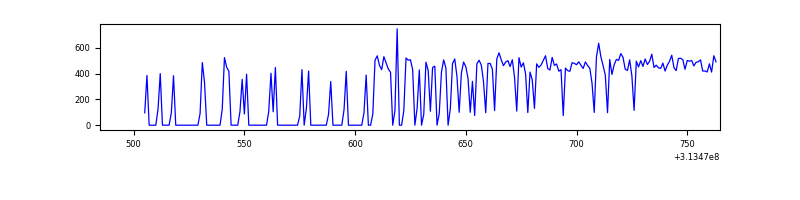 |
| C | 280 | 195 | 0 | 0 | 0.00% | 0.00% | 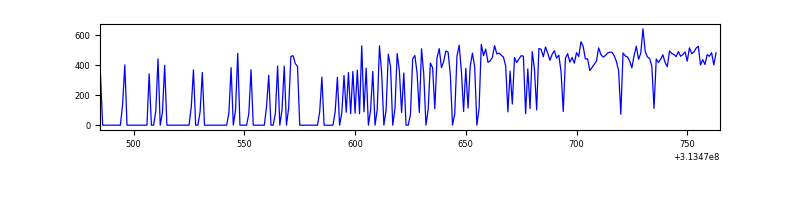 |
| D | 264 | 178 | 0 | 0 | 0.00% | 0.00% | 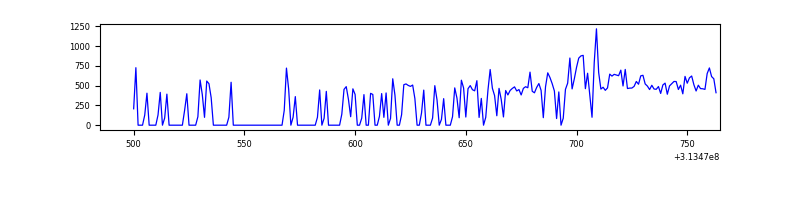 |
Top three noisy pixels from each quadrant. If the there are fewer than three noisy pixels in the level2.evt file, extra rows are filled as -1
| Pixel properties | Quadrant properties | ||||||
|---|---|---|---|---|---|---|---|
| Quadrant | DetID | PixID | Counts | Sigma | Mean | Median | Sigma |
| A | 13 | 252 | 360 | 57.32 | 19 | 19 | 5.9 |
| A | 13 | 254 | 249 | 38.66 | 19 | 19 | 5.9 |
| A | 3 | 137 | 178 | 26.73 | 19 | 19 | 5.9 |
| B | 4 | 173 | 1042 | 189.07 | 17 | 17 | 5.4 |
| B | 14 | 111 | 354 | 62.16 | 17 | 17 | 5.4 |
| B | 12 | 111 | 351 | 61.61 | 17 | 17 | 5.4 |
| C | 14 | 238 | 2751 | 466.11 | 17 | 17 | 5.9 |
| C | 13 | 61 | 159 | 24.21 | 17 | 17 | 5.9 |
| C | 0 | 239 | 136 | 20.29 | 17 | 17 | 5.9 |
| D | 7 | 238 | 10962 | 1838.37 | 17 | 16 | 6.0 |
| D | 13 | 153 | 2644 | 441.37 | 17 | 16 | 6.0 |
| D | 2 | 234 | 610 | 99.76 | 17 | 16 | 6.0 |
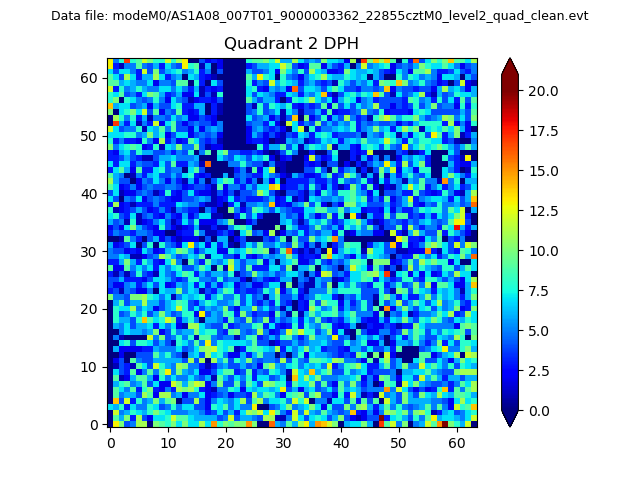
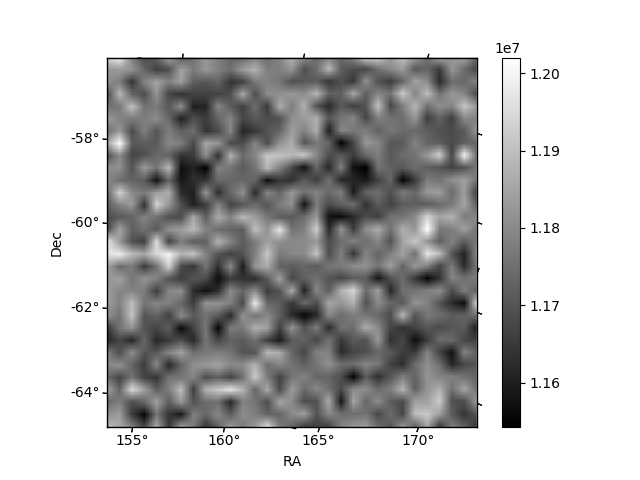
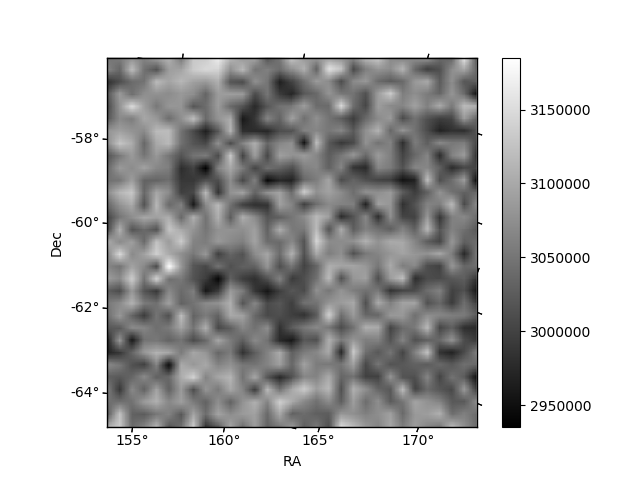
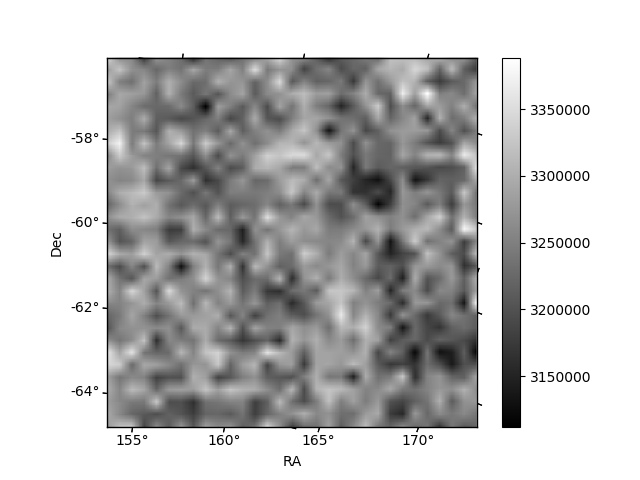
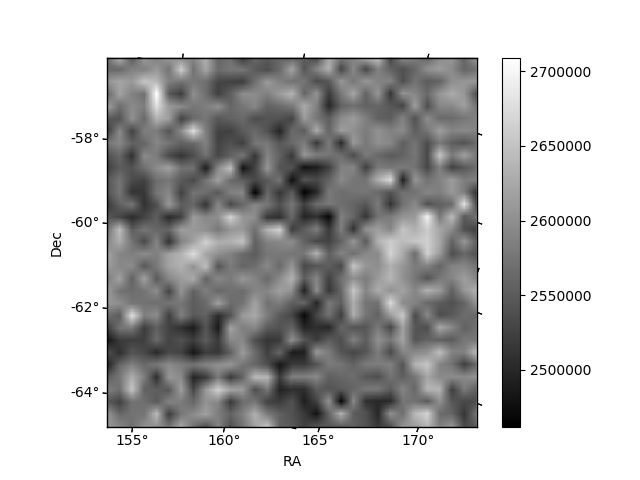
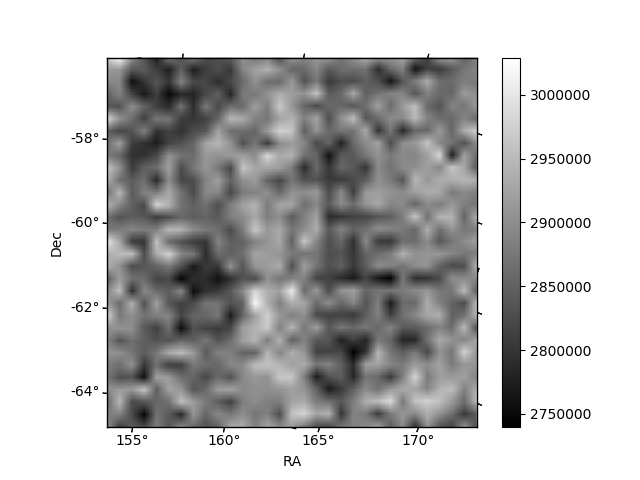
Histogram calculated using DETX and DETY for each event in the final _common_clean file
| Quadrant A | 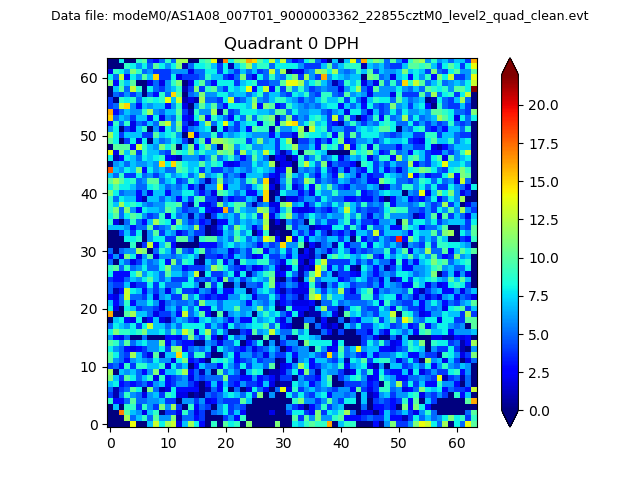 |
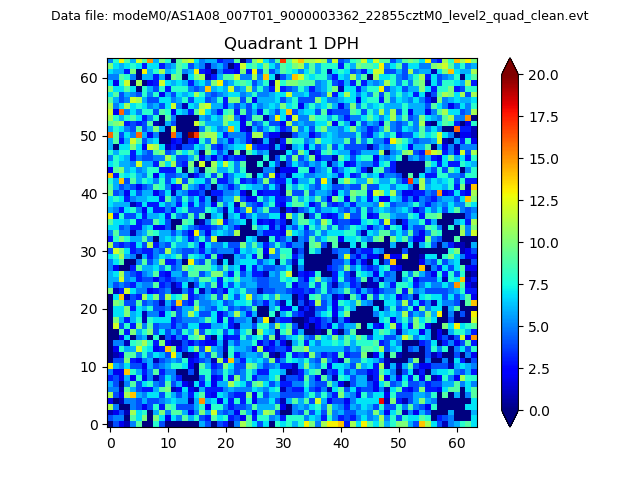 |
Quadrant B |
|---|---|---|---|
| Quadrant D | 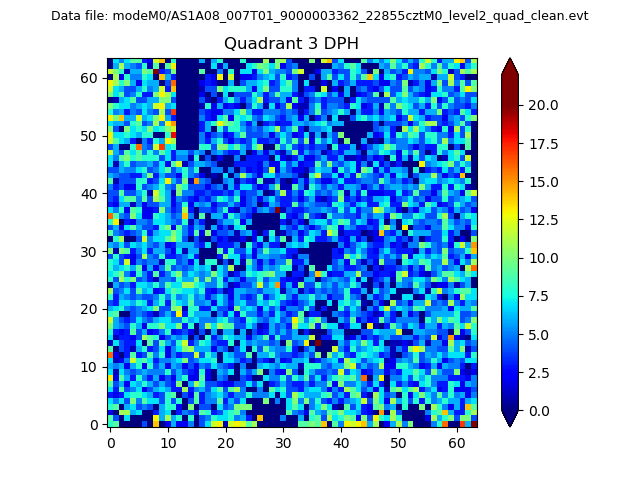 |
 |
Quadrant C |
| Plot type | Count rate plots | Images |
|---|---|---|
| Comparison with Poisson distribution Blue bars denote a histogram of data divided into 1 sec bins. Red curve is a Poisson curve with rate = median count rate of data. |
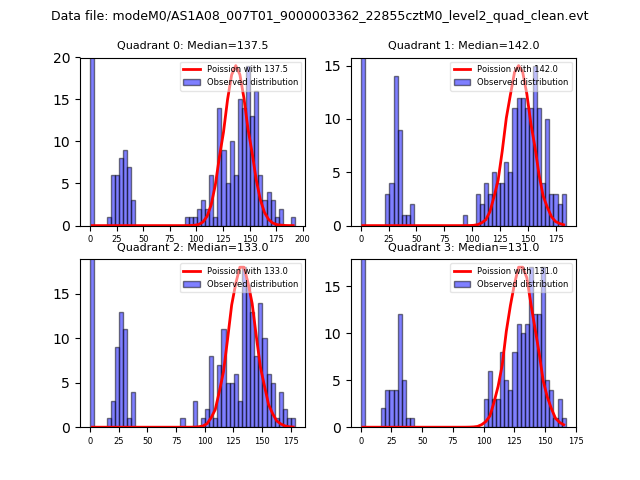 |
 |
| Quadrant-wise count rates Data is divided into 100 sec bins |
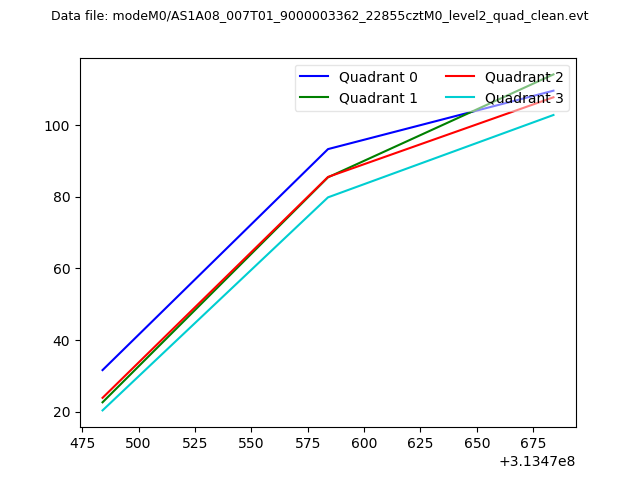 |
|
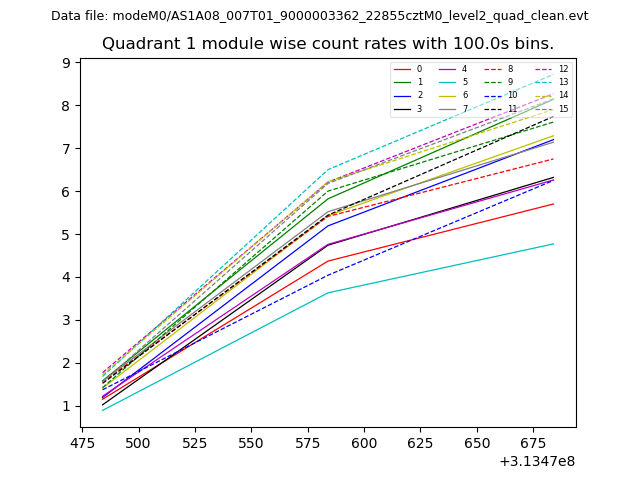
| Module-wise count rates for Quadrant A Data is divided into 100 sec bins |
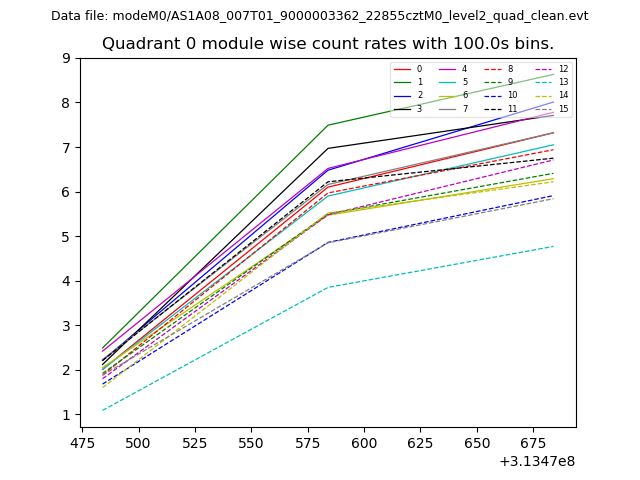 |
 |
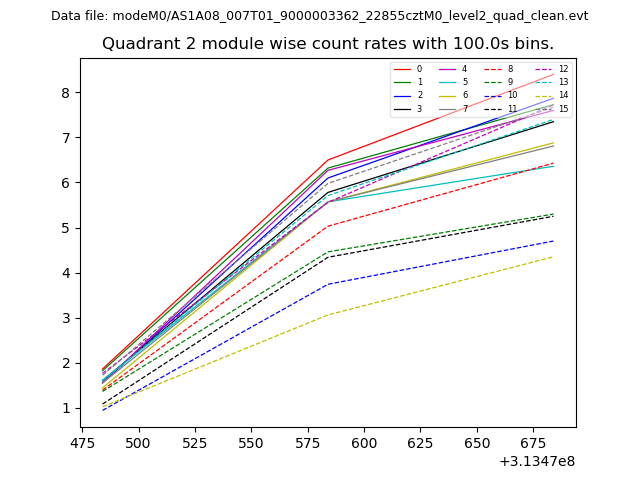
| Module-wise count rates for Quadrant B Data is divided into 100 sec bins |
 |
 |
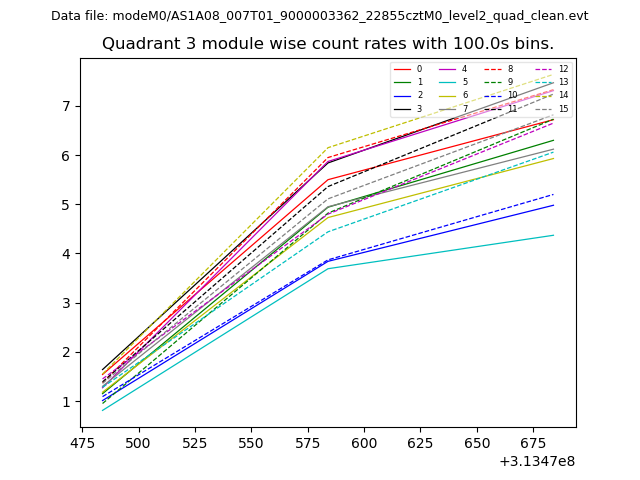
| Module-wise count rates for Quadrant C Data is divided into 100 sec bins |
 |
 |
| Module-wise count rates for Quadrant D Data is divided into 100 sec bins |
 |
 |
| Parameter | Plot |
|---|---|
| CZT HV Monitor | 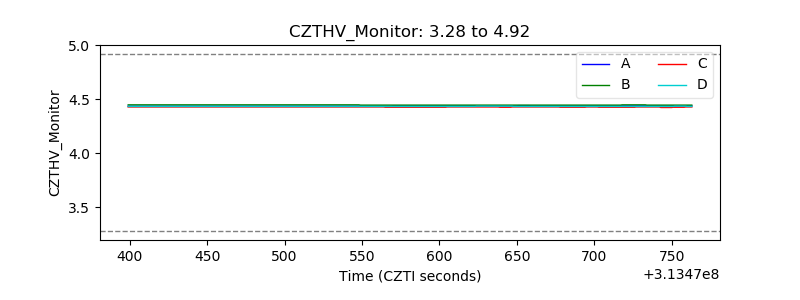 |
| D_VDD |  |
| Temperature 1 | 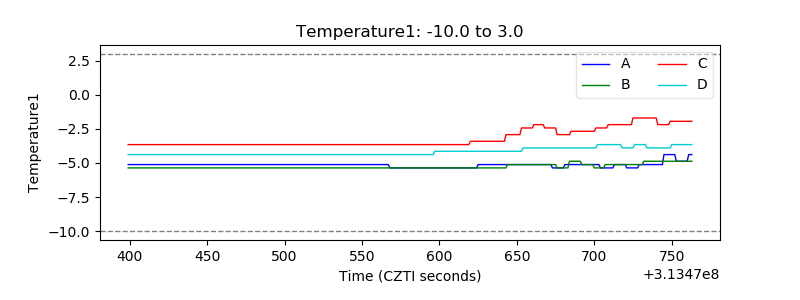 |
| Veto HV Monitor | 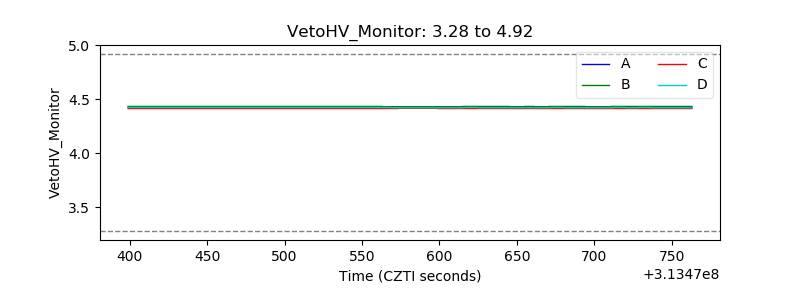 |
| Veto LLD | 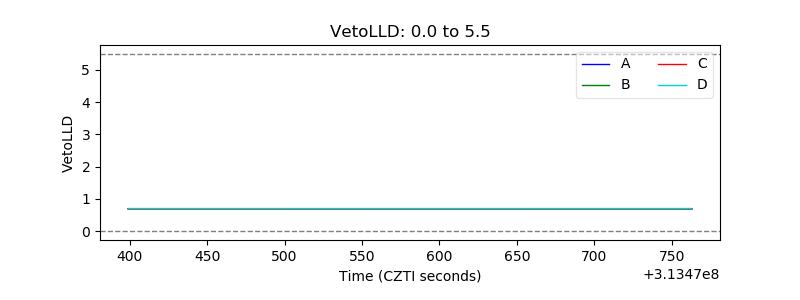 |
| Alpha Counter | 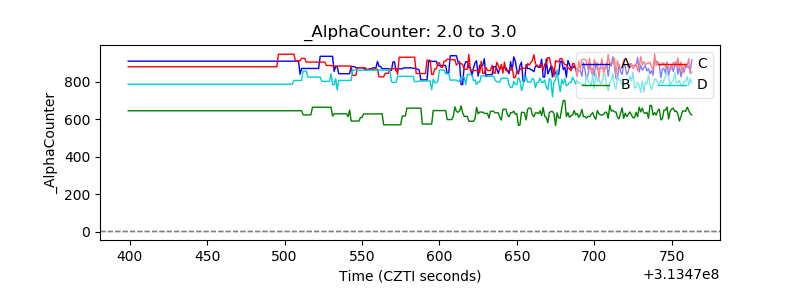 |
| _CPM_Rate | 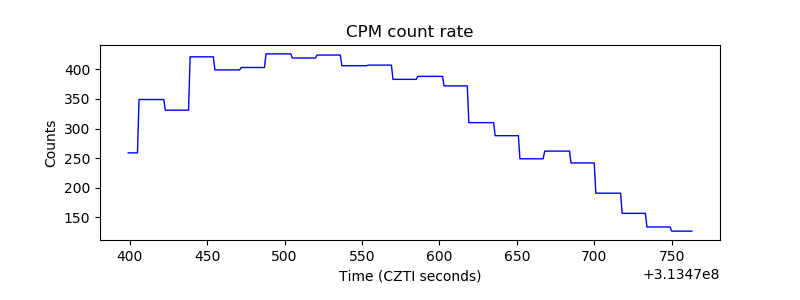 |
| CZT Counter | 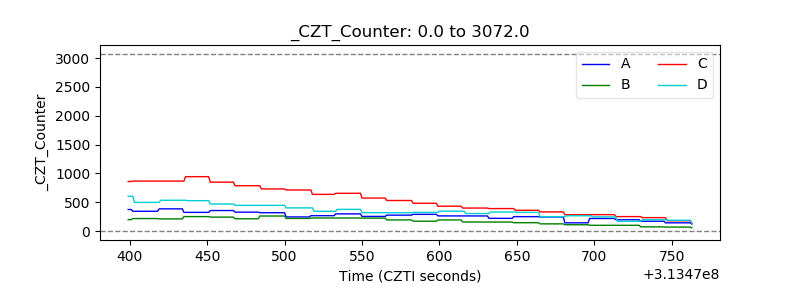 |
| +2.5 Volts monitor |  |
| +5 Volts monitor |  |
| _ROLL_ROT | 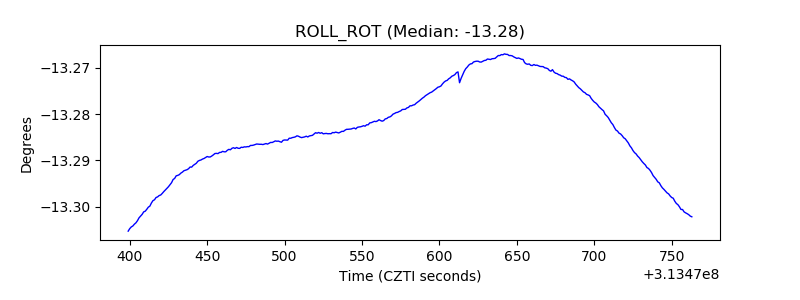 |
| _Roll_DEC | 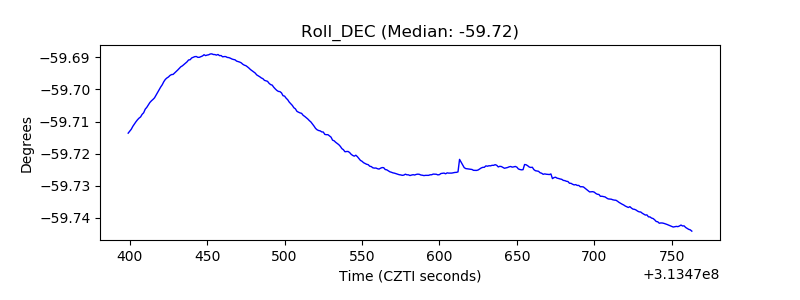 |
| _Roll_RA | 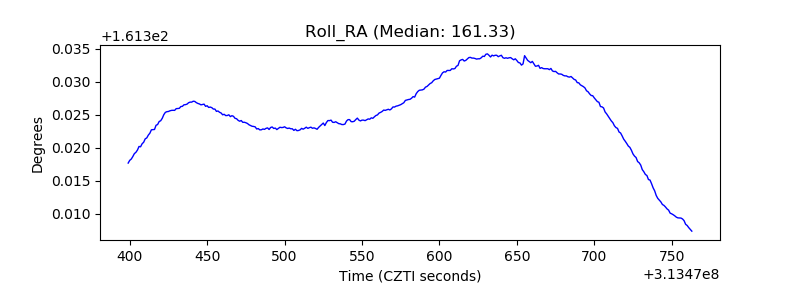 |
| Veto Counter | 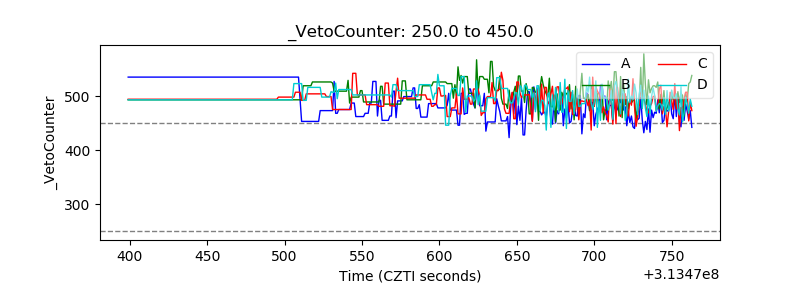 |