| Param | Original file | Final file |
|---|---|---|
| Filename | modeM0/AS1A08_007T01_9000003362_22870cztM0_level2.evt | modeM0/AS1A08_007T01_9000003362_22870cztM0_level2_quad_clean.evt |
| Size (bytes) | 180,046,080 | 42,776,640 |
| Size | 171.7 MB | 40.8 MB |
| Events in quadrant A | 1,248,551 | 295,256 |
| Events in quadrant B | 1,246,465 | 291,202 |
| Events in quadrant C | 1,221,370 | 272,472 |
| Events in quadrant D | 1,573,202 | 265,579 |
| Mode SS | |||
|---|---|---|---|
| Quadrant | BADHDUFLAG | Total packets | Discarded packets |
| A | 0 | 57 | 11 |
| B | 0 | 58 | 8 |
| C | 0 | 58 | 12 |
| D | 0 | 58 | 14 |
| Mode M0 | |||
|---|---|---|---|
| Quadrant | BADHDUFLAG | Total packets | Discarded packets |
| A | 0 | 6032 | 959 |
| B | 0 | 6142 | 1074 |
| C | 0 | 6027 | 1002 |
| D | 0 | 7732 | 1608 |
| Mode M9 | |||
|---|---|---|---|
| Quadrant | BADHDUFLAG | Total packets | Discarded packets |
| A | 0 | 14 | 0 |
| B | 0 | 14 | 0 |
| C | 0 | 14 | 0 |
| D | 0 | 14 | 0 |
| Quadrant | Total seconds | Saturated seconds | Saturation percentage |
|---|---|---|---|
| A | 2403 | 22 | 0.915522% |
| B | 2378 | 29 | 1.219512% |
| C | 2383 | 32 | 1.342845% |
| D | 2345 | 56 | 2.388060% |
Noise dominated data is calculated using 1-second bins in cleaned event files. If a bin has >2000 counts, and if more than 50% of those come from <1% of pixels, then it is considered to be noise-dominated and hence unusable.
| Quadrant | # 1 sec bins | Bins with >0 counts | Bins with >2000 counts | High rate bins dominated by noise | Noise dominated (total time) | Noise dominated (detector-on time) | Marked lightcurve |
|---|---|---|---|---|---|---|---|
| A | 4173 | 2508 | 0 | 0 | 0.00% | 0.00% | 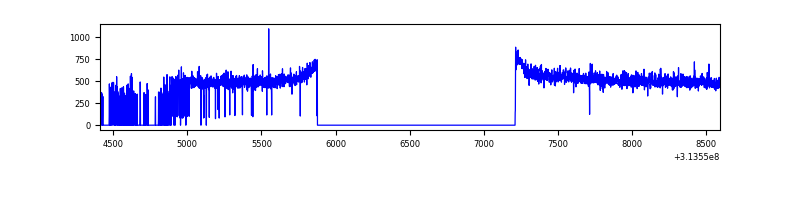 |
| B | 4183 | 2492 | 0 | 0 | 0.00% | 0.00% | 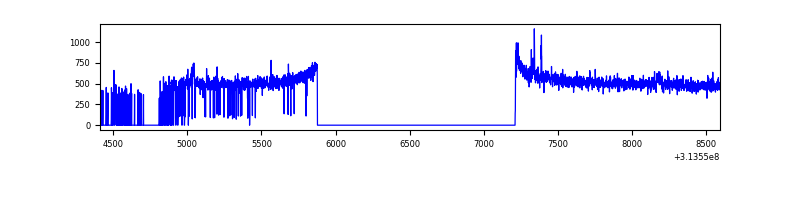 |
| C | 4157 | 2472 | 0 | 0 | 0.00% | 0.00% | 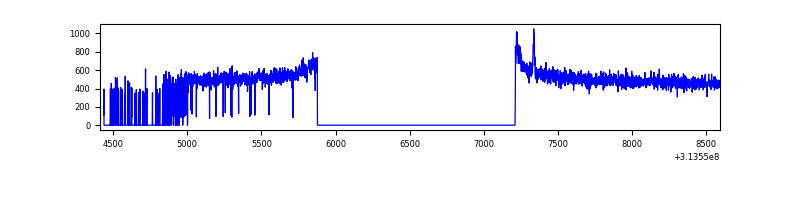 |
| D | 4115 | 2426 | 33 | 33 | 0.80% | 1.36% | 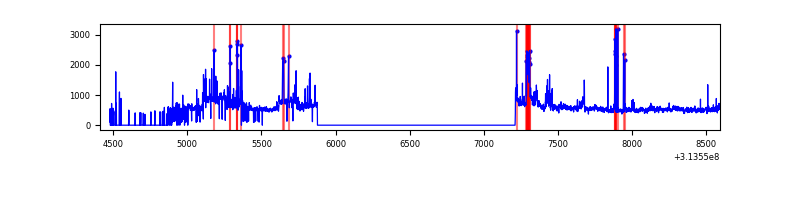 |
Top three noisy pixels from each quadrant. If the there are fewer than three noisy pixels in the level2.evt file, extra rows are filled as -1
| Pixel properties | Quadrant properties | ||||||
|---|---|---|---|---|---|---|---|
| Quadrant | DetID | PixID | Counts | Sigma | Mean | Median | Sigma |
| A | 6 | 16 | 6815 | 98.86 | 321 | 315 | 65.8 |
| A | 13 | 254 | 4040 | 56.65 | 321 | 315 | 65.8 |
| A | 0 | 226 | 2821 | 38.11 | 321 | 315 | 65.8 |
| B | 12 | 111 | 6960 | 110.72 | 315 | 308 | 60.1 |
| B | 11 | 111 | 5833 | 91.96 | 315 | 308 | 60.1 |
| B | 0 | 189 | 5625 | 88.5 | 315 | 308 | 60.1 |
| C | 14 | 238 | 48440 | 695.6 | 297 | 298 | 69.2 |
| C | 9 | 54 | 5233 | 71.31 | 297 | 298 | 69.2 |
| C | 0 | 10 | 4683 | 63.36 | 297 | 298 | 69.2 |
| D | 7 | 238 | 171603 | 2342.64 | 299 | 291 | 73.1 |
| D | 9 | 1 | 110405 | 1505.78 | 299 | 291 | 73.1 |
| D | 1 | 239 | 63033 | 857.98 | 299 | 291 | 73.1 |
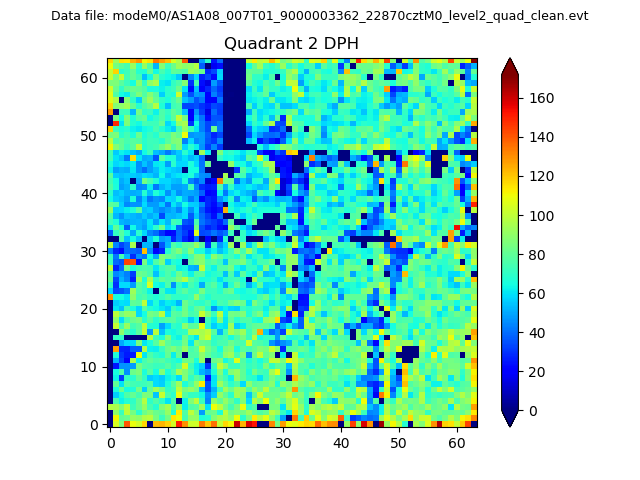
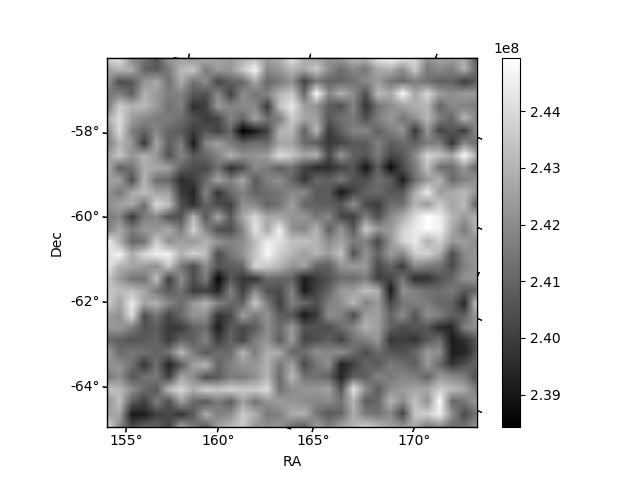
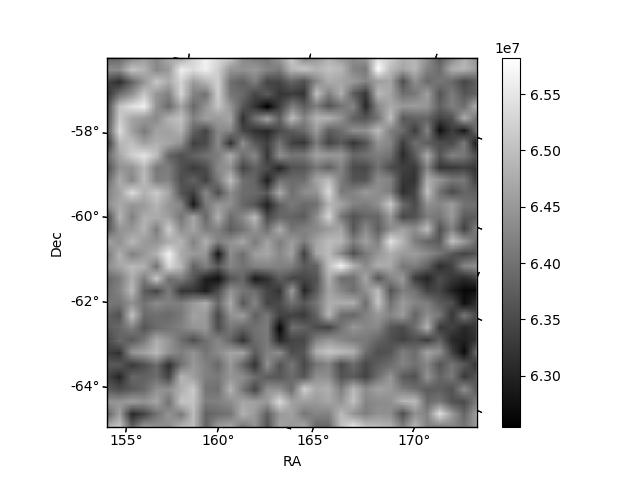
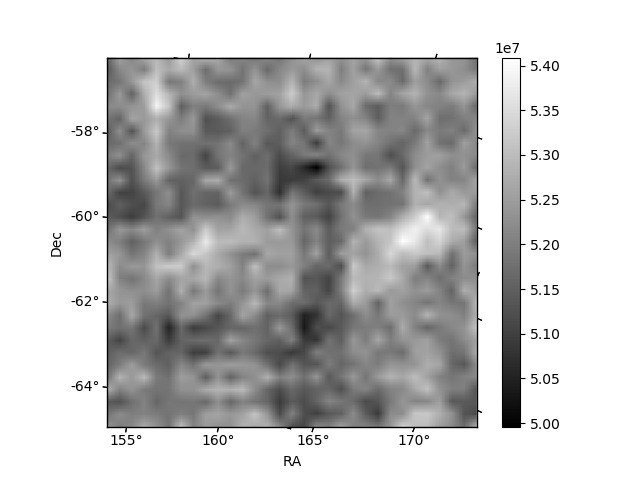
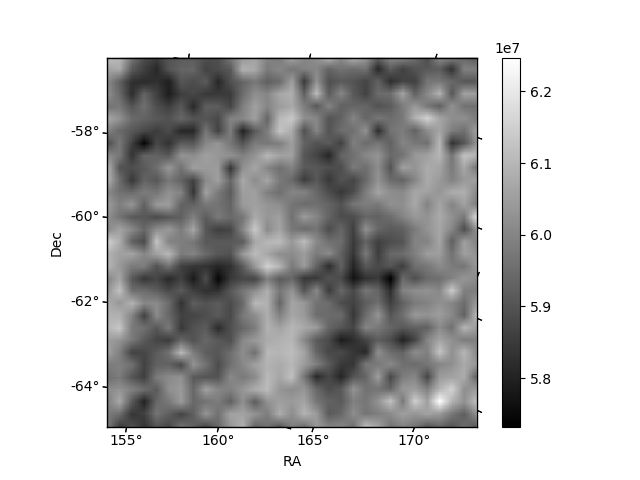
Histogram calculated using DETX and DETY for each event in the final _common_clean file
| Quadrant A | 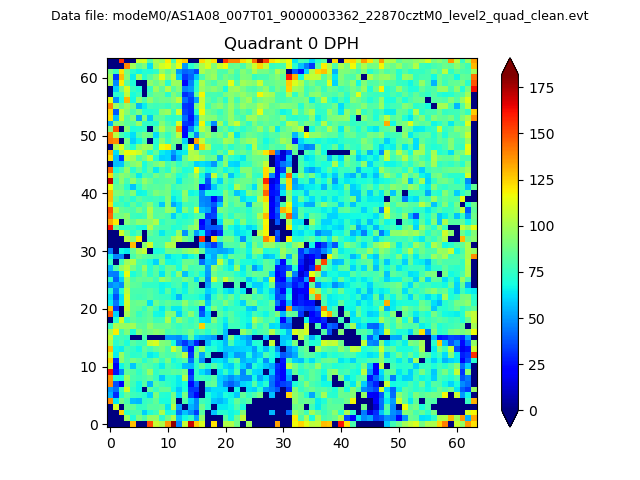 |
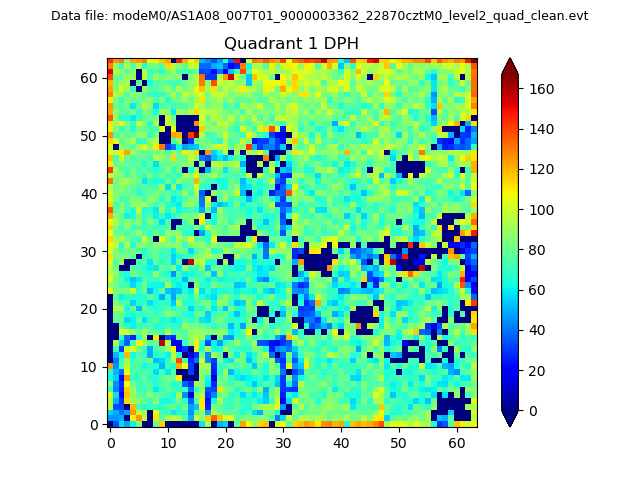 |
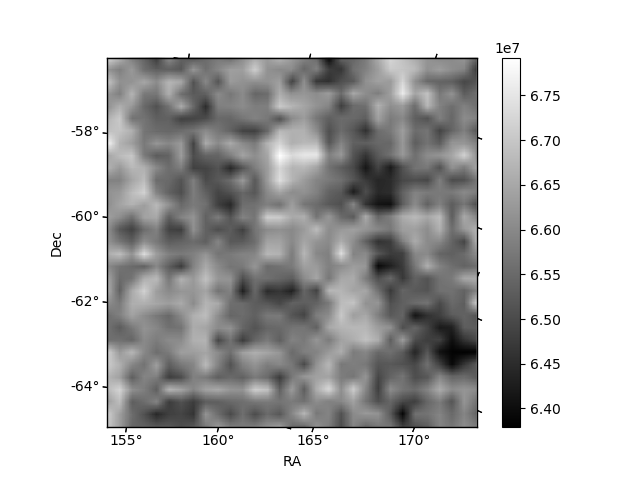
Quadrant B |
|---|---|---|---|
| Quadrant D | 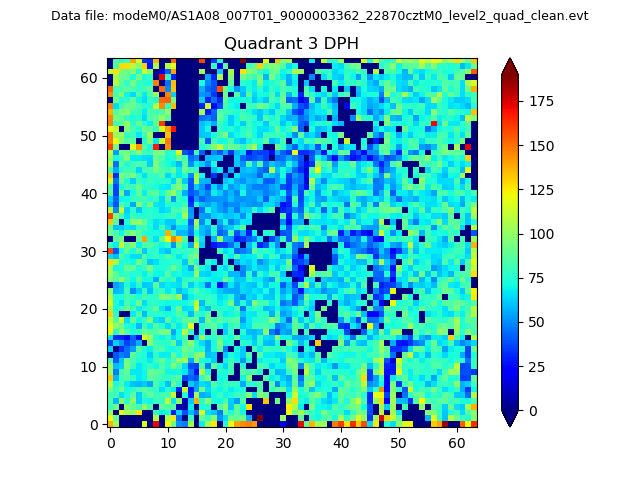 |
 |
Quadrant C |
| Plot type | Count rate plots | Images |
|---|---|---|
| Comparison with Poisson distribution Blue bars denote a histogram of data divided into 1 sec bins. Red curve is a Poisson curve with rate = median count rate of data. |
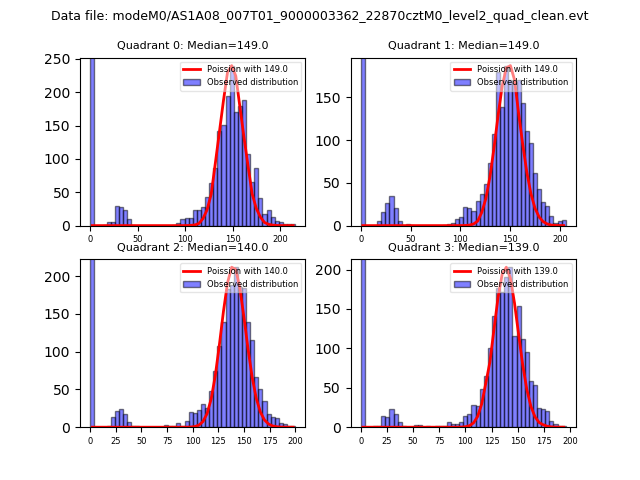 |
 |
| Quadrant-wise count rates Data is divided into 100 sec bins |
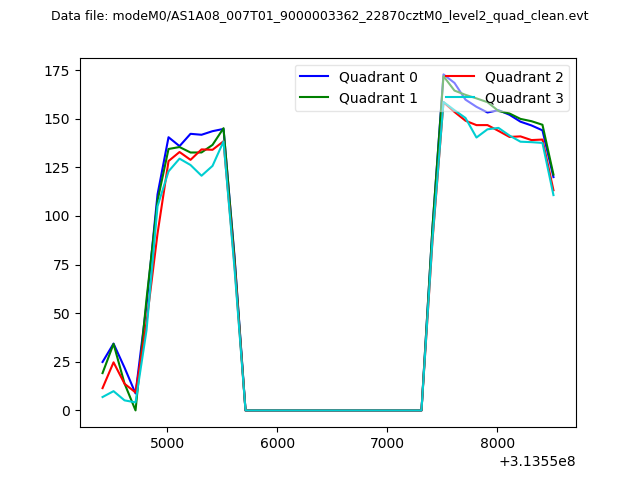 |
|
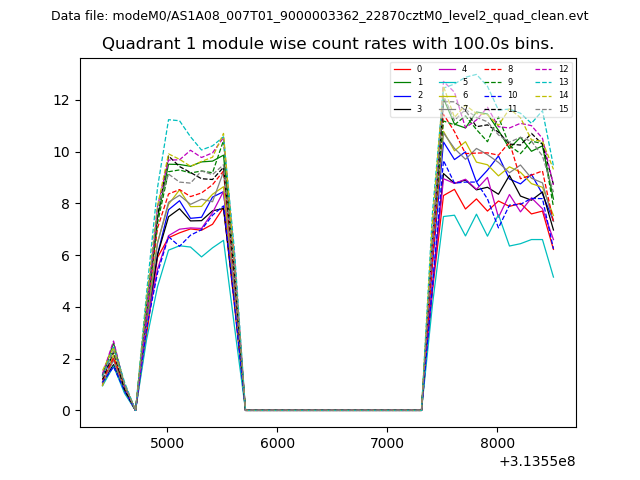
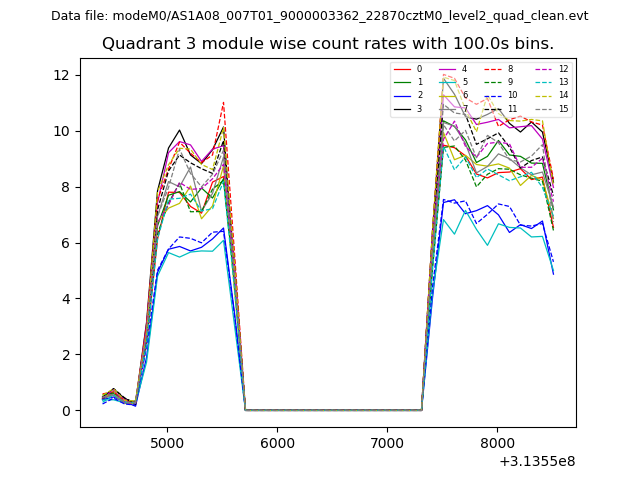
| Module-wise count rates for Quadrant A Data is divided into 100 sec bins |
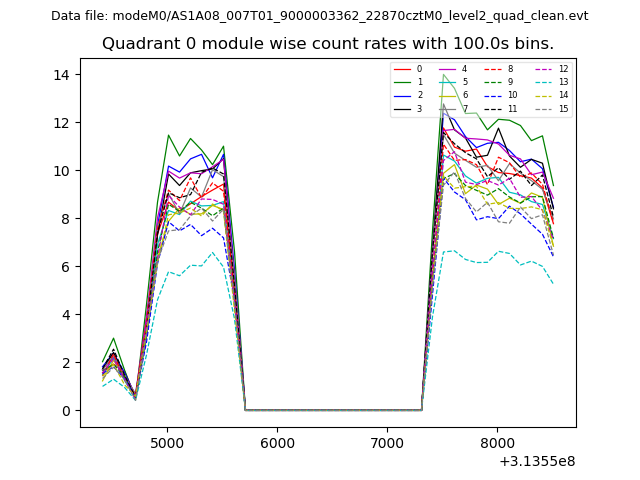 |
 |
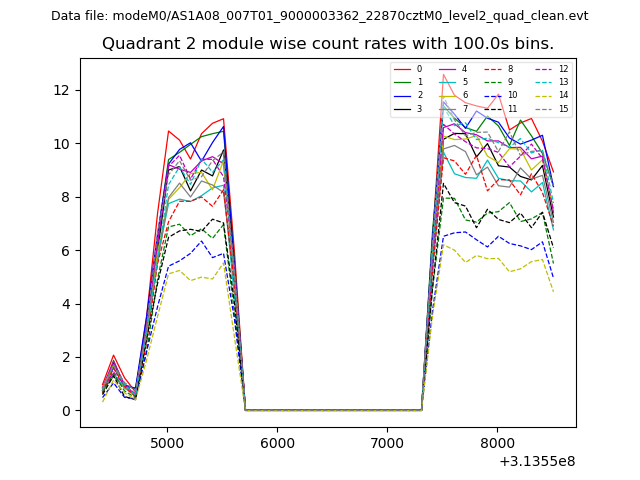
| Module-wise count rates for Quadrant B Data is divided into 100 sec bins |
 |
 |
| Module-wise count rates for Quadrant C Data is divided into 100 sec bins |
 |
 |
| Module-wise count rates for Quadrant D Data is divided into 100 sec bins |
 |
 |
| Parameter | Plot |
|---|---|
| CZT HV Monitor | 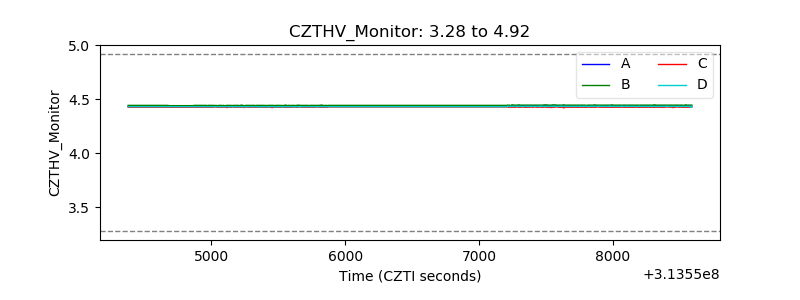 |
| D_VDD |  |
| Temperature 1 | 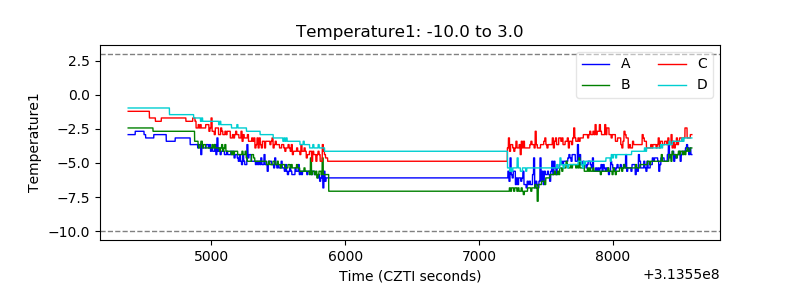 |
| Veto HV Monitor | 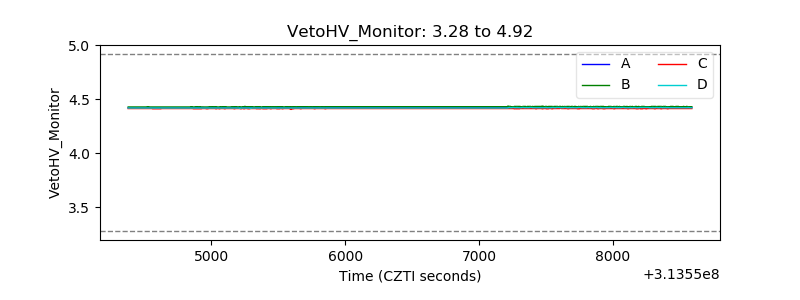 |
| Veto LLD | 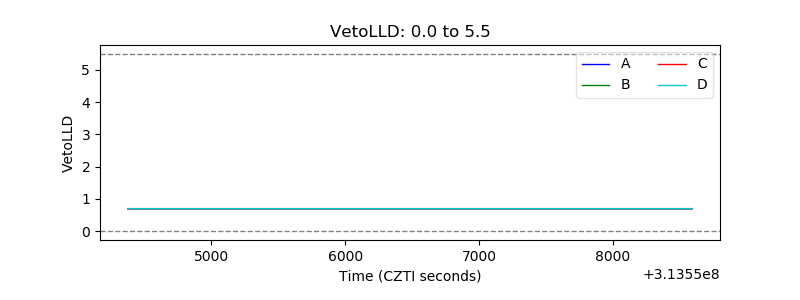 |
| Alpha Counter | 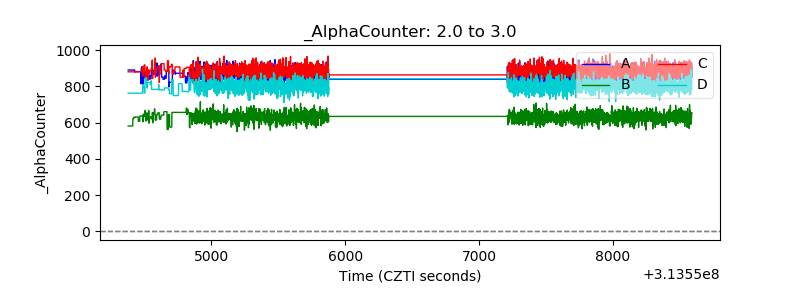 |
| _CPM_Rate | 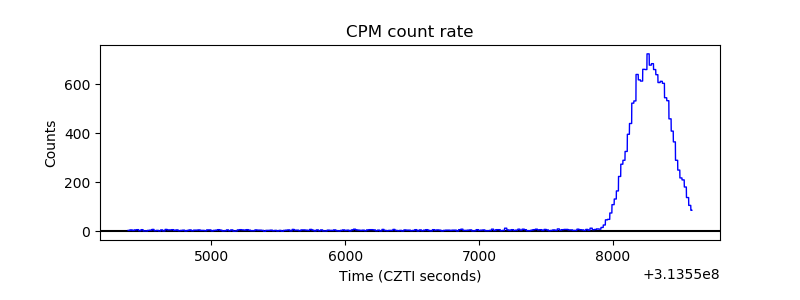 |
| CZT Counter | 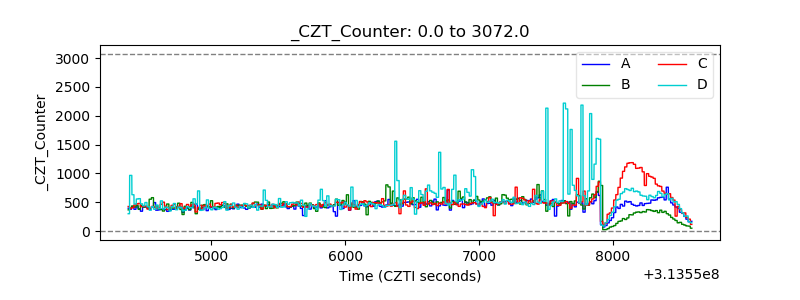 |
| +2.5 Volts monitor |  |
| +5 Volts monitor |  |
| _ROLL_ROT | 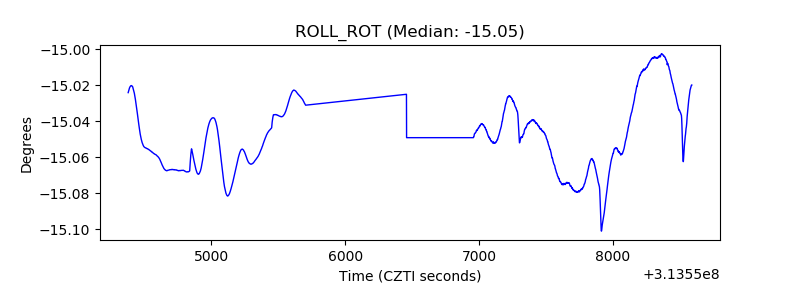 |
| _Roll_DEC | 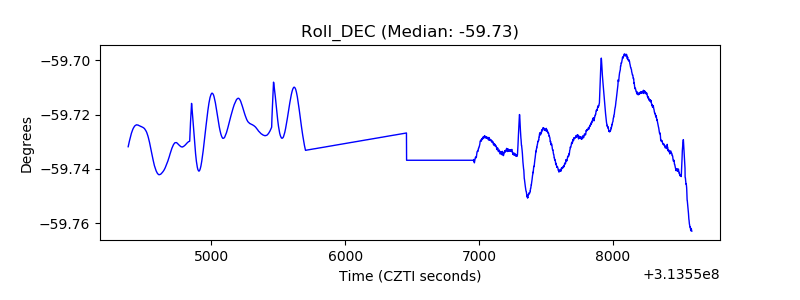 |
| _Roll_RA | 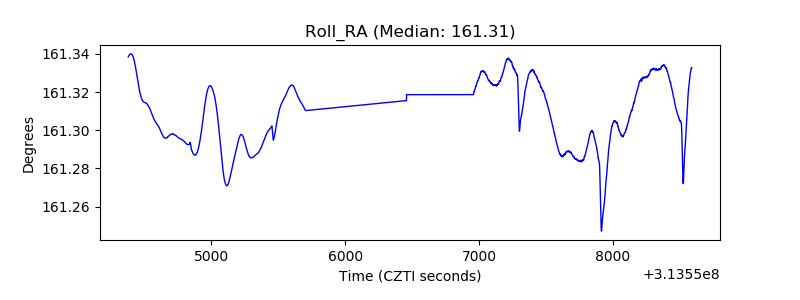 |
| Veto Counter | 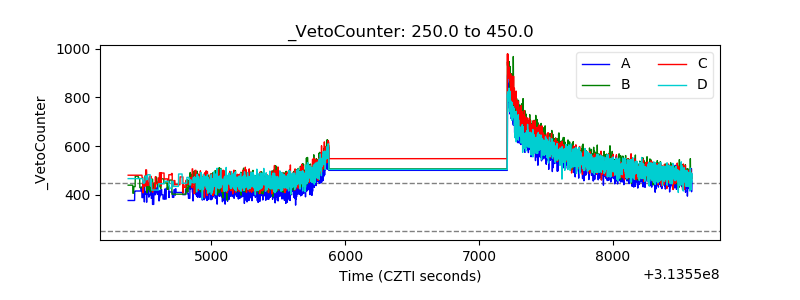 |