| Param | Original file | Final file |
|---|---|---|
| Filename | modeM0/AS1C05_001T01_9000003366cztM0_level2.fits | modeM0/AS1C05_001T01_9000003366cztM0_level2_quad_clean.evt |
| Size (bytes) | 684,097,920 | 776,010,240 |
| Size | 652.4 MB | 740.1 MB |
| Events in quadrant A | 4,281,834 | 4,979,086 |
| Events in quadrant B | 4,064,026 | 4,944,099 |
| Events in quadrant C | 4,130,508 | 4,683,364 |
| Events in quadrant D | 3,602,922 | 4,257,397 |
| Mode M9 | |||
|---|---|---|---|
| Quadrant | BADHDUFLAG | Total packets | Discarded packets |
| A | 0 | 106 | 0 |
| B | 0 | 106 | 0 |
| C | 0 | 106 | 0 |
| D | 0 | 106 | 0 |
| Mode SS | |||
|---|---|---|---|
| Quadrant | BADHDUFLAG | Total packets | Discarded packets |
| A | 0 | 1378 | 0 |
| B | 0 | 1378 | 0 |
| C | 0 | 1378 | 0 |
| D | 0 | 1378 | 0 |
| Mode M0 | |||
|---|---|---|---|
| Quadrant | BADHDUFLAG | Total packets | Discarded packets |
| A | 0 | 140688 | 0 |
| B | 0 | 143145 | 0 |
| C | 0 | 141567 | 0 |
| D | 0 | 173470 | 0 |
| Quadrant | Total seconds | Saturated seconds | Saturation percentage |
|---|---|---|---|
| A | 67641 | 583 | 0.861903% |
| B | 67641 | 760 | 1.123579% |
| C | 67641 | 971 | 1.435520% |
| D | 67641 | 2250 | 3.326385% |
Noise dominated data is calculated using 1-second bins in cleaned event files. If a bin has >2000 counts, and if more than 50% of those come from <1% of pixels, then it is considered to be noise-dominated and hence unusable.
| Quadrant | # 1 sec bins | Bins with >0 counts | Bins with >2000 counts | High rate bins dominated by noise | Noise dominated (total time) | Noise dominated (detector-on time) | Marked lightcurve |
|---|---|---|---|---|---|---|---|
| A | 78231 | 67641 | 0 | 0 | 0.00% | 0.00% | 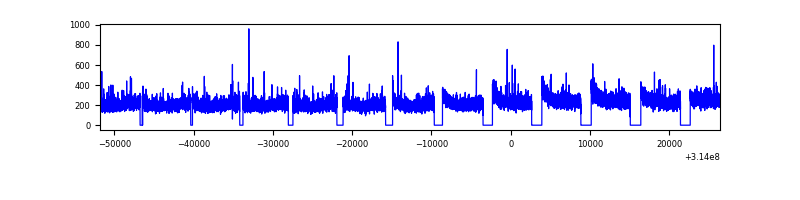 |
| B | 78231 | 67641 | 0 | 0 | 0.00% | 0.00% | 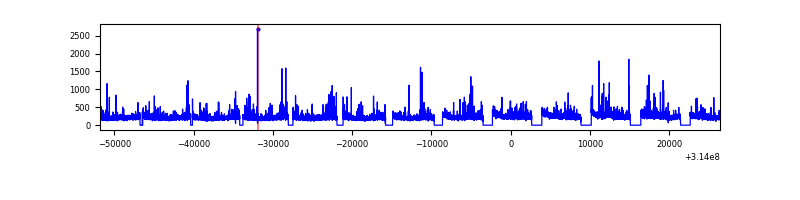 |
| C | 78231 | 67641 | 0 | 0 | 0.00% | 0.00% | 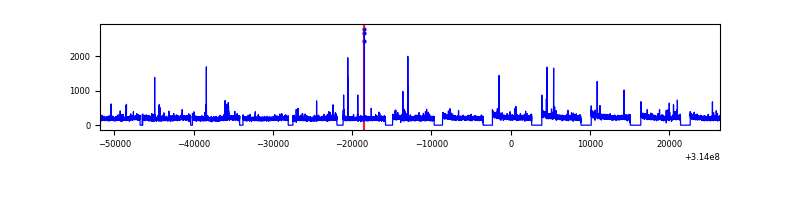 |
| D | 78231 | 67635 | 0 | 0 | 0.00% | 0.00% | 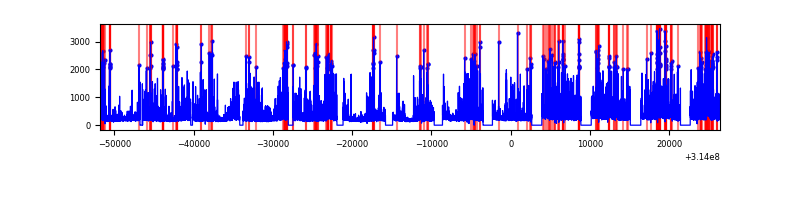 |
Top three noisy pixels from each quadrant. If the there are fewer than three noisy pixels in the level2.evt file, extra rows are filled as -1
| Pixel properties | Quadrant properties | ||||||
|---|---|---|---|---|---|---|---|
| Quadrant | DetID | PixID | Counts | Sigma | Mean | Median | Sigma |
| A | 0 | 29 | 4094 | 11.2 | 1115 | 1058 | 271.1 |
| A | 7 | 110 | 3386 | 8.59 | 1115 | 1058 | 271.1 |
| A | 0 | 30 | 3215 | 7.96 | 1115 | 1058 | 271.1 |
| B | 2 | 9 | 3258 | 10.67 | 1077 | 1036 | 208.3 |
| B | 2 | 8 | 2776 | 8.36 | 1077 | 1036 | 208.3 |
| B | 5 | 128 | 2597 | 7.5 | 1077 | 1036 | 208.3 |
| C | 3 | 234 | 2996 | 7.15 | 1092 | 1031 | 274.7 |
| C | 3 | 126 | 2918 | 6.87 | 1092 | 1031 | 274.7 |
| C | 9 | 209 | 2824 | 6.53 | 1092 | 1031 | 274.7 |
| D | 3 | 14 | 2558 | 5.93 | 1030 | 940 | 272.9 |
| D | 6 | 231 | 2516 | 5.78 | 1030 | 940 | 272.9 |
| D | 10 | 189 | 2488 | 5.67 | 1030 | 940 | 272.9 |
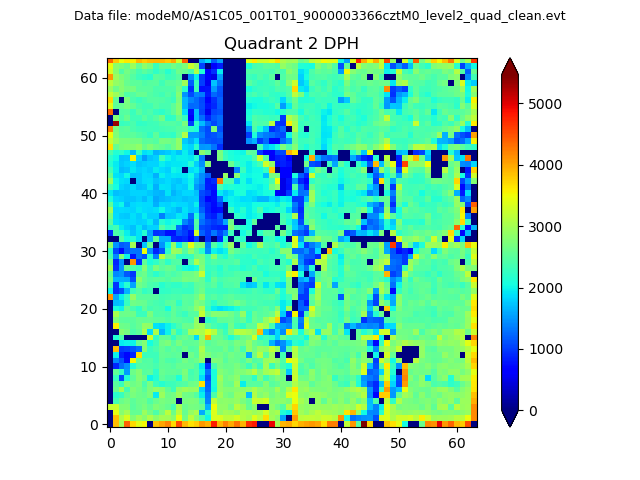
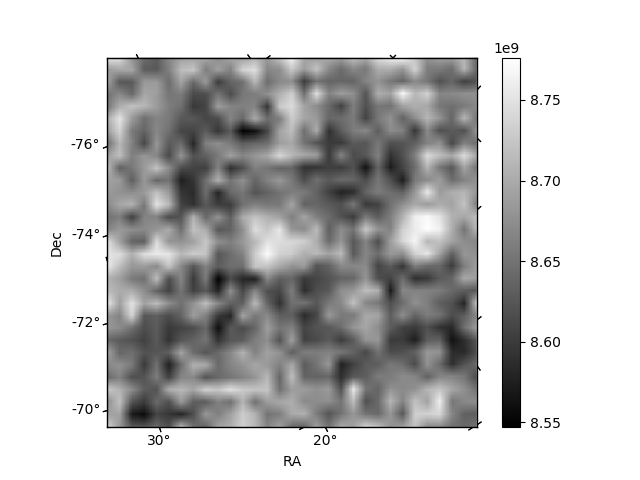
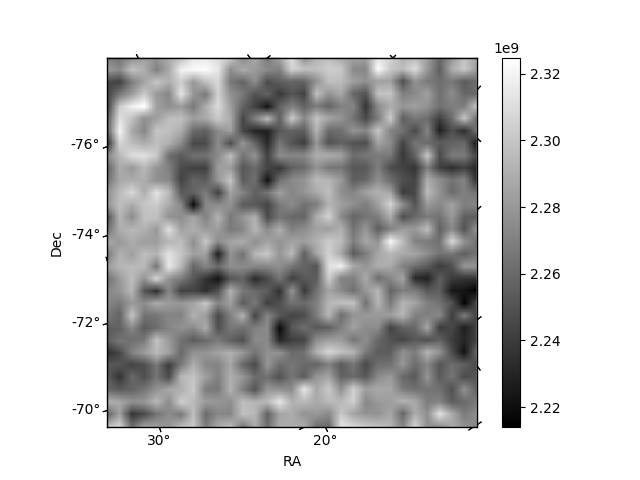
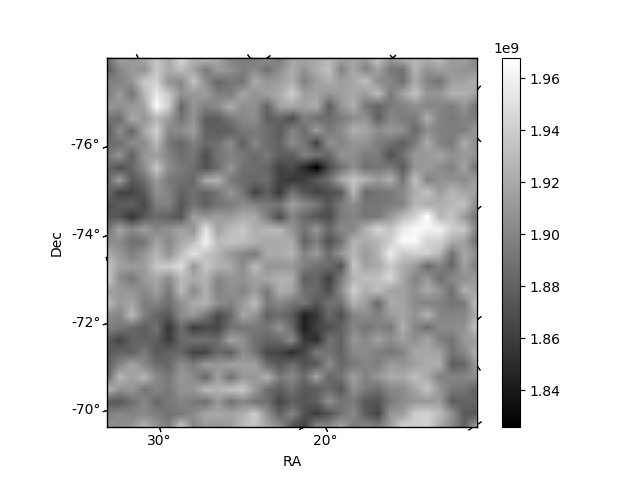
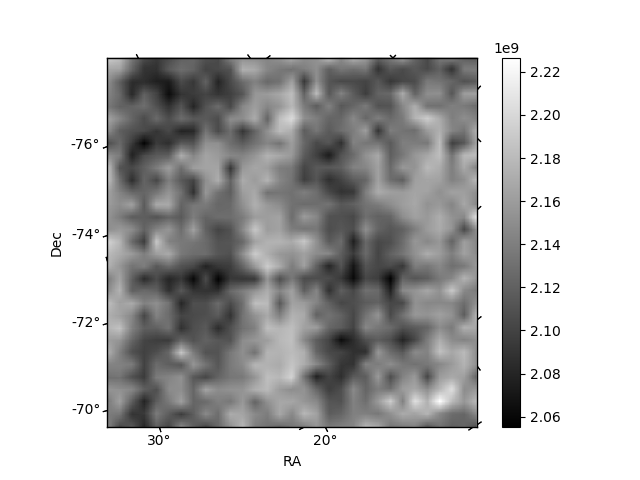
Histogram calculated using DETX and DETY for each event in the final _common_clean file
| Quadrant A | 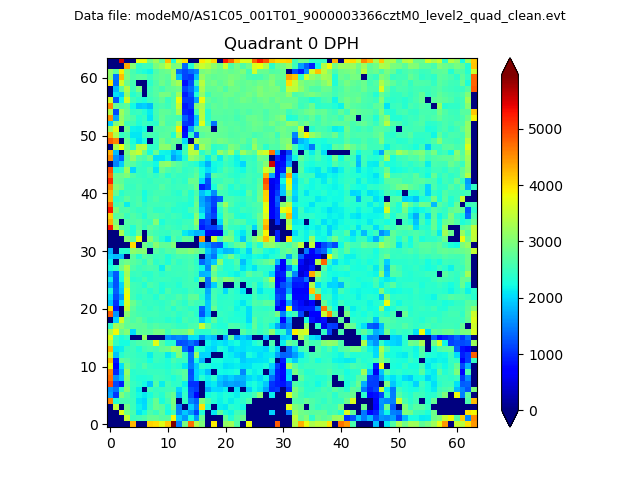 |
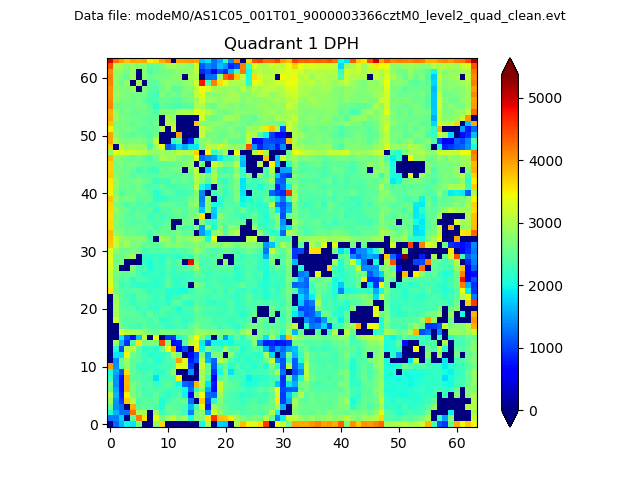 |
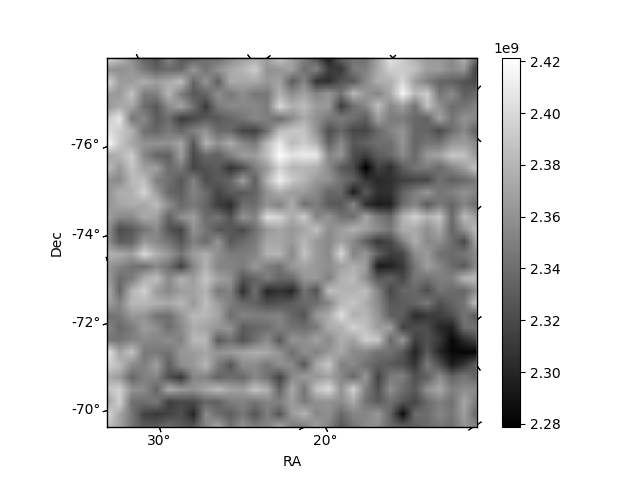
Quadrant B |
|---|---|---|---|
| Quadrant D | 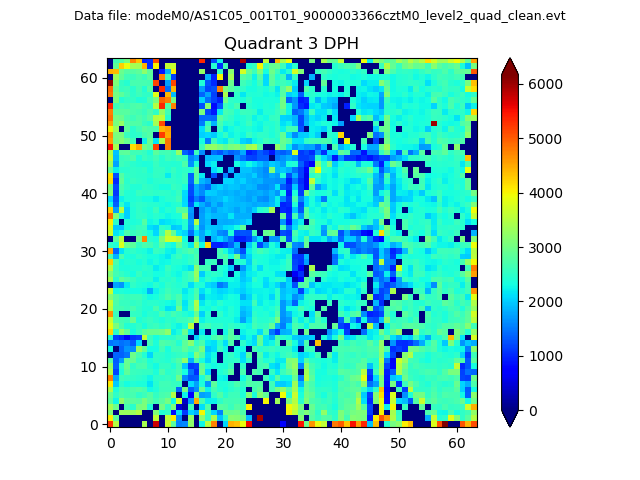 |
 |
Quadrant C |
| Plot type | Count rate plots | Images |
|---|---|---|
| Comparison with Poisson distribution Blue bars denote a histogram of data divided into 1 sec bins. Red curve is a Poisson curve with rate = median count rate of data. |
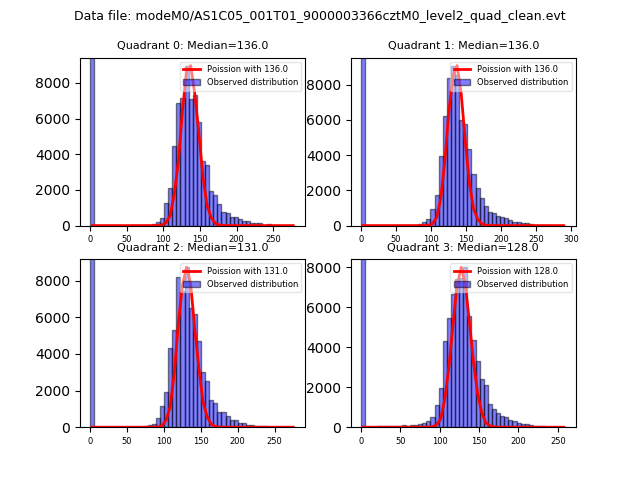 |
 |
| Quadrant-wise count rates Data is divided into 100 sec bins |
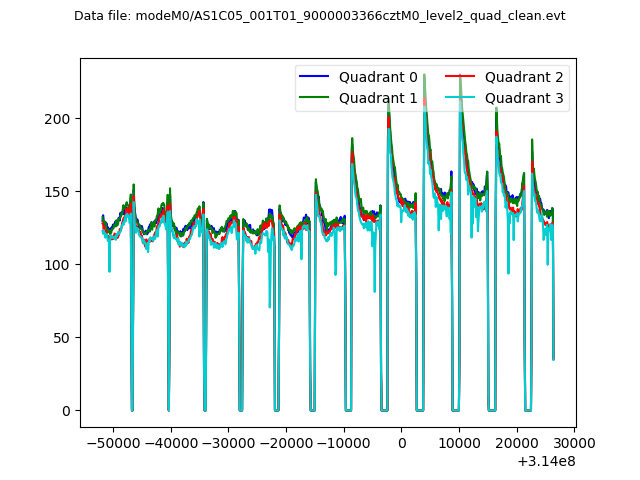 |
|
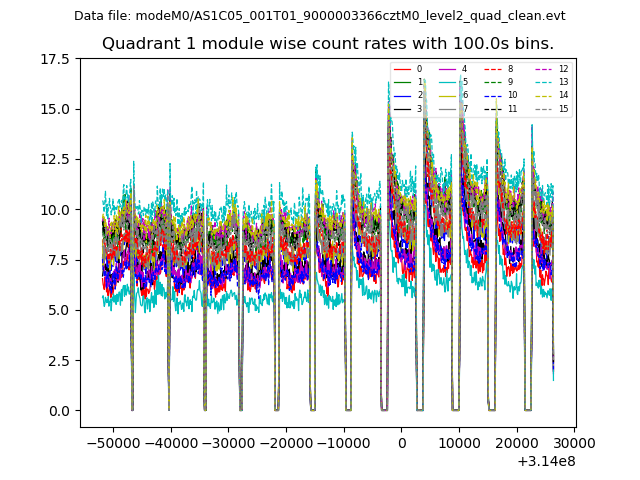
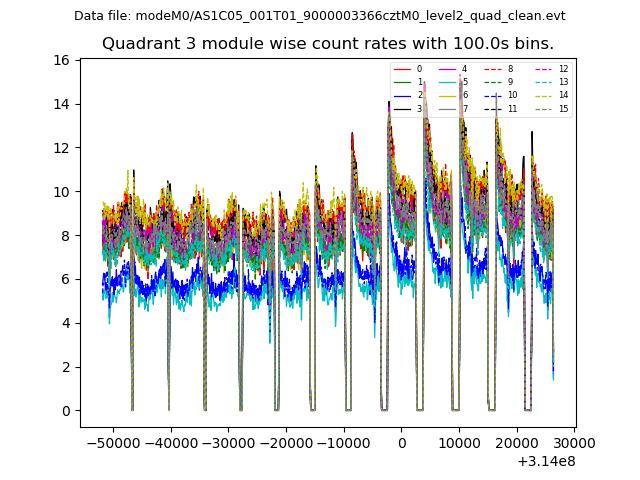
| Module-wise count rates for Quadrant A Data is divided into 100 sec bins |
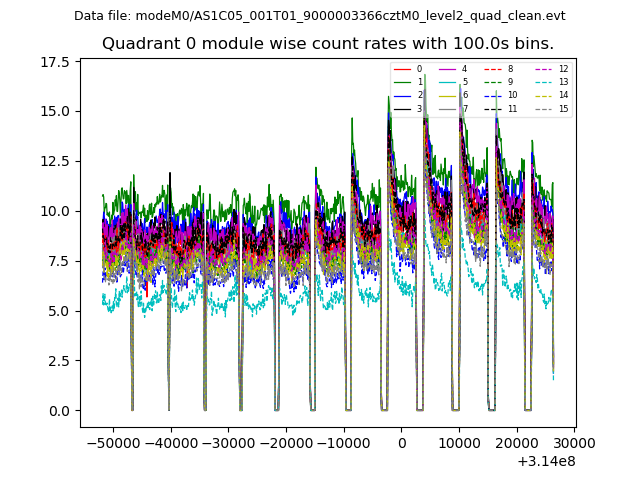 |
 |
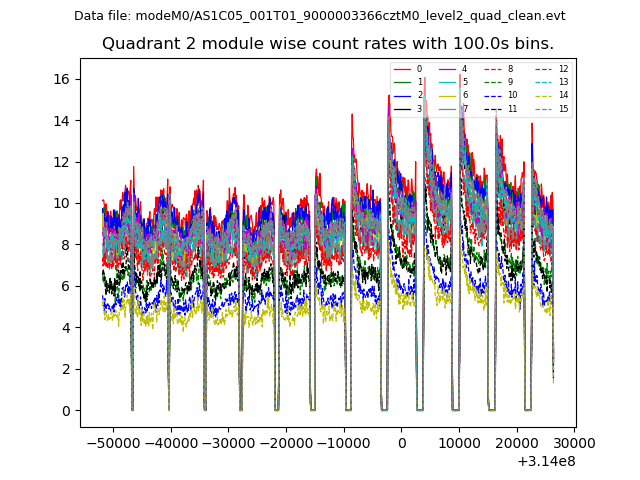
| Module-wise count rates for Quadrant B Data is divided into 100 sec bins |
 |
 |
| Module-wise count rates for Quadrant C Data is divided into 100 sec bins |
 |
 |
| Module-wise count rates for Quadrant D Data is divided into 100 sec bins |
 |
 |
| Parameter | Plot |
|---|---|
| CZT HV Monitor | 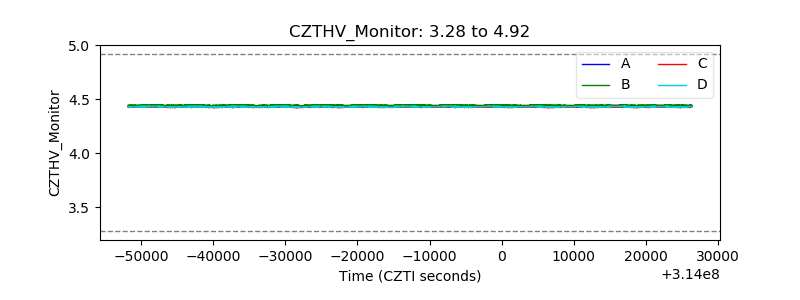 |
| D_VDD | 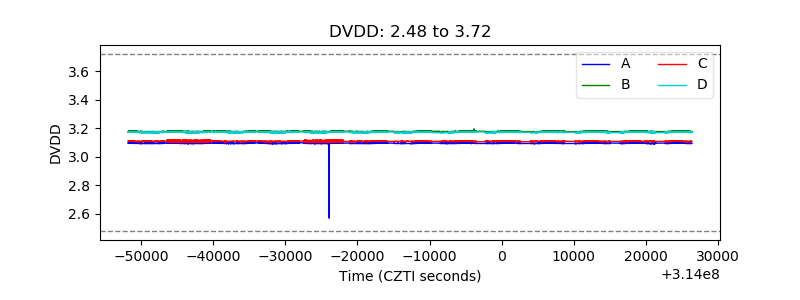 |
| Temperature 1 | 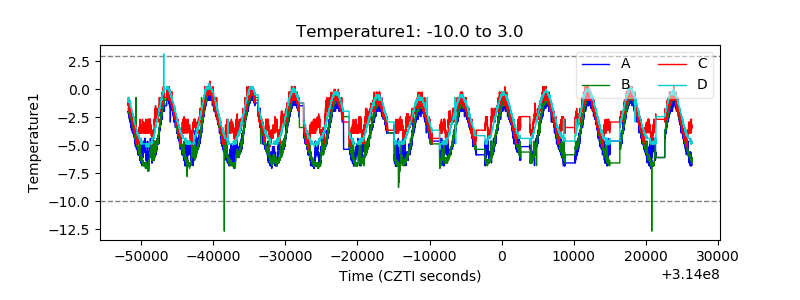 |
| Veto HV Monitor | 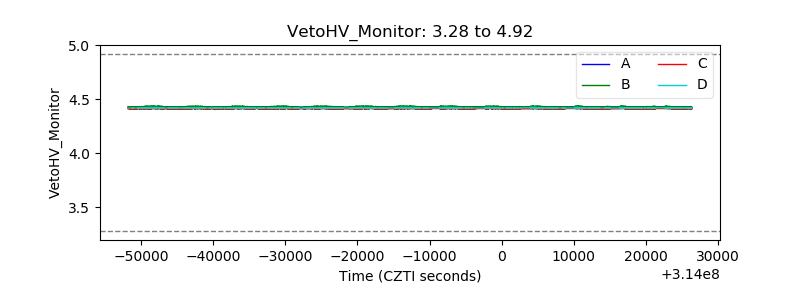 |
| Veto LLD | 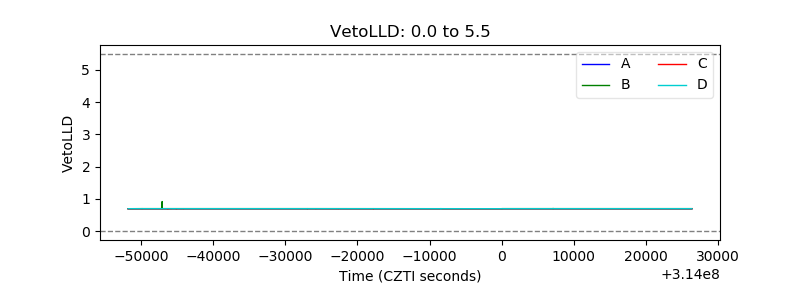 |
| Alpha Counter | 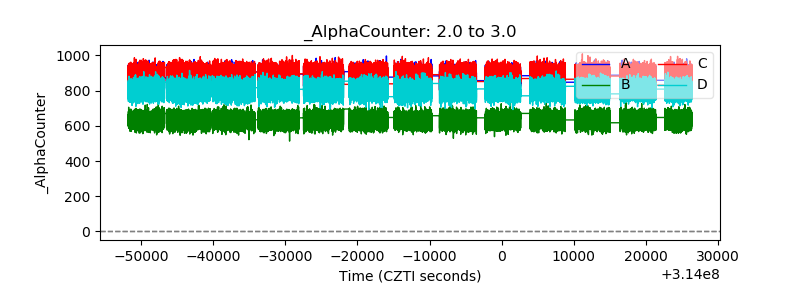 |
| _CPM_Rate | 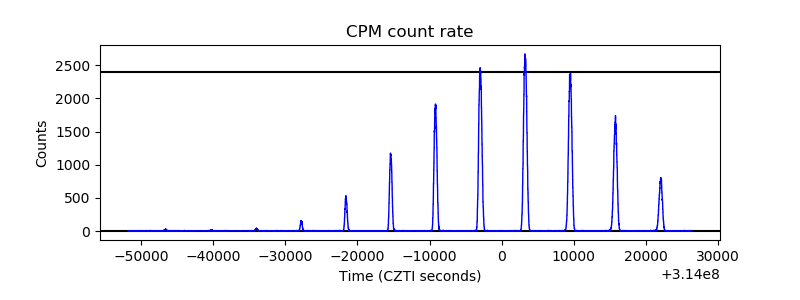 |
| CZT Counter | 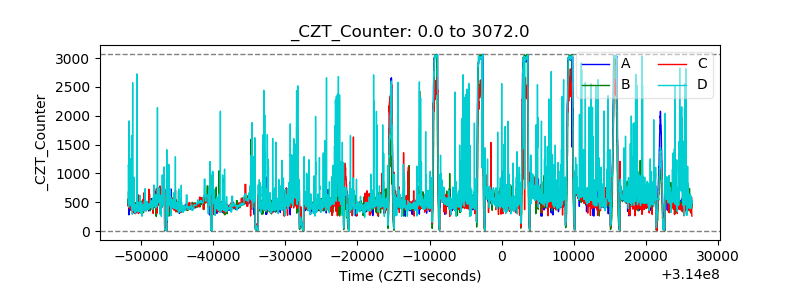 |
| +2.5 Volts monitor | 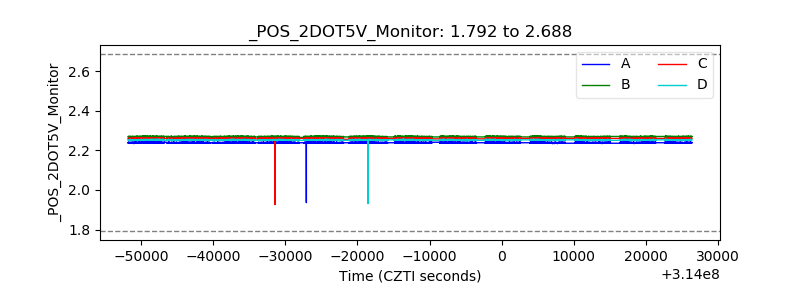 |
| +5 Volts monitor | 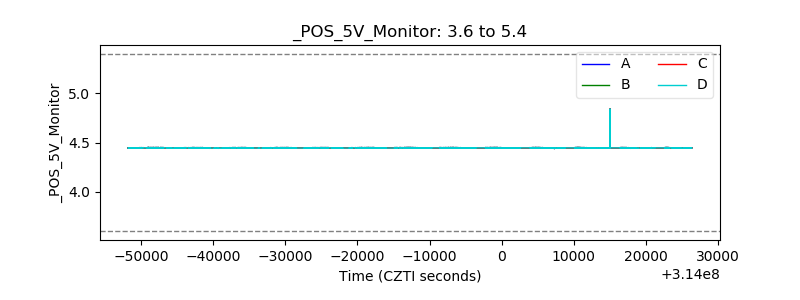 |
| _ROLL_ROT | 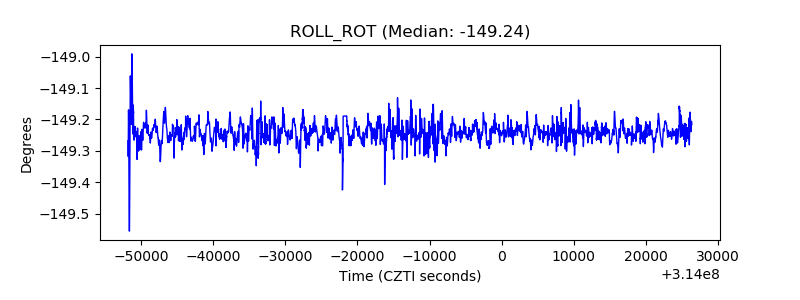 |
| _Roll_DEC | 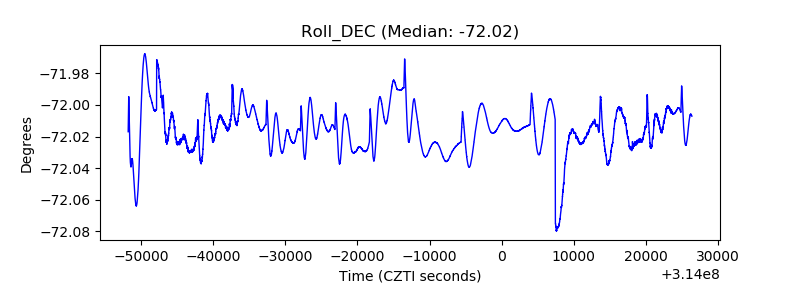 |
| _Roll_RA | 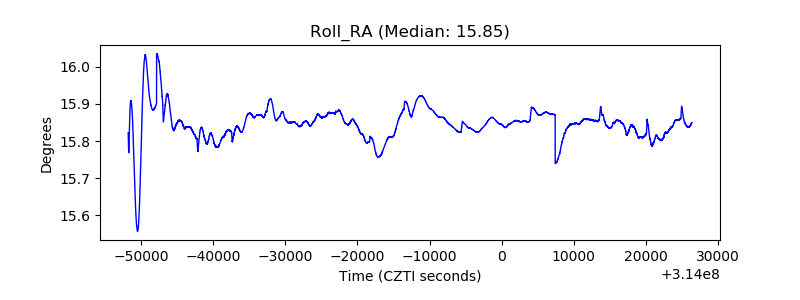 |
| Veto Counter |  |