| Param | Original file | Final file |
|---|---|---|
| Filename | modeM0/AS1C05_001T01_9000003366_22758cztM0_level2.evt | modeM0/AS1C05_001T01_9000003366_22758cztM0_level2_quad_clean.evt |
| Size (bytes) | 440,392,320 | 127,782,720 |
| Size | 420.0 MB | 121.9 MB |
| Events in quadrant A | 3,065,528 | 874,044 |
| Events in quadrant B | 3,175,661 | 874,346 |
| Events in quadrant C | 3,076,533 | 836,058 |
| Events in quadrant D | 3,566,791 | 821,664 |
| Mode M9 | |||
|---|---|---|---|
| Quadrant | BADHDUFLAG | Total packets | Discarded packets |
| A | 0 | 3 | 0 |
| B | 0 | 3 | 0 |
| C | 0 | 3 | 0 |
| D | 0 | 3 | 0 |
| Mode SS | |||
|---|---|---|---|
| Quadrant | BADHDUFLAG | Total packets | Discarded packets |
| A | 0 | 136 | 0 |
| B | 0 | 136 | 0 |
| C | 0 | 136 | 0 |
| D | 0 | 136 | 0 |
| Mode M0 | |||
|---|---|---|---|
| Quadrant | BADHDUFLAG | Total packets | Discarded packets |
| A | 0 | 13620 | 1 |
| B | 0 | 13760 | 1 |
| C | 0 | 13640 | 1 |
| D | 0 | 15166 | 1 |
| Quadrant | Total seconds | Saturated seconds | Saturation percentage |
|---|---|---|---|
| A | 6657 | 36 | 0.540784% |
| B | 6657 | 55 | 0.826198% |
| C | 6656 | 59 | 0.886418% |
| D | 6656 | 122 | 1.832933% |
Noise dominated data is calculated using 1-second bins in cleaned event files. If a bin has >2000 counts, and if more than 50% of those come from <1% of pixels, then it is considered to be noise-dominated and hence unusable.
| Quadrant | # 1 sec bins | Bins with >0 counts | Bins with >2000 counts | High rate bins dominated by noise | Noise dominated (total time) | Noise dominated (detector-on time) | Marked lightcurve |
|---|---|---|---|---|---|---|---|
| A | 6967 | 6659 | 0 | 0 | 0.00% | 0.00% | 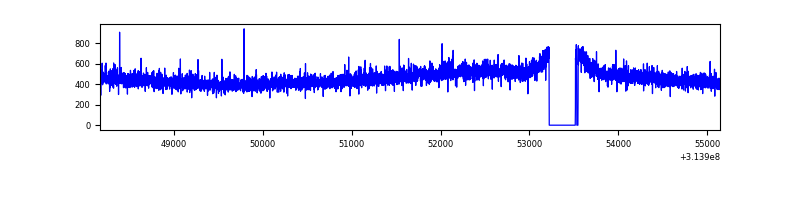 |
| B | 6967 | 6659 | 1 | 1 | 0.01% | 0.02% | 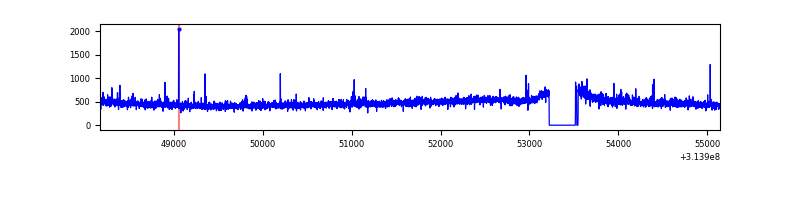 |
| C | 6966 | 6658 | 0 | 0 | 0.00% | 0.00% | 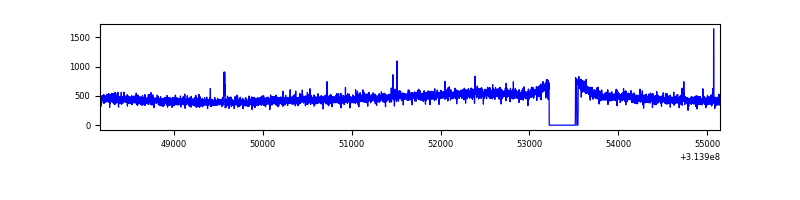 |
| D | 6966 | 6658 | 70 | 70 | 1.00% | 1.05% | 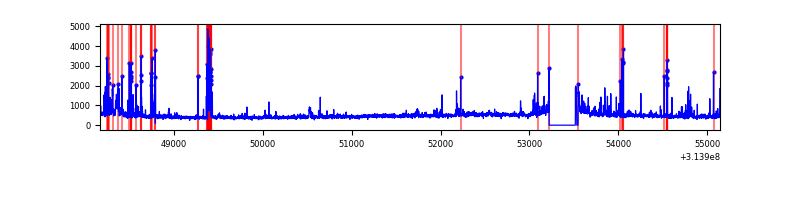 |
Top three noisy pixels from each quadrant. If the there are fewer than three noisy pixels in the level2.evt file, extra rows are filled as -1
| Pixel properties | Quadrant properties | ||||||
|---|---|---|---|---|---|---|---|
| Quadrant | DetID | PixID | Counts | Sigma | Mean | Median | Sigma |
| A | 13 | 252 | 13522 | 80.7 | 791 | 775 | 157.9 |
| A | 13 | 254 | 11831 | 70.0 | 791 | 775 | 157.9 |
| A | 0 | 226 | 6899 | 38.77 | 791 | 775 | 157.9 |
| B | 0 | 230 | 29338 | 192.48 | 788 | 769 | 148.4 |
| B | 12 | 111 | 17195 | 110.67 | 788 | 769 | 148.4 |
| B | 11 | 111 | 14790 | 94.47 | 788 | 769 | 148.4 |
| C | 14 | 238 | 119634 | 675.08 | 754 | 756 | 176.1 |
| C | 10 | 22 | 9706 | 50.82 | 754 | 756 | 176.1 |
| C | 13 | 61 | 5444 | 26.62 | 754 | 756 | 176.1 |
| D | 1 | 52 | 251185 | 1356.01 | 762 | 740 | 184.7 |
| D | 7 | 238 | 158291 | 853.04 | 762 | 740 | 184.7 |
| D | 2 | 152 | 71203 | 381.51 | 762 | 740 | 184.7 |
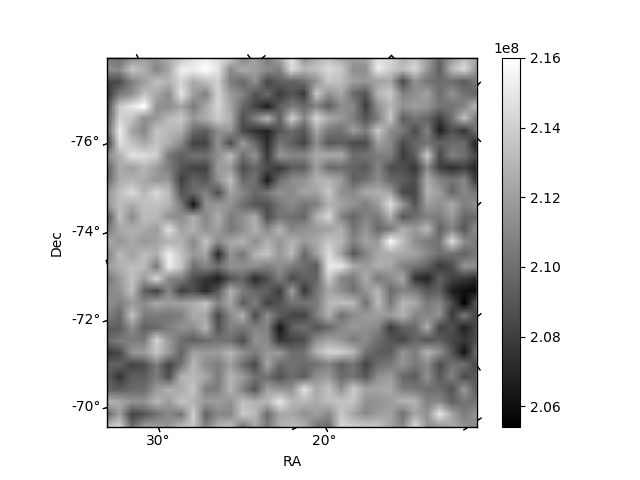
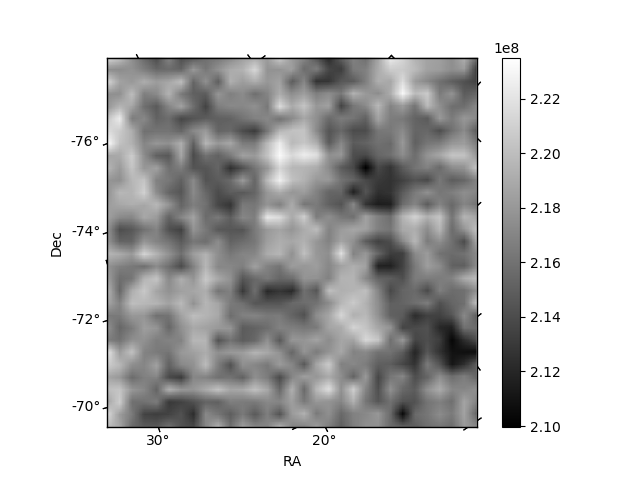
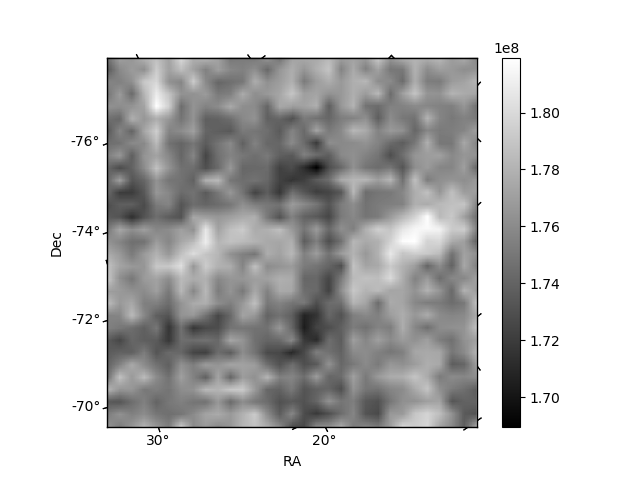
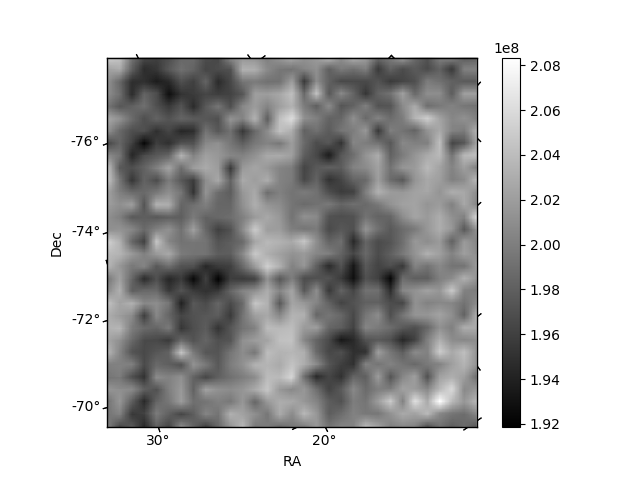
Histogram calculated using DETX and DETY for each event in the final _common_clean file
| Quadrant A |  |
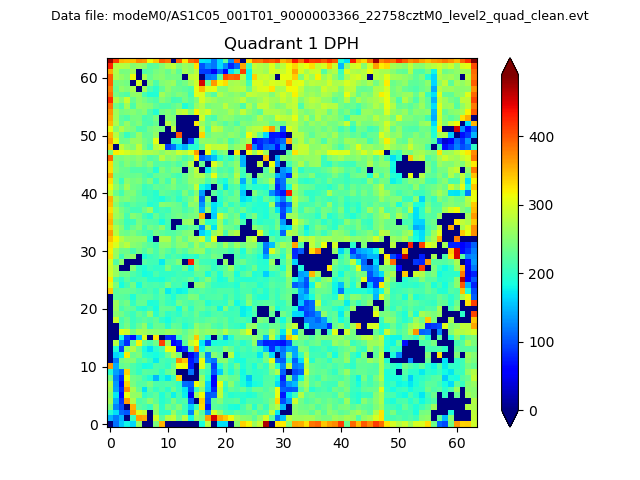 |
Quadrant B |
|---|---|---|---|
| Quadrant D |  |
 |
Quadrant C |
| Plot type | Count rate plots | Images |
|---|---|---|
| Comparison with Poisson distribution Blue bars denote a histogram of data divided into 1 sec bins. Red curve is a Poisson curve with rate = median count rate of data. |
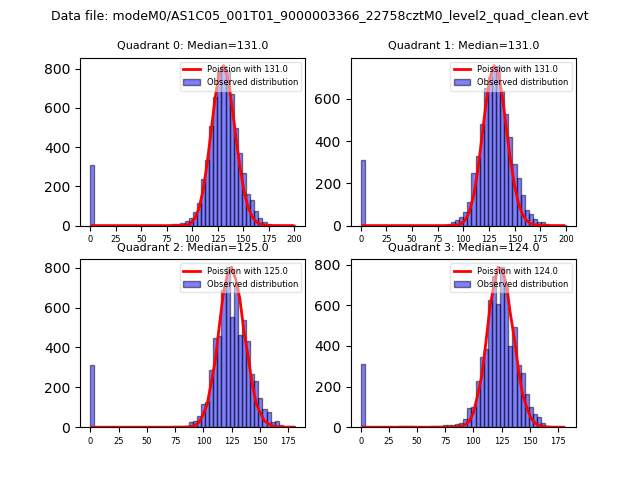 |
 |
| Quadrant-wise count rates Data is divided into 100 sec bins |
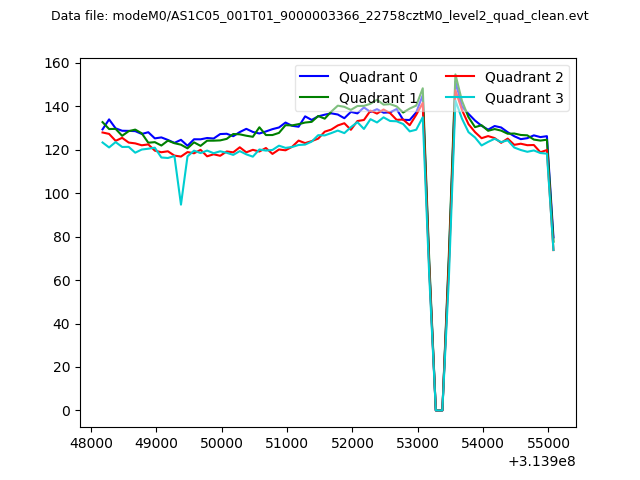 |
|
| Module-wise count rates for Quadrant A Data is divided into 100 sec bins |
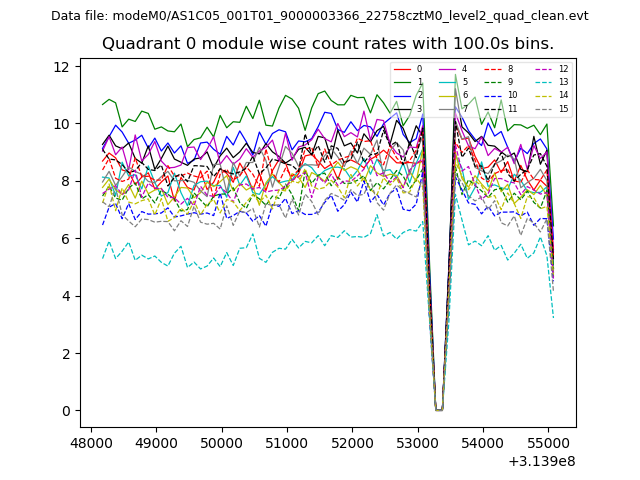 |
 |
| Module-wise count rates for Quadrant B Data is divided into 100 sec bins |
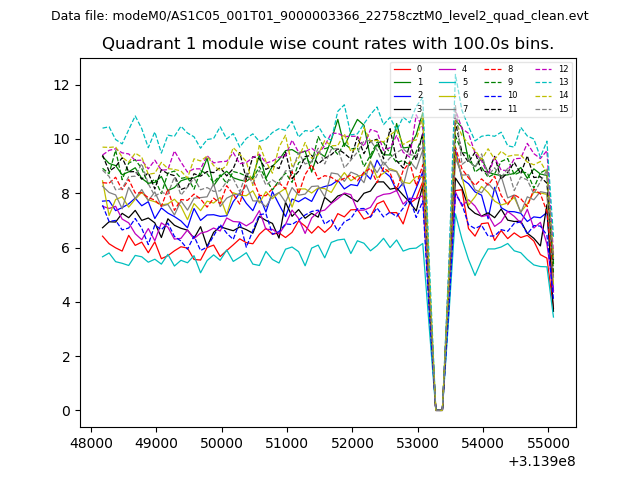 |
 |
| Module-wise count rates for Quadrant C Data is divided into 100 sec bins |
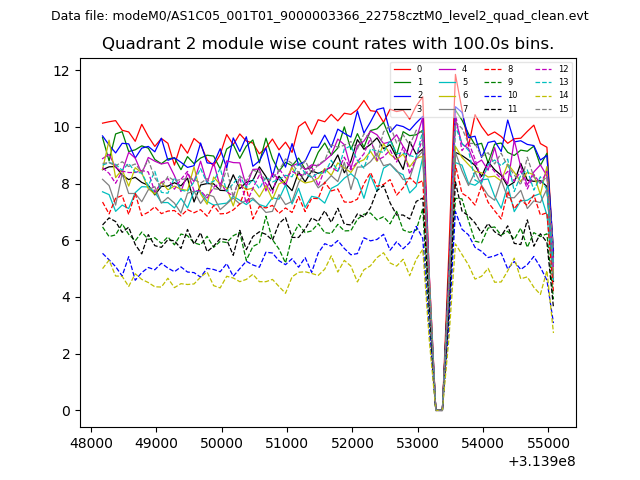 |
 |
| Module-wise count rates for Quadrant D Data is divided into 100 sec bins |
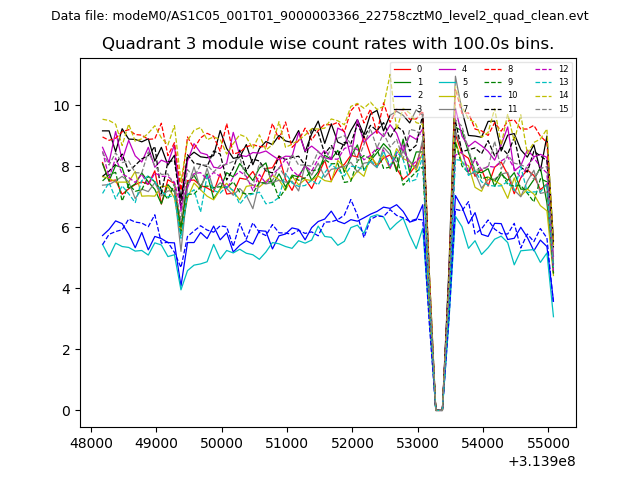 |
 |
| Parameter | Plot |
|---|---|
| CZT HV Monitor | 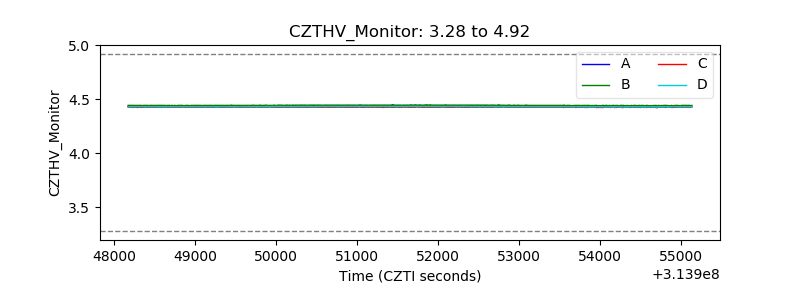 |
| D_VDD | 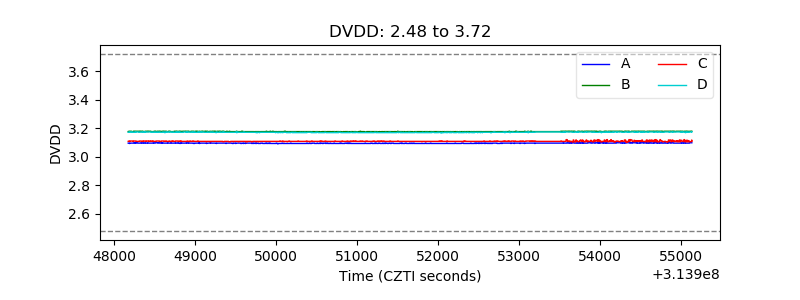 |
| Temperature 1 | 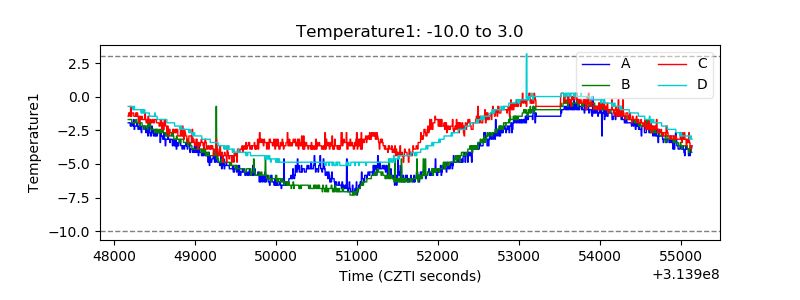 |
| Veto HV Monitor | 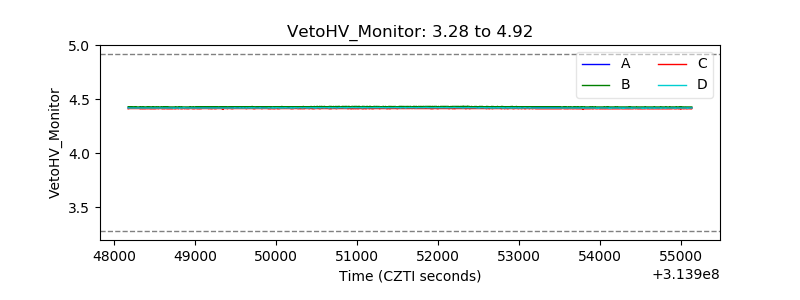 |
| Veto LLD | 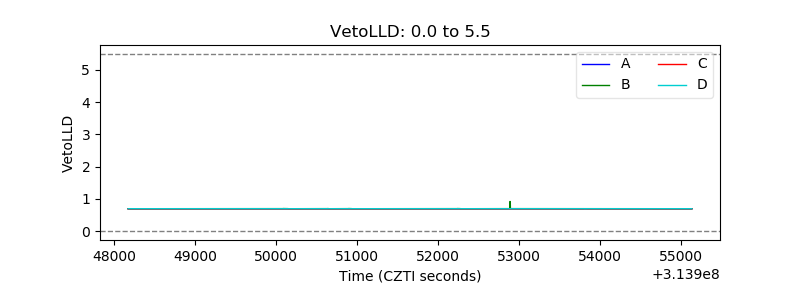 |
| Alpha Counter | 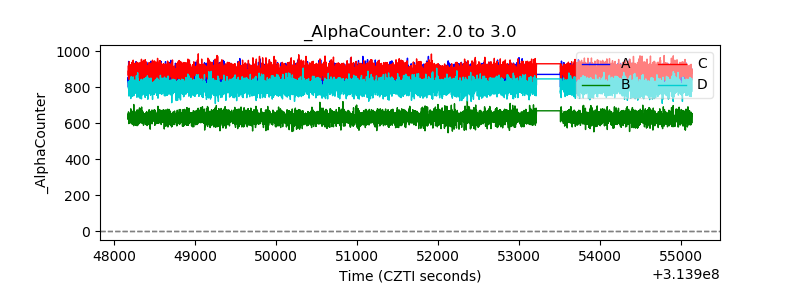 |
| _CPM_Rate | 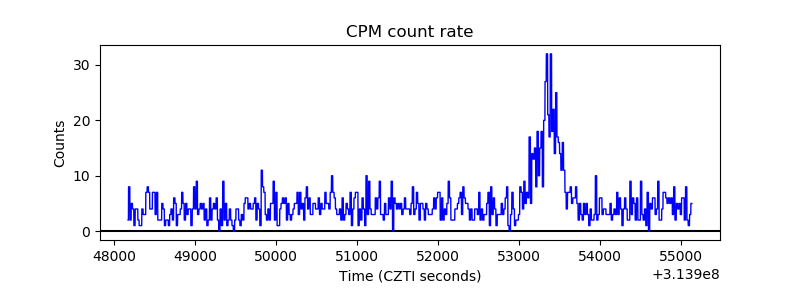 |
| CZT Counter |  |
| +2.5 Volts monitor |  |
| +5 Volts monitor | 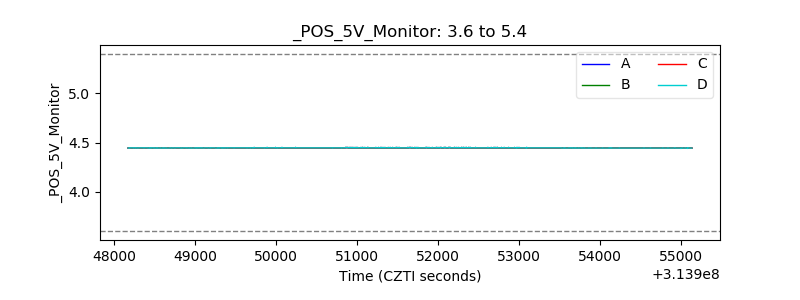 |
| _ROLL_ROT | 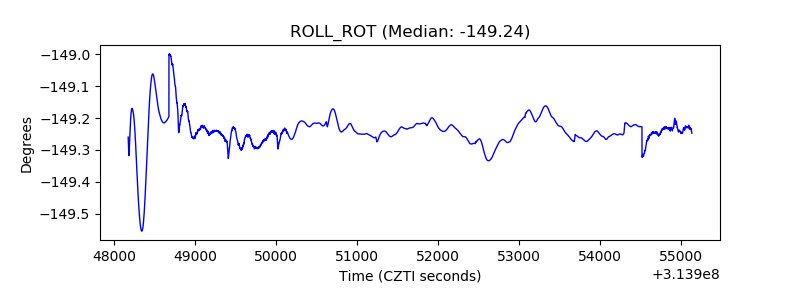 |
| _Roll_DEC | 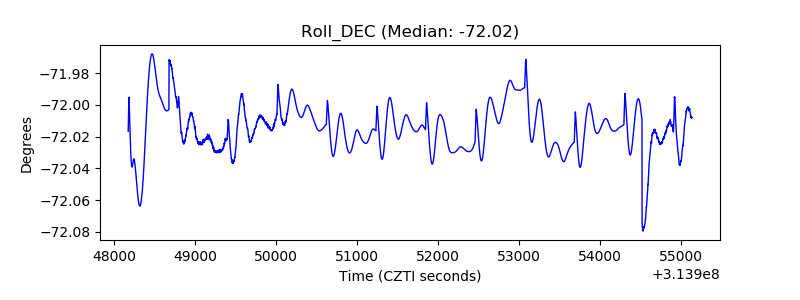 |
| _Roll_RA | 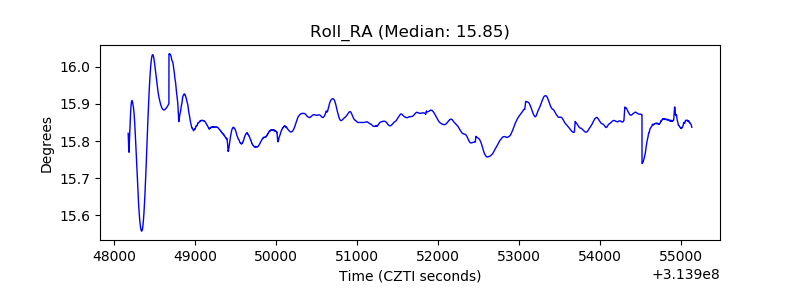 |
| Veto Counter | 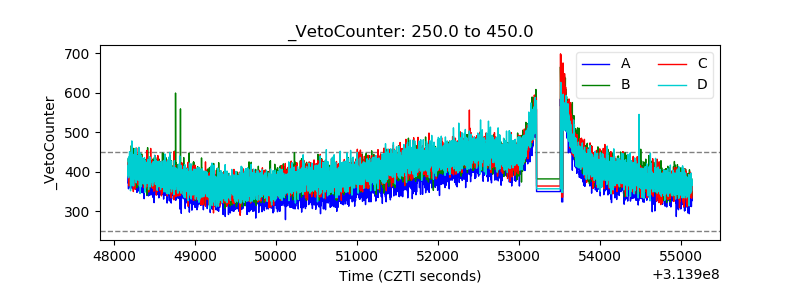 |