| Param | Original file | Final file |
|---|---|---|
| Filename | modeM0/AS1C05_001T01_9000003366_22759cztM0_level2.evt | modeM0/AS1C05_001T01_9000003366_22759cztM0_level2_quad_clean.evt |
| Size (bytes) | 505,857,600 | 144,702,720 |
| Size | 482.4 MB | 138.0 MB |
| Events in quadrant A | 3,521,742 | 987,966 |
| Events in quadrant B | 3,672,984 | 991,161 |
| Events in quadrant C | 3,529,075 | 944,681 |
| Events in quadrant D | 4,079,213 | 929,768 |
| Mode M9 | |||
|---|---|---|---|
| Quadrant | BADHDUFLAG | Total packets | Discarded packets |
| A | 0 | 4 | 0 |
| B | 0 | 5 | 0 |
| C | 0 | 5 | 0 |
| D | 0 | 5 | 0 |
| Mode SS | |||
|---|---|---|---|
| Quadrant | BADHDUFLAG | Total packets | Discarded packets |
| A | 0 | 156 | 0 |
| B | 0 | 156 | 0 |
| C | 0 | 156 | 0 |
| D | 0 | 156 | 0 |
| Mode M0 | |||
|---|---|---|---|
| Quadrant | BADHDUFLAG | Total packets | Discarded packets |
| A | 0 | 15592 | 2 |
| B | 0 | 15910 | 2 |
| C | 0 | 15610 | 2 |
| D | 0 | 17378 | 2 |
| Quadrant | Total seconds | Saturated seconds | Saturation percentage |
|---|---|---|---|
| A | 7610 | 44 | 0.578187% |
| B | 7610 | 73 | 0.959264% |
| C | 7610 | 82 | 1.077530% |
| D | 7610 | 109 | 1.432326% |
Noise dominated data is calculated using 1-second bins in cleaned event files. If a bin has >2000 counts, and if more than 50% of those come from <1% of pixels, then it is considered to be noise-dominated and hence unusable.
| Quadrant | # 1 sec bins | Bins with >0 counts | Bins with >2000 counts | High rate bins dominated by noise | Noise dominated (total time) | Noise dominated (detector-on time) | Marked lightcurve |
|---|---|---|---|---|---|---|---|
| A | 7855 | 7612 | 0 | 0 | 0.00% | 0.00% | 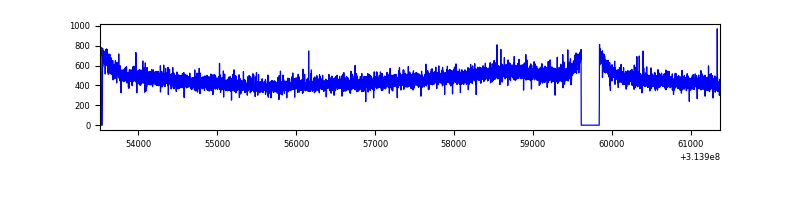 |
| B | 7855 | 7612 | 0 | 0 | 0.00% | 0.00% | 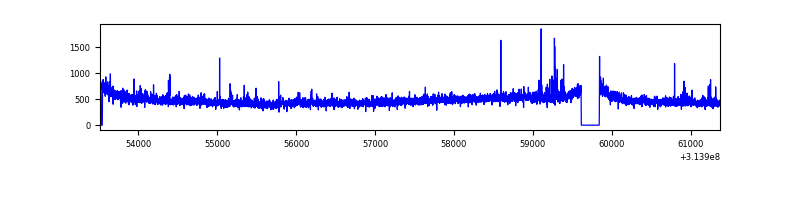 |
| C | 7855 | 7612 | 0 | 0 | 0.00% | 0.00% | 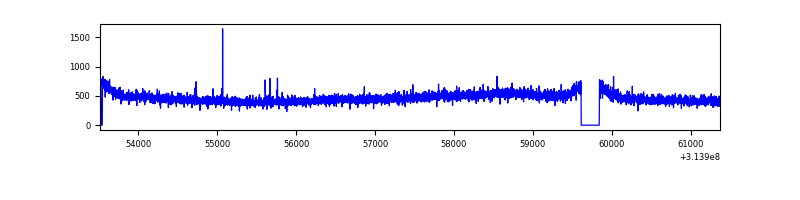 |
| D | 7855 | 7612 | 61 | 61 | 0.78% | 0.80% | 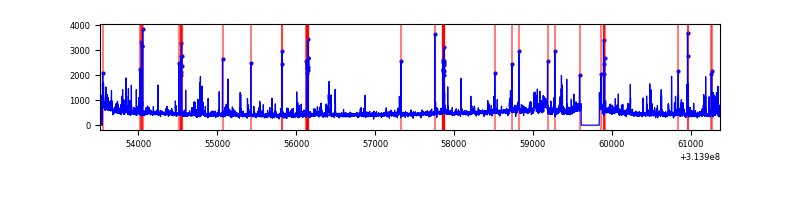 |
Top three noisy pixels from each quadrant. If the there are fewer than three noisy pixels in the level2.evt file, extra rows are filled as -1
| Pixel properties | Quadrant properties | ||||||
|---|---|---|---|---|---|---|---|
| Quadrant | DetID | PixID | Counts | Sigma | Mean | Median | Sigma |
| A | 13 | 254 | 14168 | 72.42 | 912 | 892 | 183.3 |
| A | 0 | 226 | 8006 | 38.81 | 912 | 892 | 183.3 |
| A | 3 | 137 | 7514 | 36.12 | 912 | 892 | 183.3 |
| B | 0 | 230 | 42289 | 243.3 | 906 | 884 | 170.2 |
| B | 0 | 245 | 30980 | 176.85 | 906 | 884 | 170.2 |
| B | 0 | 190 | 29857 | 170.25 | 906 | 884 | 170.2 |
| C | 14 | 238 | 135789 | 670.55 | 863 | 864 | 201.2 |
| C | 8 | 128 | 10620 | 48.49 | 863 | 864 | 201.2 |
| C | 10 | 22 | 7851 | 34.72 | 863 | 864 | 201.2 |
| D | 2 | 152 | 211716 | 991.64 | 874 | 845 | 212.6 |
| D | 1 | 52 | 206931 | 969.14 | 874 | 845 | 212.6 |
| D | 12 | 227 | 93330 | 434.92 | 874 | 845 | 212.6 |
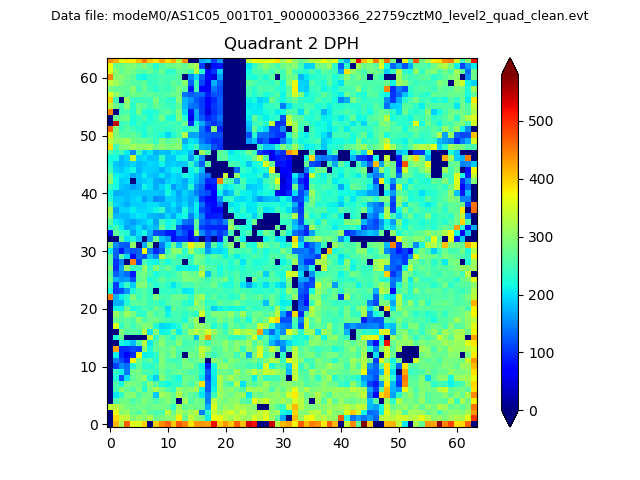
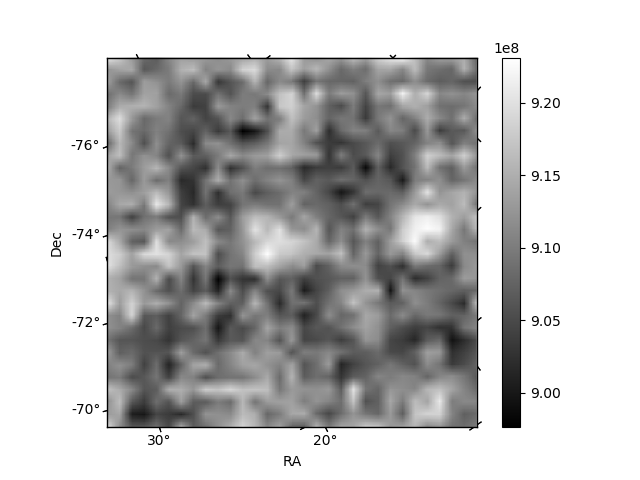
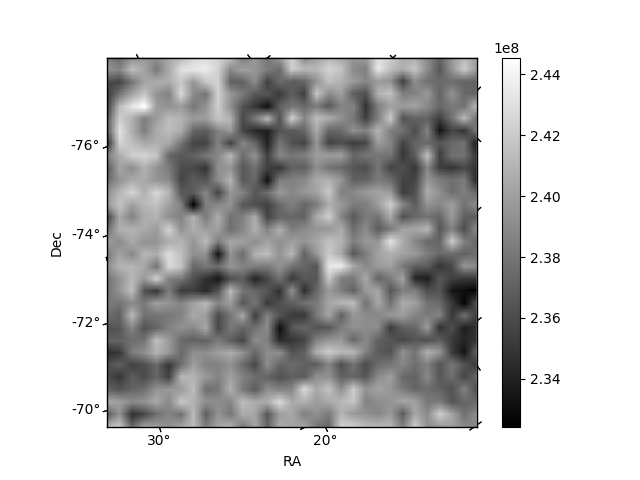
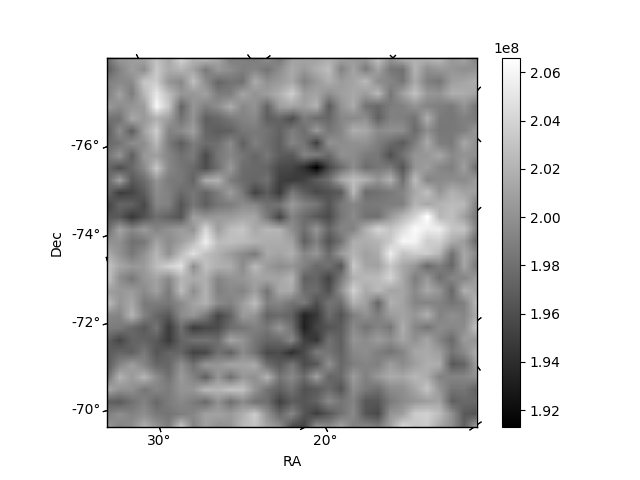
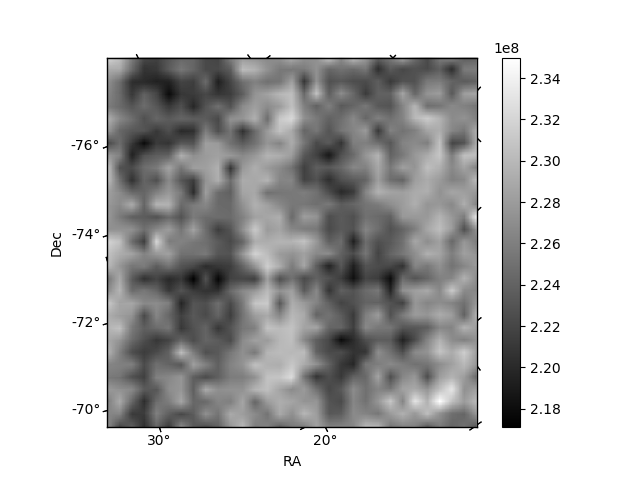
Histogram calculated using DETX and DETY for each event in the final _common_clean file
| Quadrant A | 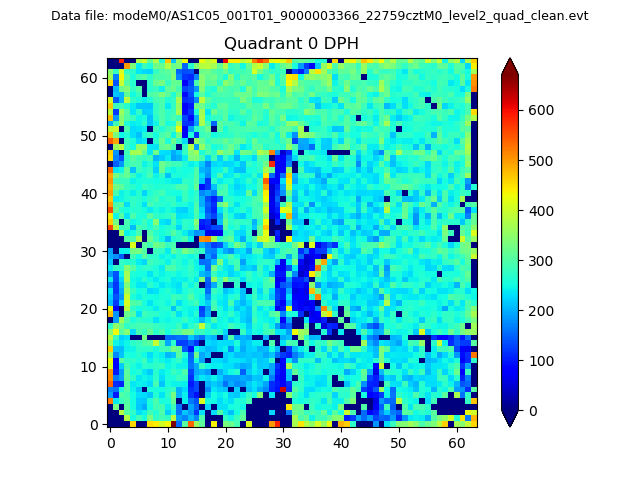 |
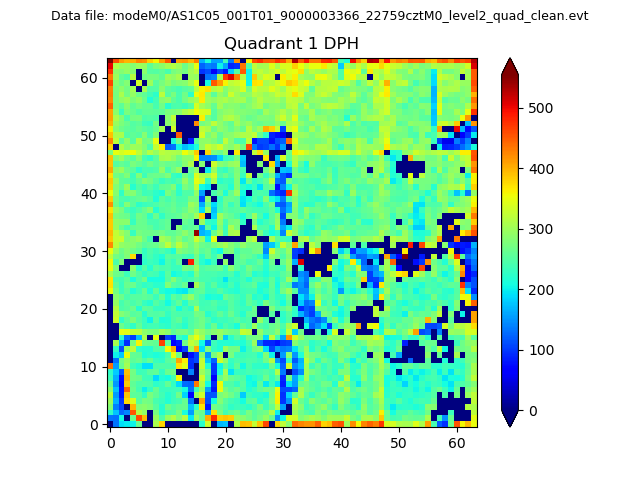 |
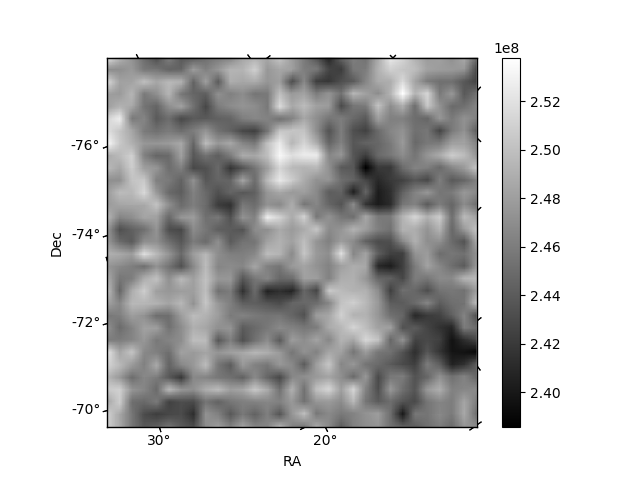
Quadrant B |
|---|---|---|---|
| Quadrant D | 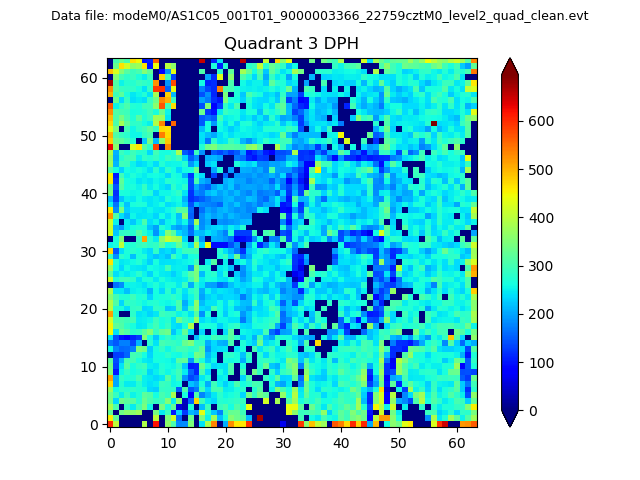 |
 |
Quadrant C |
| Plot type | Count rate plots | Images |
|---|---|---|
| Comparison with Poisson distribution Blue bars denote a histogram of data divided into 1 sec bins. Red curve is a Poisson curve with rate = median count rate of data. |
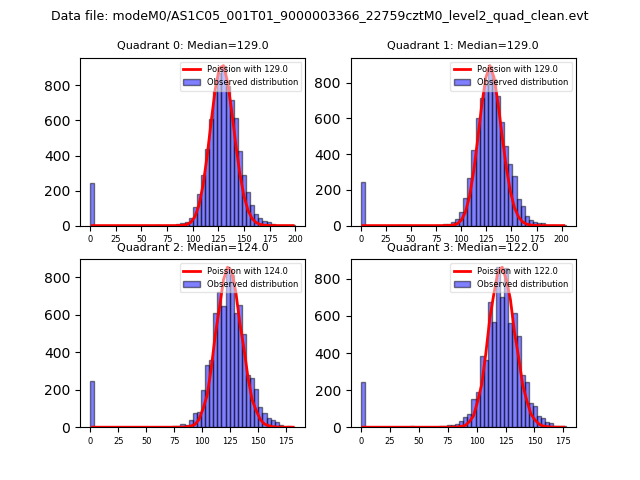 |
 |
| Quadrant-wise count rates Data is divided into 100 sec bins |
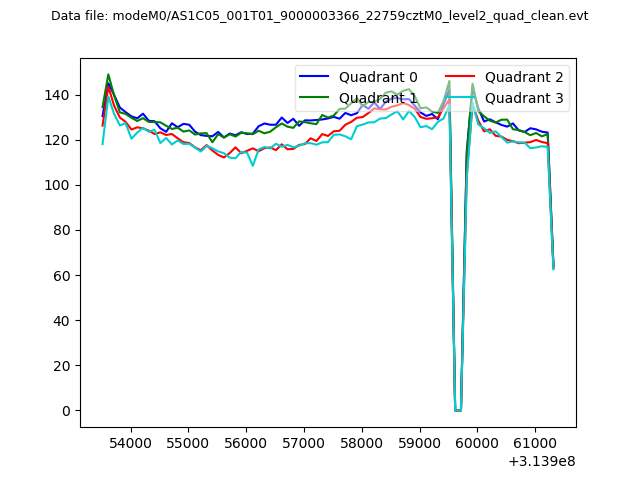 |
|
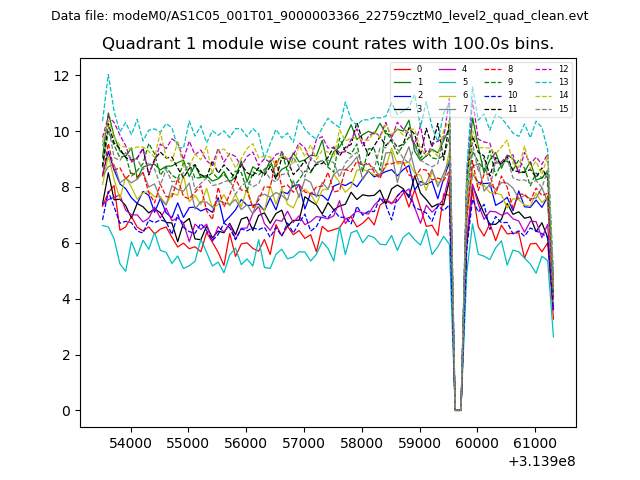
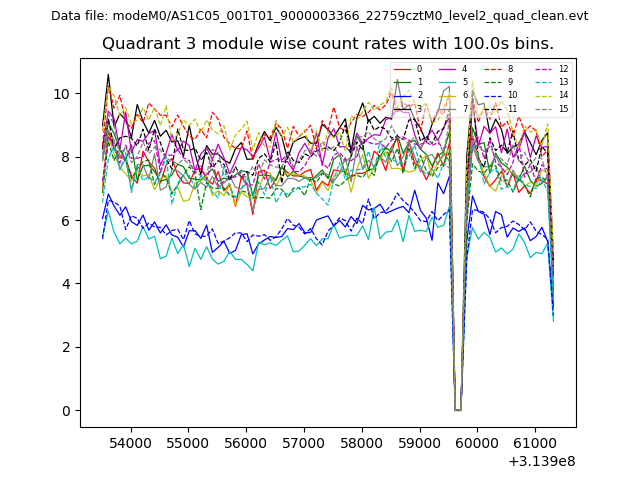
| Module-wise count rates for Quadrant A Data is divided into 100 sec bins |
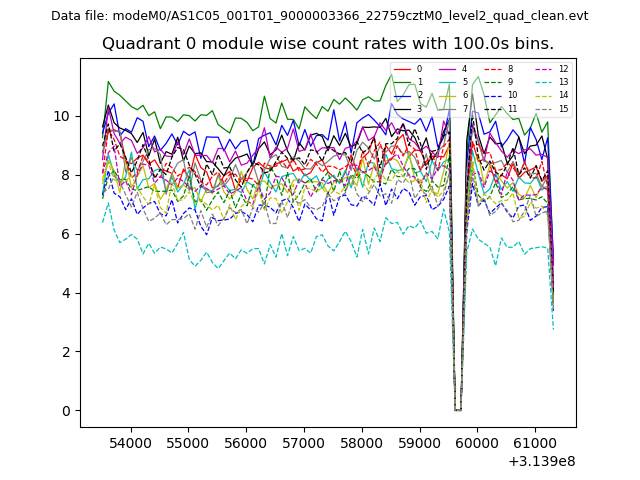 |
 |
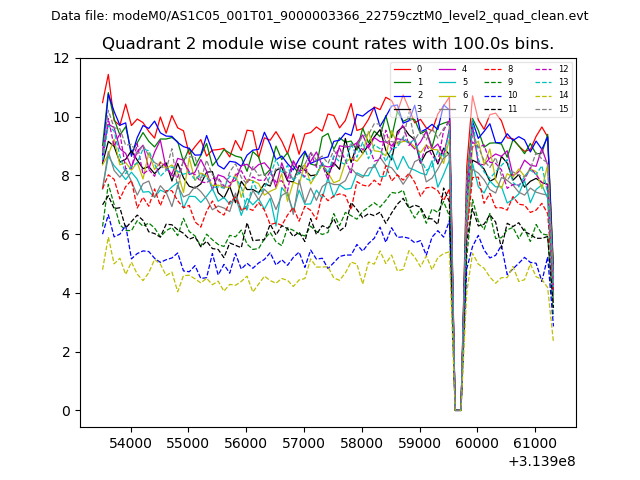
| Module-wise count rates for Quadrant B Data is divided into 100 sec bins |
 |
 |
| Module-wise count rates for Quadrant C Data is divided into 100 sec bins |
 |
 |
| Module-wise count rates for Quadrant D Data is divided into 100 sec bins |
 |
 |
| Parameter | Plot |
|---|---|
| CZT HV Monitor | 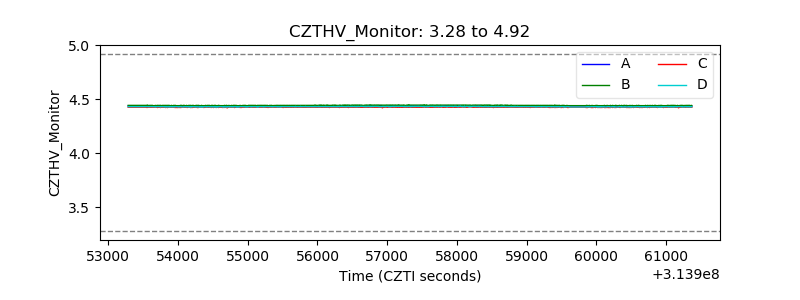 |
| D_VDD | 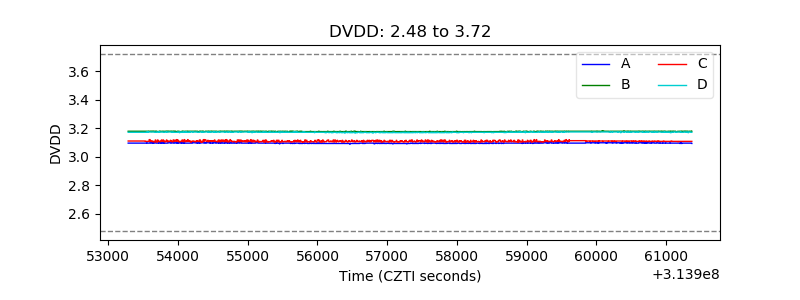 |
| Temperature 1 | 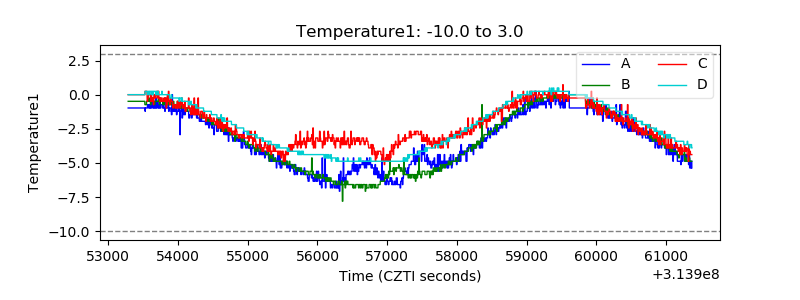 |
| Veto HV Monitor | 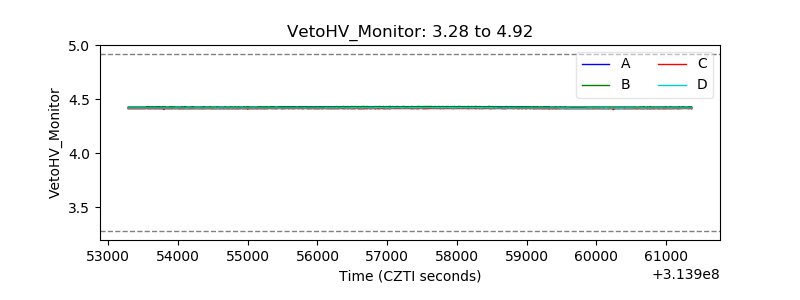 |
| Veto LLD | 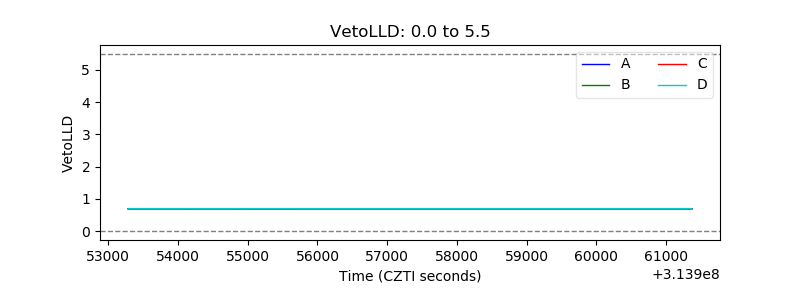 |
| Alpha Counter | 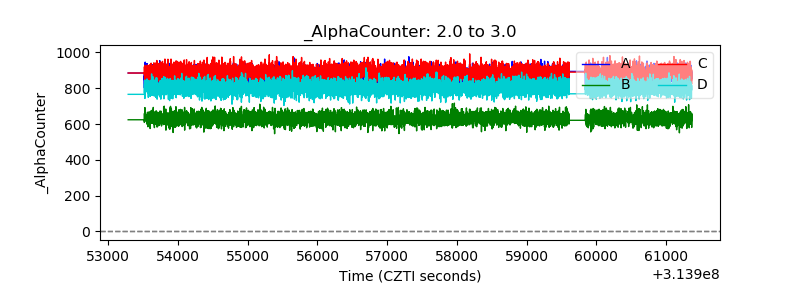 |
| _CPM_Rate | 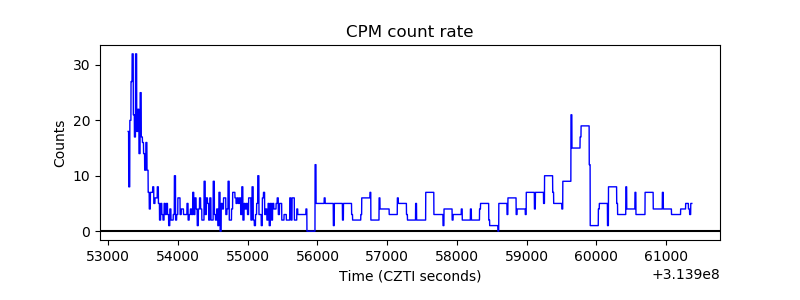 |
| CZT Counter | 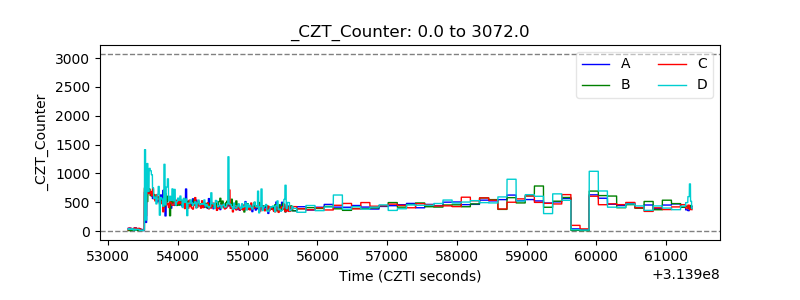 |
| +2.5 Volts monitor |  |
| +5 Volts monitor | 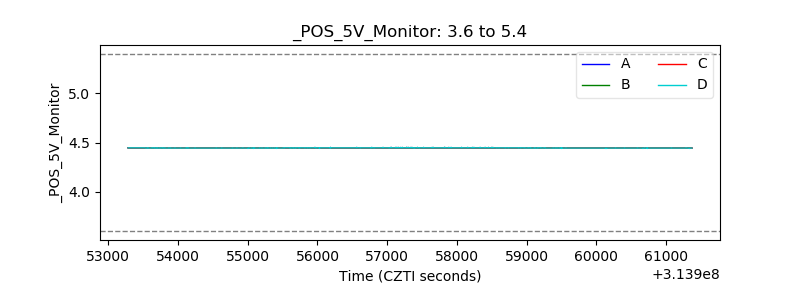 |
| _ROLL_ROT | 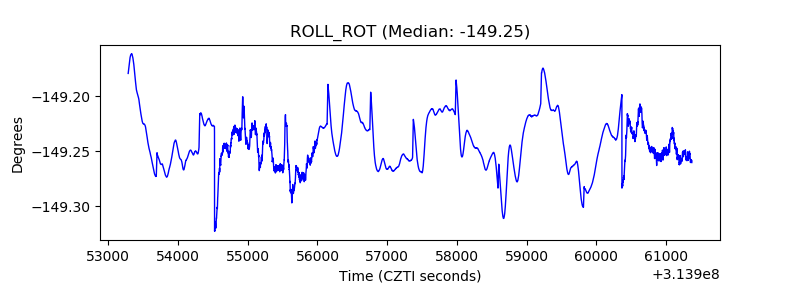 |
| _Roll_DEC | 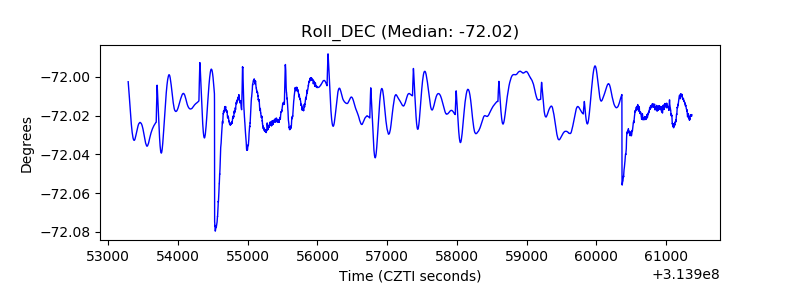 |
| _Roll_RA | 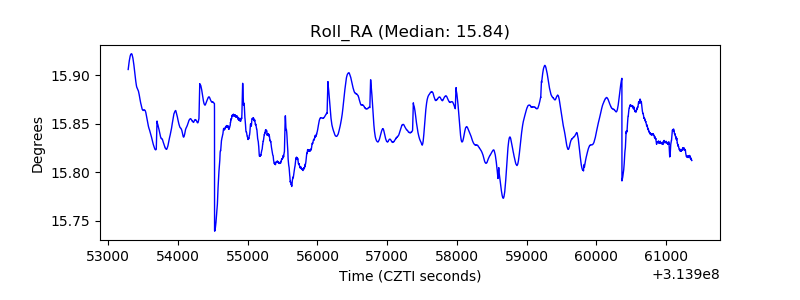 |
| Veto Counter | 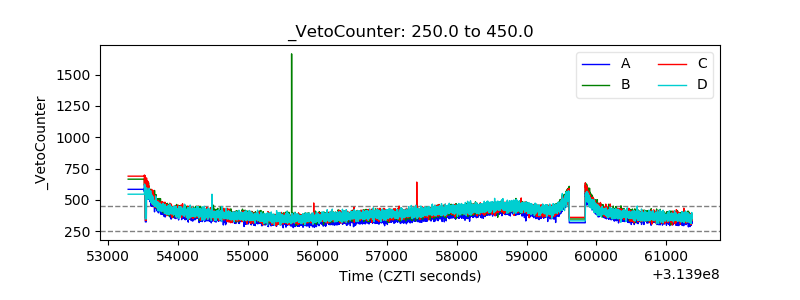 |