| Param | Original file | Final file |
|---|---|---|
| Filename | modeM0/AS1C05_001T01_9000003366_22760cztM0_level2.evt | modeM0/AS1C05_001T01_9000003366_22760cztM0_level2_quad_clean.evt |
| Size (bytes) | 481,438,080 | 136,244,160 |
| Size | 459.1 MB | 129.9 MB |
| Events in quadrant A | 3,312,250 | 928,826 |
| Events in quadrant B | 3,426,940 | 928,590 |
| Events in quadrant C | 3,340,790 | 887,089 |
| Events in quadrant D | 4,005,126 | 874,848 |
| Mode M9 | |||
|---|---|---|---|
| Quadrant | BADHDUFLAG | Total packets | Discarded packets |
| A | 0 | 4 | 0 |
| B | 0 | 4 | 0 |
| C | 0 | 4 | 0 |
| D | 0 | 4 | 0 |
| Mode SS | |||
|---|---|---|---|
| Quadrant | BADHDUFLAG | Total packets | Discarded packets |
| A | 0 | 148 | 0 |
| B | 0 | 148 | 0 |
| C | 0 | 148 | 0 |
| D | 0 | 148 | 0 |
| Mode M0 | |||
|---|---|---|---|
| Quadrant | BADHDUFLAG | Total packets | Discarded packets |
| A | 0 | 14768 | 1 |
| B | 0 | 14975 | 1 |
| C | 0 | 14867 | 1 |
| D | 0 | 17075 | 1 |
| Quadrant | Total seconds | Saturated seconds | Saturation percentage |
|---|---|---|---|
| A | 7288 | 31 | 0.425357% |
| B | 7288 | 41 | 0.562569% |
| C | 7288 | 54 | 0.740944% |
| D | 7288 | 75 | 1.029089% |
Noise dominated data is calculated using 1-second bins in cleaned event files. If a bin has >2000 counts, and if more than 50% of those come from <1% of pixels, then it is considered to be noise-dominated and hence unusable.
| Quadrant | # 1 sec bins | Bins with >0 counts | Bins with >2000 counts | High rate bins dominated by noise | Noise dominated (total time) | Noise dominated (detector-on time) | Marked lightcurve |
|---|---|---|---|---|---|---|---|
| A | 7703 | 7289 | 0 | 0 | 0.00% | 0.00% | 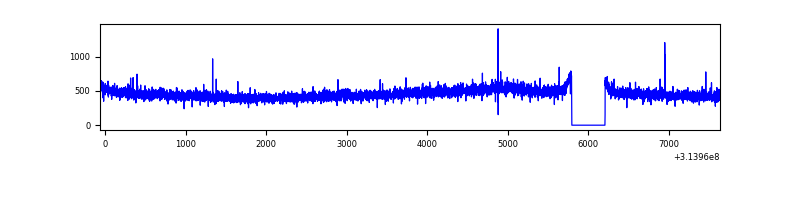 |
| B | 7703 | 7289 | 1 | 1 | 0.01% | 0.01% | 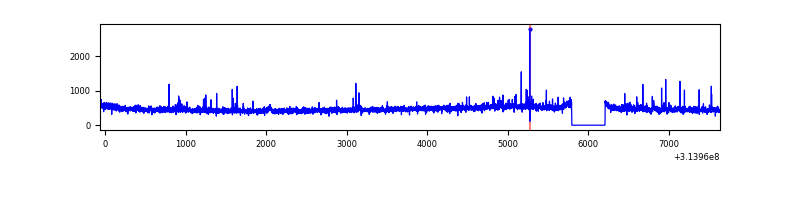 |
| C | 7703 | 7289 | 1 | 1 | 0.01% | 0.01% | 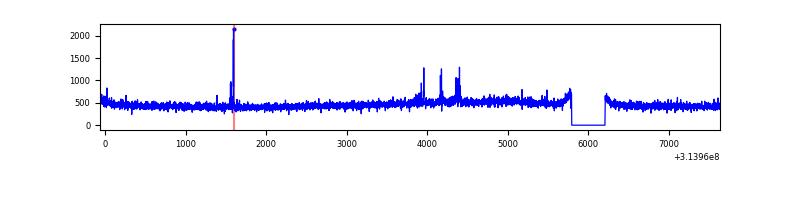 |
| D | 7703 | 7289 | 45 | 45 | 0.58% | 0.62% | 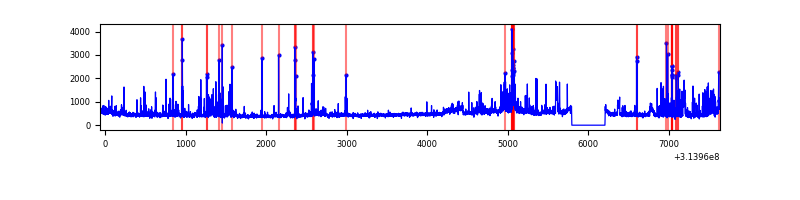 |
Top three noisy pixels from each quadrant. If the there are fewer than three noisy pixels in the level2.evt file, extra rows are filled as -1
| Pixel properties | Quadrant properties | ||||||
|---|---|---|---|---|---|---|---|
| Quadrant | DetID | PixID | Counts | Sigma | Mean | Median | Sigma |
| A | 13 | 254 | 13298 | 71.87 | 856 | 837 | 173.4 |
| A | 0 | 226 | 7409 | 37.9 | 856 | 837 | 173.4 |
| A | 3 | 137 | 7328 | 37.44 | 856 | 837 | 173.4 |
| B | 0 | 190 | 28599 | 171.34 | 854 | 835 | 162.0 |
| B | 12 | 111 | 18787 | 110.79 | 854 | 835 | 162.0 |
| B | 0 | 245 | 17558 | 103.2 | 854 | 835 | 162.0 |
| C | 14 | 238 | 128239 | 671.42 | 812 | 813 | 189.8 |
| C | 10 | 22 | 43124 | 222.94 | 812 | 813 | 189.8 |
| C | 13 | 61 | 5761 | 26.07 | 812 | 813 | 189.8 |
| D | 1 | 52 | 291697 | 1445.78 | 825 | 798 | 201.2 |
| D | 12 | 227 | 162763 | 804.97 | 825 | 798 | 201.2 |
| D | 2 | 152 | 151812 | 750.54 | 825 | 798 | 201.2 |
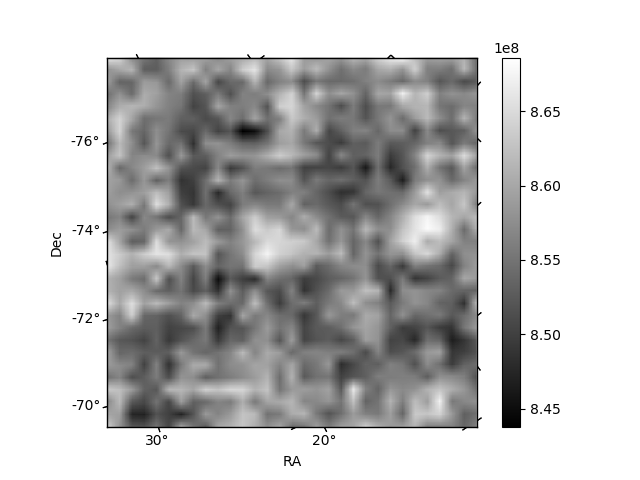
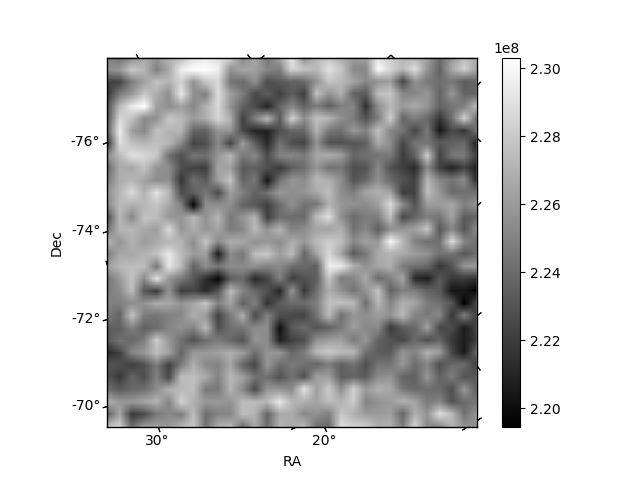
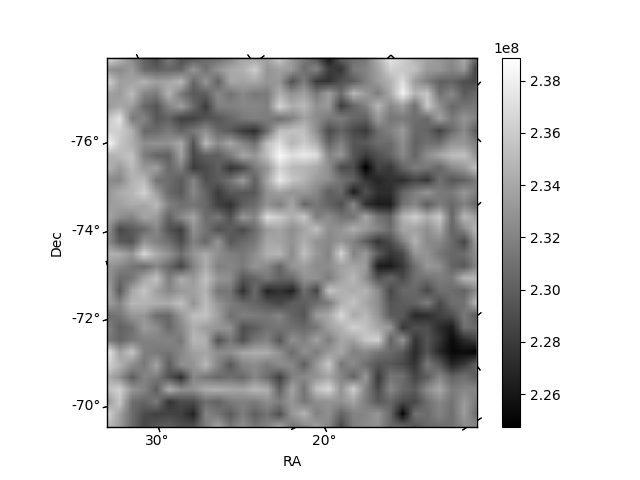
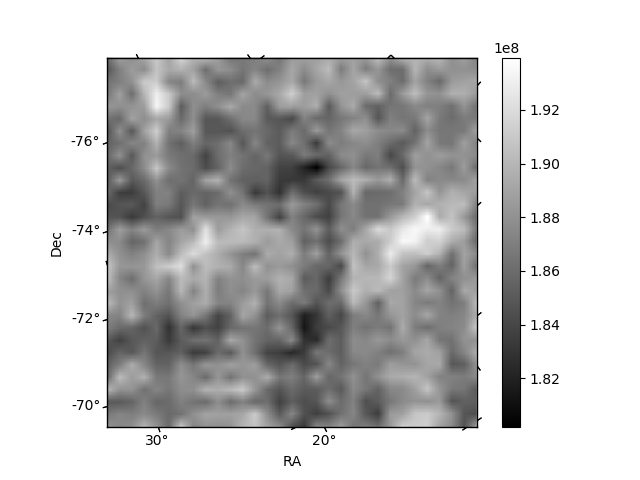
Histogram calculated using DETX and DETY for each event in the final _common_clean file
| Quadrant A | 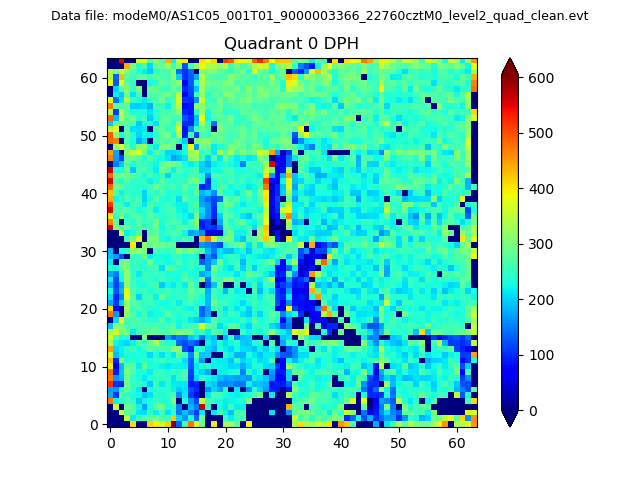 |
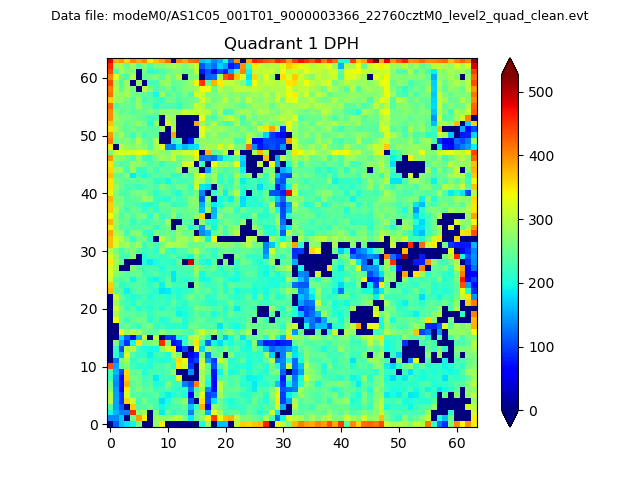 |
Quadrant B |
|---|---|---|---|
| Quadrant D |  |
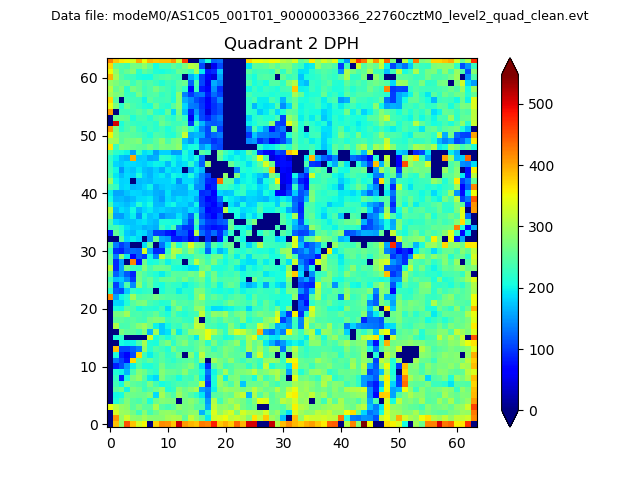 |
Quadrant C |
| Plot type | Count rate plots | Images |
|---|---|---|
| Comparison with Poisson distribution Blue bars denote a histogram of data divided into 1 sec bins. Red curve is a Poisson curve with rate = median count rate of data. |
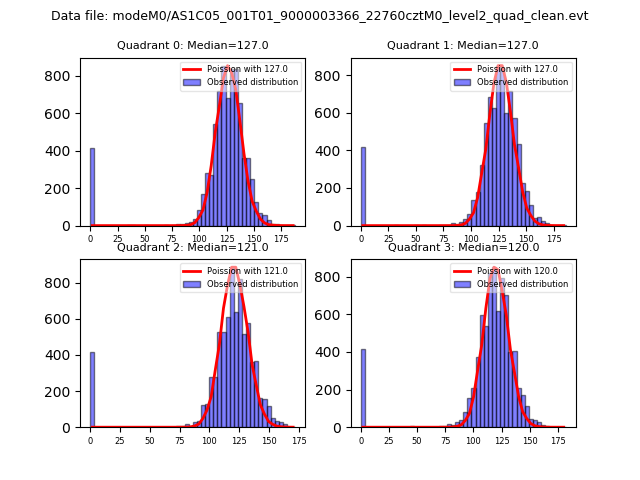 |
 |
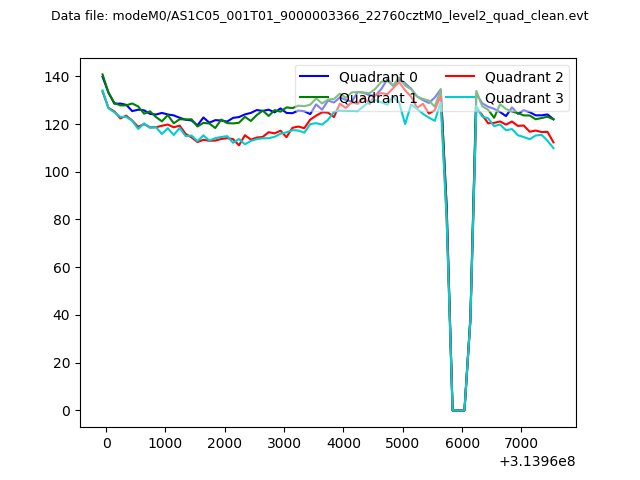
| Quadrant-wise count rates Data is divided into 100 sec bins |
 |
|
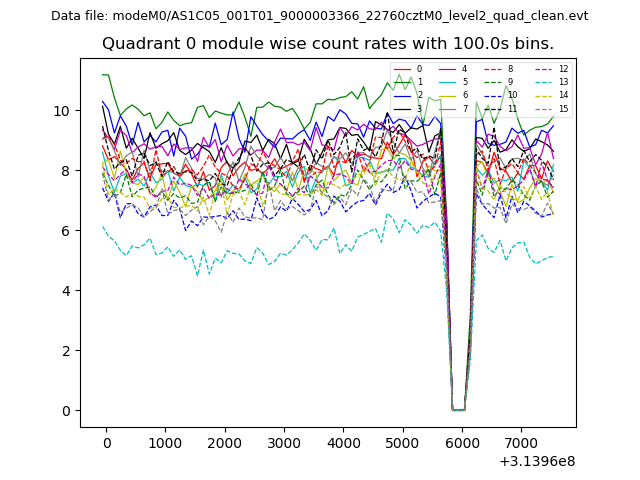
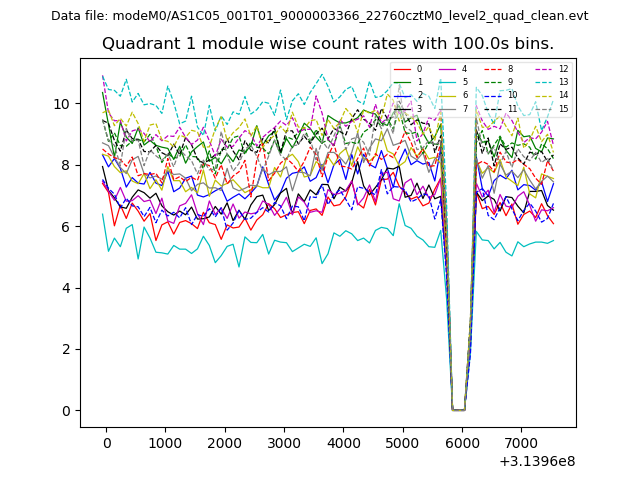
| Module-wise count rates for Quadrant A Data is divided into 100 sec bins |
 |
 |
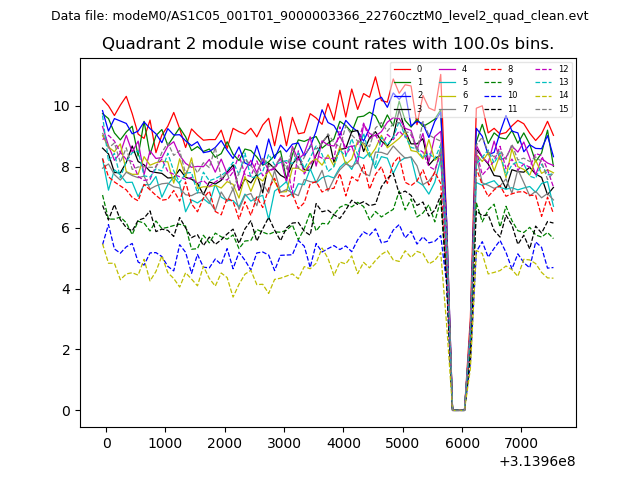
| Module-wise count rates for Quadrant B Data is divided into 100 sec bins |
 |
 |
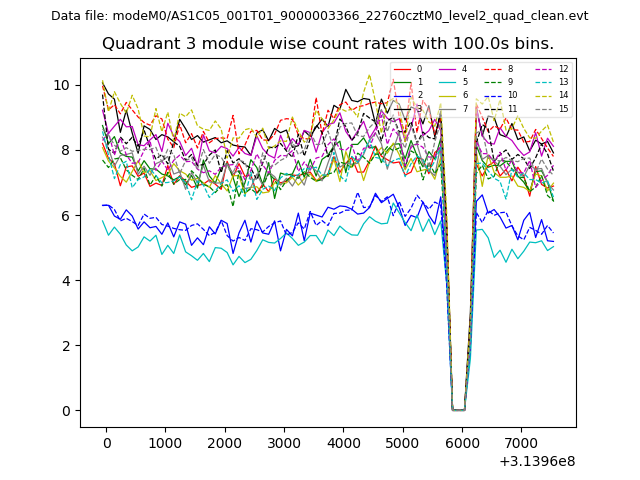
| Module-wise count rates for Quadrant C Data is divided into 100 sec bins |
 |
 |
| Module-wise count rates for Quadrant D Data is divided into 100 sec bins |
 |
 |
| Parameter | Plot |
|---|---|
| CZT HV Monitor |  |
| D_VDD |  |
| Temperature 1 | 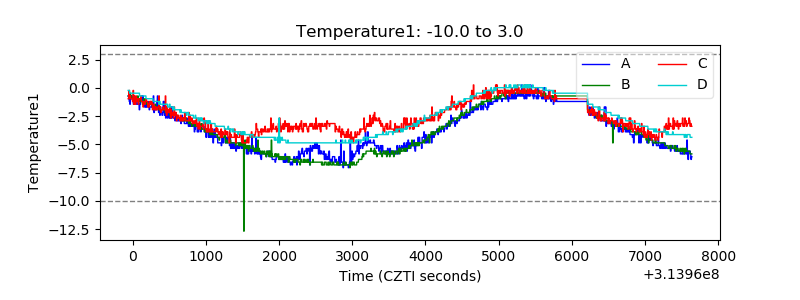 |
| Veto HV Monitor | 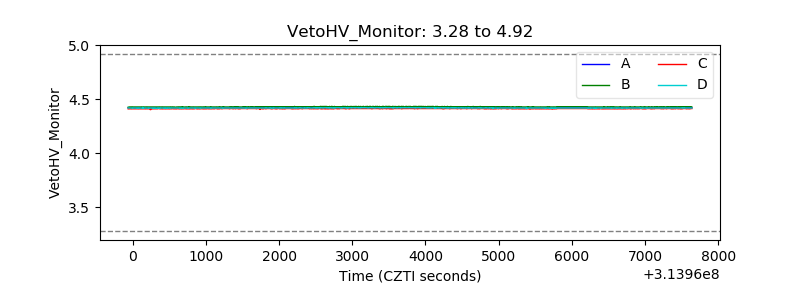 |
| Veto LLD | 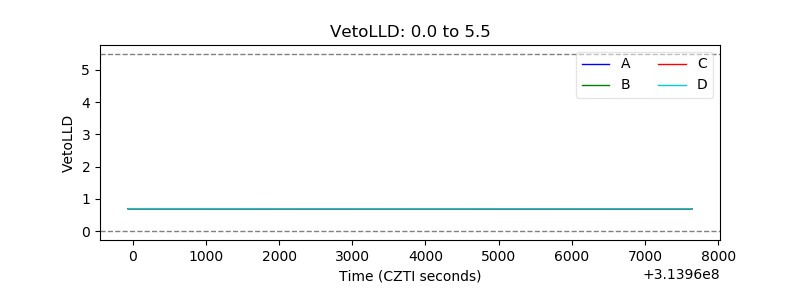 |
| Alpha Counter | 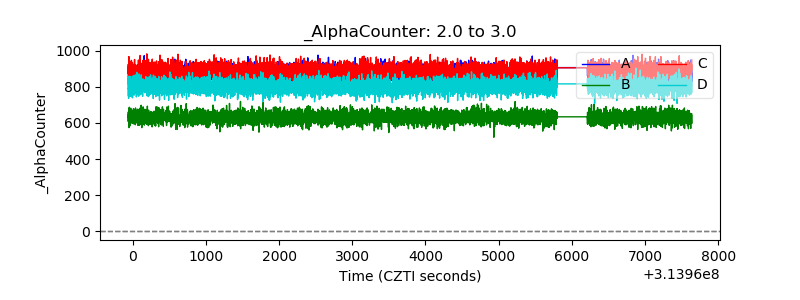 |
| _CPM_Rate | 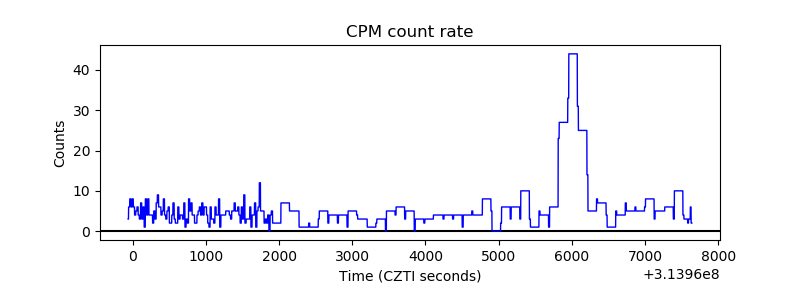 |
| CZT Counter | 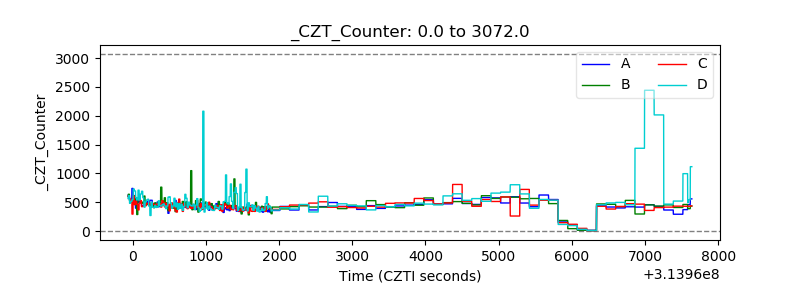 |
| +2.5 Volts monitor |  |
| +5 Volts monitor |  |
| _ROLL_ROT | 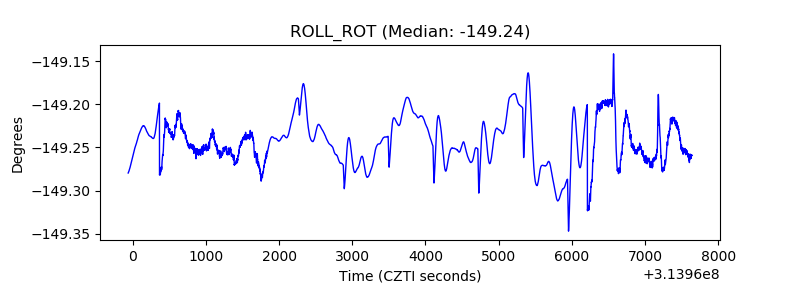 |
| _Roll_DEC | 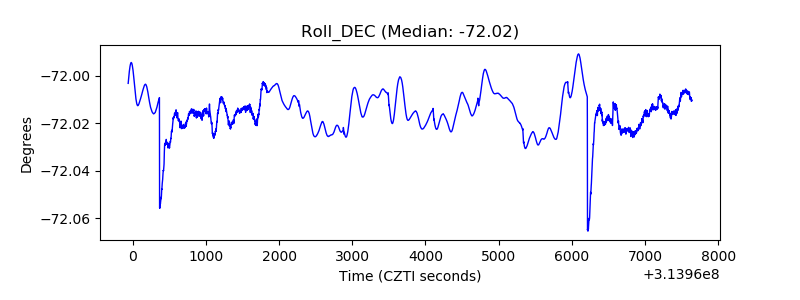 |
| _Roll_RA | 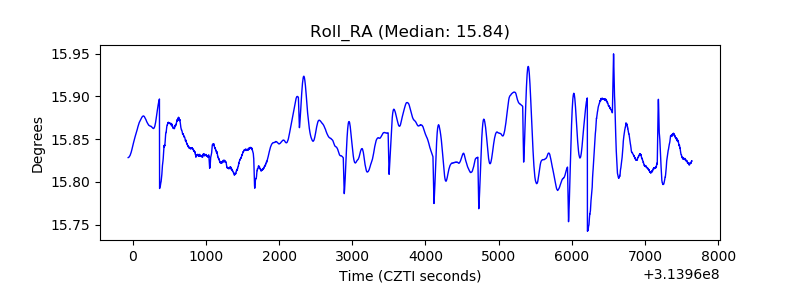 |
| Veto Counter | 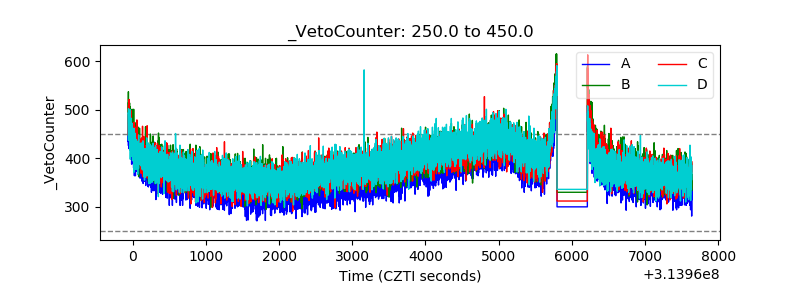 |