| Param | Original file | Final file |
|---|---|---|
| Filename | modeM0/AS1C05_001T01_9000003366_22762cztM0_level2.evt | modeM0/AS1C05_001T01_9000003366_22762cztM0_level2_quad_clean.evt |
| Size (bytes) | 889,997,760 | 239,667,840 |
| Size | 848.8 MB | 228.6 MB |
| Events in quadrant A | 5,872,368 | 1,642,819 |
| Events in quadrant B | 6,129,751 | 1,643,240 |
| Events in quadrant C | 5,948,125 | 1,566,462 |
| Events in quadrant D | 8,131,164 | 1,516,846 |
| Mode M9 | |||
|---|---|---|---|
| Quadrant | BADHDUFLAG | Total packets | Discarded packets |
| A | 0 | 18 | 0 |
| B | 0 | 18 | 0 |
| C | 0 | 18 | 0 |
| D | 0 | 18 | 0 |
| Mode SS | |||
|---|---|---|---|
| Quadrant | BADHDUFLAG | Total packets | Discarded packets |
| A | 0 | 262 | 0 |
| B | 0 | 262 | 0 |
| C | 0 | 262 | 0 |
| D | 0 | 262 | 0 |
| Mode M0 | |||
|---|---|---|---|
| Quadrant | BADHDUFLAG | Total packets | Discarded packets |
| A | 0 | 26094 | 3 |
| B | 0 | 26616 | 3 |
| C | 0 | 26145 | 3 |
| D | 0 | 33161 | 3 |
| Quadrant | Total seconds | Saturated seconds | Saturation percentage |
|---|---|---|---|
| A | 12886 | 59 | 0.457861% |
| B | 12887 | 84 | 0.651820% |
| C | 12887 | 114 | 0.884612% |
| D | 12887 | 483 | 3.747963% |
Noise dominated data is calculated using 1-second bins in cleaned event files. If a bin has >2000 counts, and if more than 50% of those come from <1% of pixels, then it is considered to be noise-dominated and hence unusable.
| Quadrant | # 1 sec bins | Bins with >0 counts | Bins with >2000 counts | High rate bins dominated by noise | Noise dominated (total time) | Noise dominated (detector-on time) | Marked lightcurve |
|---|---|---|---|---|---|---|---|
| A | 14671 | 12889 | 0 | 0 | 0.00% | 0.00% | 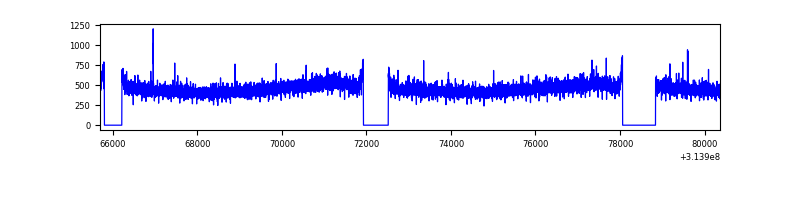 |
| B | 14672 | 12890 | 3 | 3 | 0.02% | 0.02% | 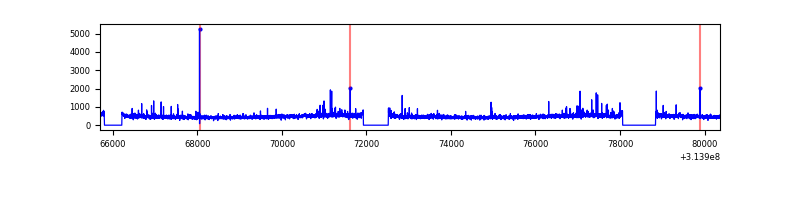 |
| C | 14672 | 12890 | 1 | 1 | 0.01% | 0.01% | 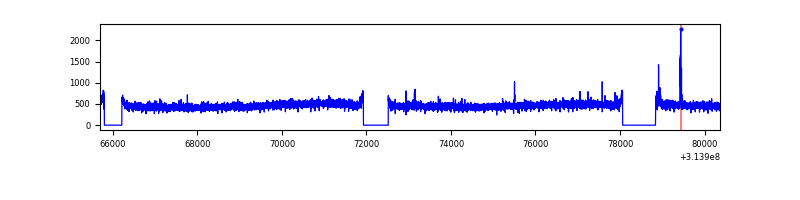 |
| D | 14672 | 12890 | 303 | 303 | 2.07% | 2.35% | 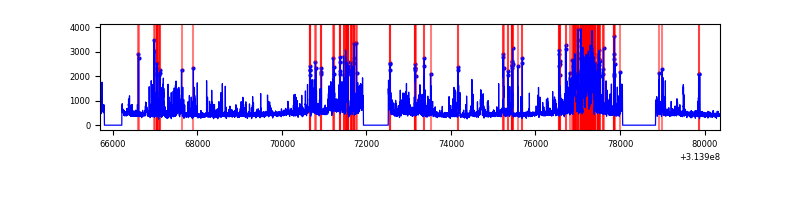 |
Top three noisy pixels from each quadrant. If the there are fewer than three noisy pixels in the level2.evt file, extra rows are filled as -1
| Pixel properties | Quadrant properties | ||||||
|---|---|---|---|---|---|---|---|
| Quadrant | DetID | PixID | Counts | Sigma | Mean | Median | Sigma |
| A | 13 | 254 | 23551 | 72.59 | 1519 | 1487 | 304.0 |
| A | 0 | 226 | 13177 | 38.46 | 1519 | 1487 | 304.0 |
| A | 3 | 137 | 12851 | 37.39 | 1519 | 1487 | 304.0 |
| B | 0 | 230 | 43170 | 145.31 | 1518 | 1479 | 286.9 |
| B | 12 | 111 | 33879 | 112.93 | 1518 | 1479 | 286.9 |
| B | 0 | 228 | 32559 | 108.33 | 1518 | 1479 | 286.9 |
| C | 14 | 238 | 229251 | 674.54 | 1451 | 1457 | 337.7 |
| C | 10 | 22 | 48372 | 138.92 | 1451 | 1457 | 337.7 |
| C | 8 | 128 | 11408 | 29.47 | 1451 | 1457 | 337.7 |
| D | 1 | 52 | 1179093 | 3340.72 | 1452 | 1409 | 352.5 |
| D | 13 | 172 | 814564 | 2306.67 | 1452 | 1409 | 352.5 |
| D | 2 | 152 | 215478 | 607.25 | 1452 | 1409 | 352.5 |
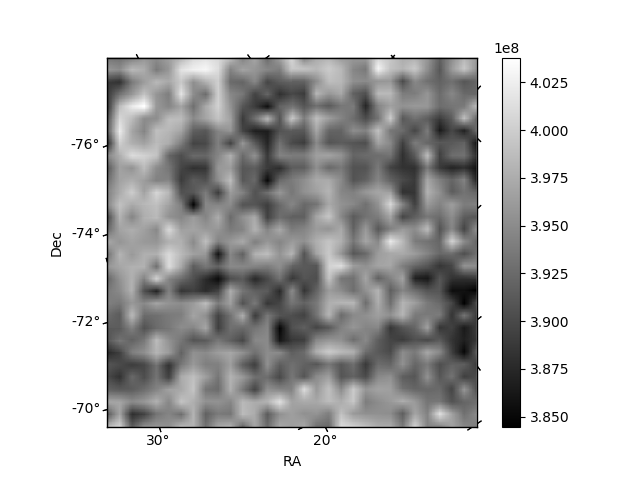
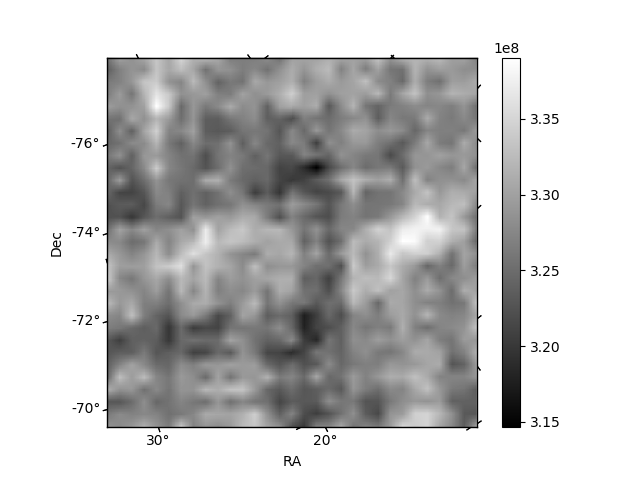
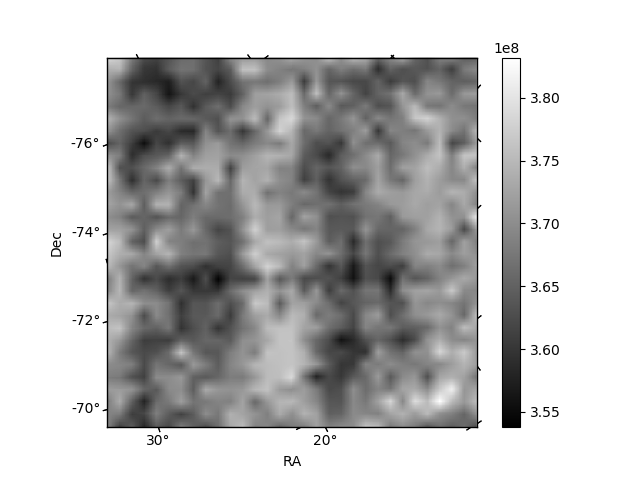
Histogram calculated using DETX and DETY for each event in the final _common_clean file
| Quadrant A | 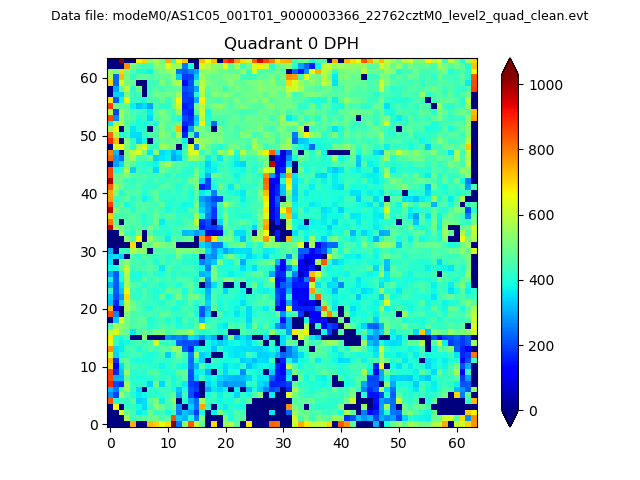 |
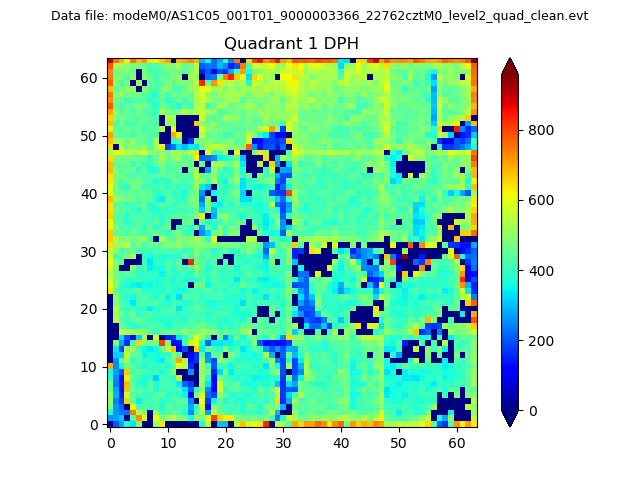 |
Quadrant B |
|---|---|---|---|
| Quadrant D | 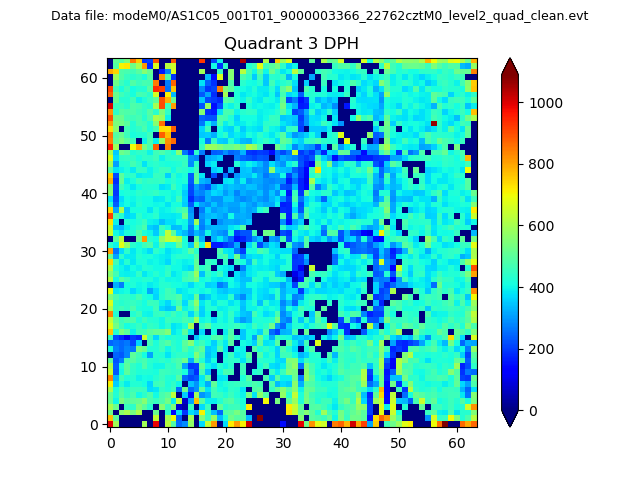 |
 |
Quadrant C |
| Plot type | Count rate plots | Images |
|---|---|---|
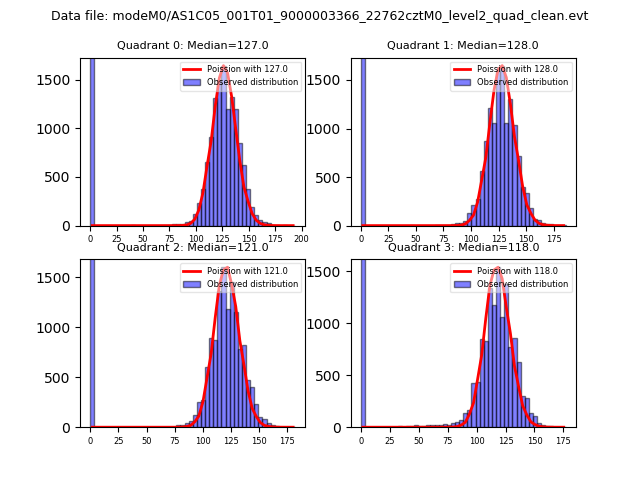
| Comparison with Poisson distribution Blue bars denote a histogram of data divided into 1 sec bins. Red curve is a Poisson curve with rate = median count rate of data. |
 |
 |
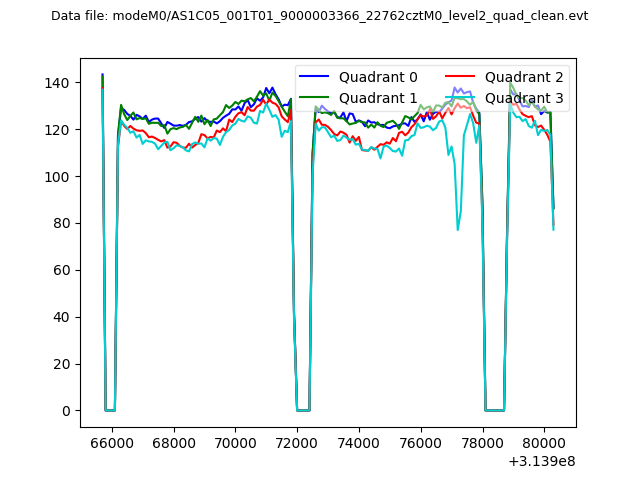
| Quadrant-wise count rates Data is divided into 100 sec bins |
 |
|
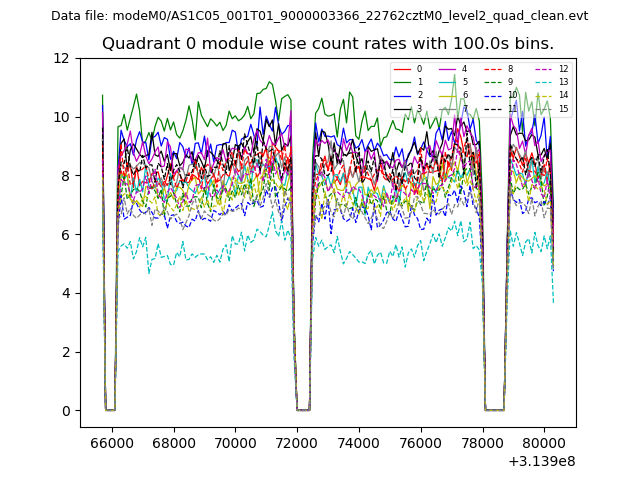
| Module-wise count rates for Quadrant A Data is divided into 100 sec bins |
 |
 |
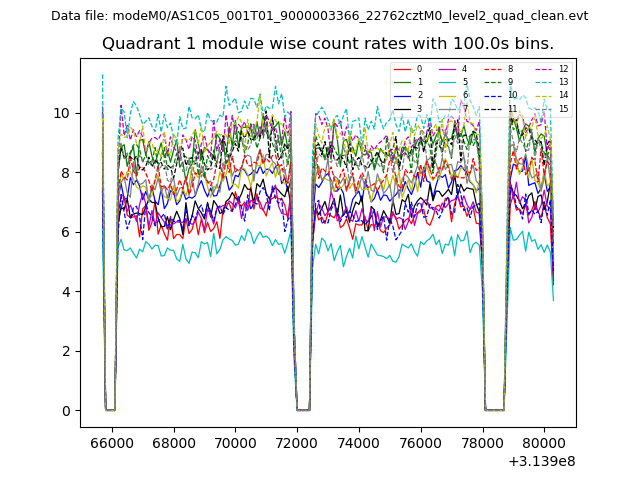
| Module-wise count rates for Quadrant B Data is divided into 100 sec bins |
 |
 |
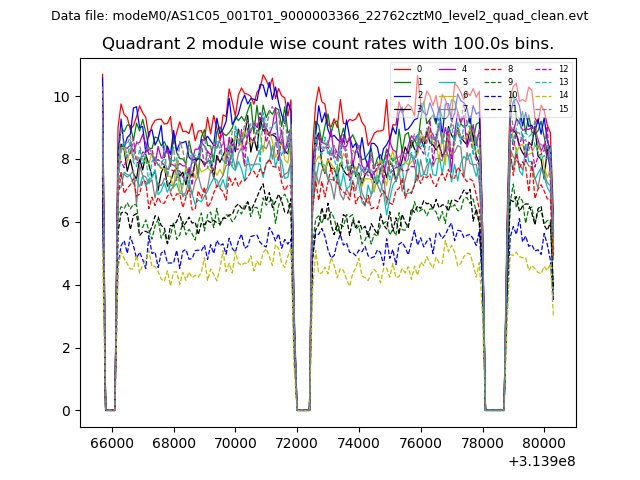
| Module-wise count rates for Quadrant C Data is divided into 100 sec bins |
 |
 |
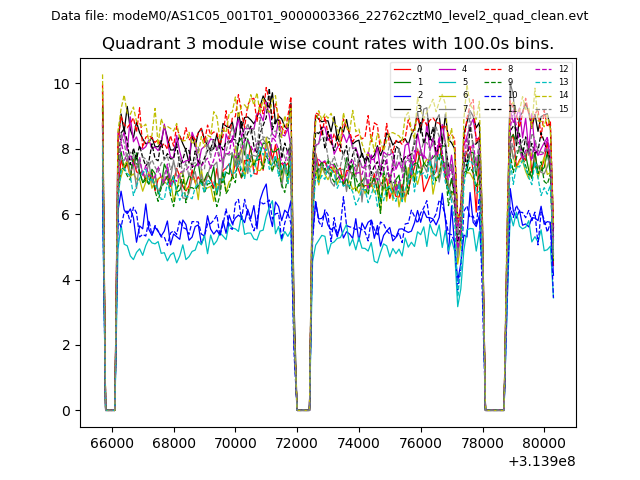
| Module-wise count rates for Quadrant D Data is divided into 100 sec bins |
 |
 |
| Parameter | Plot |
|---|---|
| CZT HV Monitor | 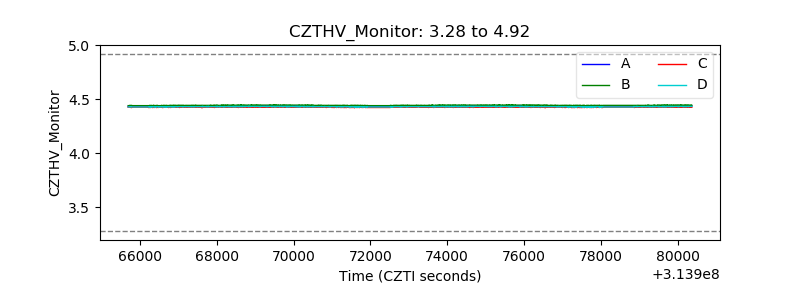 |
| D_VDD | 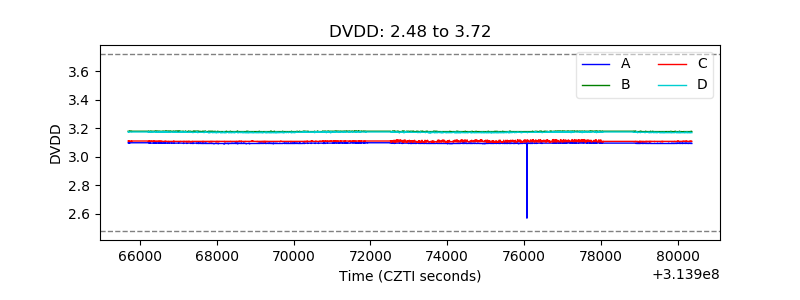 |
| Temperature 1 | 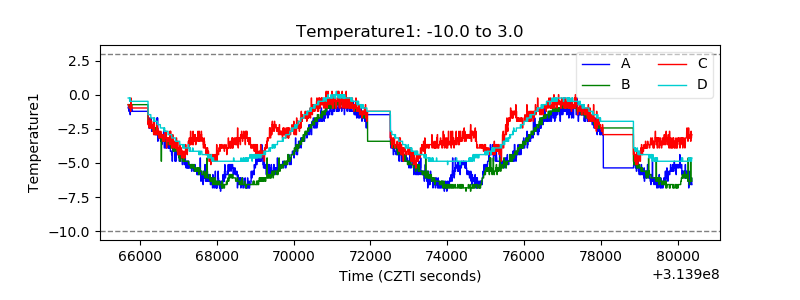 |
| Veto HV Monitor | 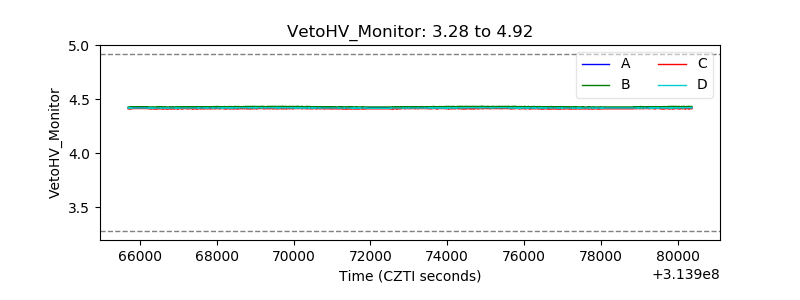 |
| Veto LLD | 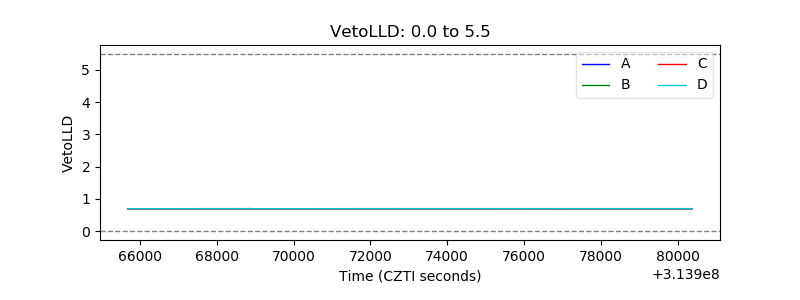 |
| Alpha Counter | 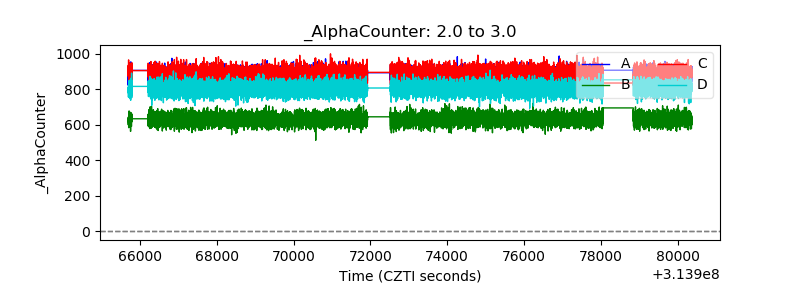 |
| _CPM_Rate | 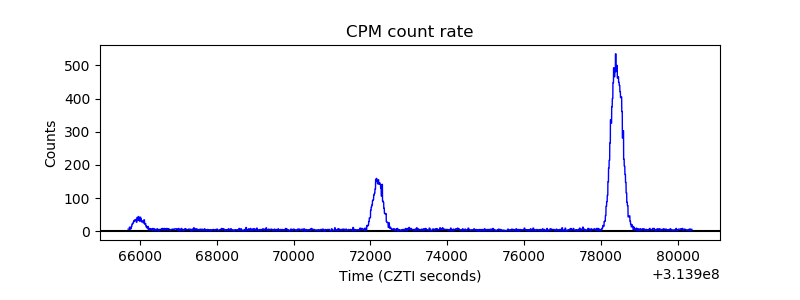 |
| CZT Counter |  |
| +2.5 Volts monitor |  |
| +5 Volts monitor | 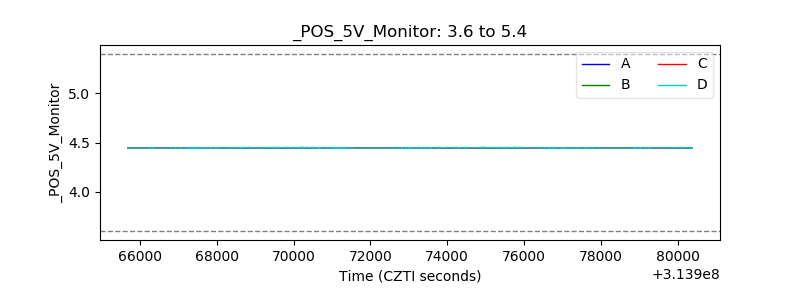 |
| _ROLL_ROT | 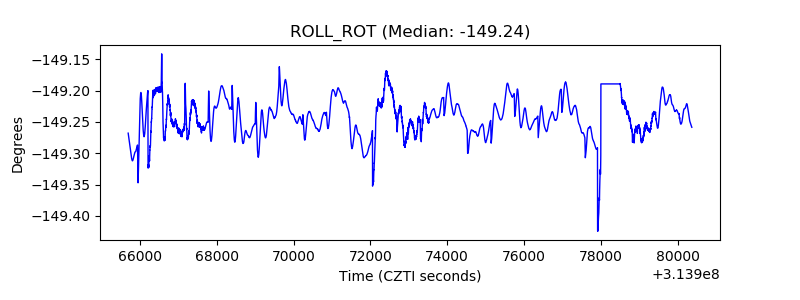 |
| _Roll_DEC | 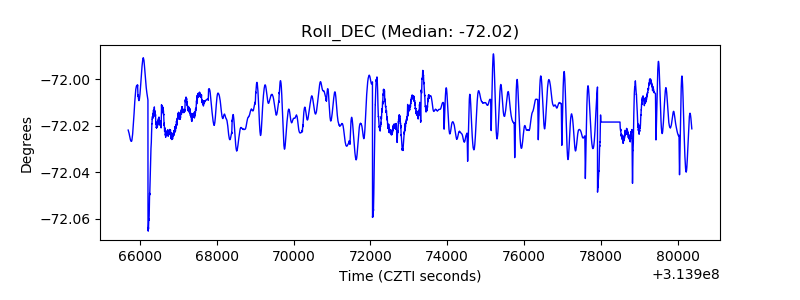 |
| _Roll_RA | 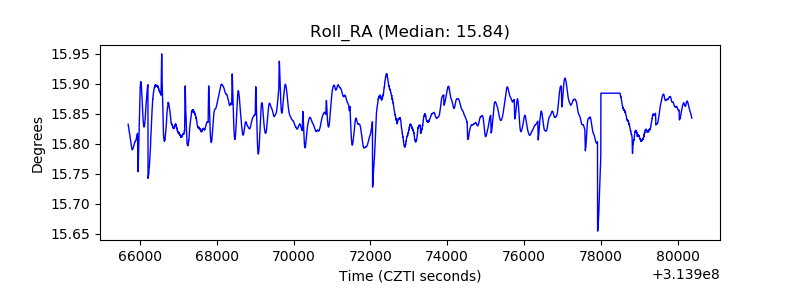 |
| Veto Counter | 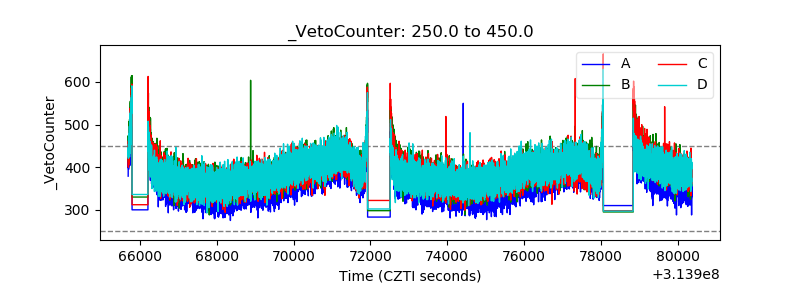 |