| Param | Original file | Final file |
|---|---|---|
| Filename | modeM0/AS1C05_001T01_9000003366_22764cztM0_level2.evt | modeM0/AS1C05_001T01_9000003366_22764cztM0_level2_quad_clean.evt |
| Size (bytes) | 457,338,240 | 133,358,400 |
| Size | 436.2 MB | 127.2 MB |
| Events in quadrant A | 3,173,760 | 912,964 |
| Events in quadrant B | 3,279,653 | 924,926 |
| Events in quadrant C | 3,261,623 | 881,756 |
| Events in quadrant D | 3,686,841 | 859,273 |
| Mode M9 | |||
|---|---|---|---|
| Quadrant | BADHDUFLAG | Total packets | Discarded packets |
| A | 0 | 16 | 0 |
| B | 0 | 17 | 0 |
| C | 0 | 17 | 0 |
| D | 0 | 17 | 0 |
| Mode SS | |||
|---|---|---|---|
| Quadrant | BADHDUFLAG | Total packets | Discarded packets |
| A | 0 | 132 | 0 |
| B | 0 | 132 | 0 |
| C | 0 | 132 | 0 |
| D | 0 | 132 | 0 |
| Mode M0 | |||
|---|---|---|---|
| Quadrant | BADHDUFLAG | Total packets | Discarded packets |
| A | 0 | 13630 | 2 |
| B | 0 | 13872 | 2 |
| C | 0 | 13870 | 2 |
| D | 0 | 15369 | 2 |
| Quadrant | Total seconds | Saturated seconds | Saturation percentage |
|---|---|---|---|
| A | 6608 | 46 | 0.696126% |
| B | 6608 | 70 | 1.059322% |
| C | 6608 | 88 | 1.331719% |
| D | 6608 | 157 | 2.375908% |
Noise dominated data is calculated using 1-second bins in cleaned event files. If a bin has >2000 counts, and if more than 50% of those come from <1% of pixels, then it is considered to be noise-dominated and hence unusable.
| Quadrant | # 1 sec bins | Bins with >0 counts | Bins with >2000 counts | High rate bins dominated by noise | Noise dominated (total time) | Noise dominated (detector-on time) | Marked lightcurve |
|---|---|---|---|---|---|---|---|
| A | 7658 | 6609 | 0 | 0 | 0.00% | 0.00% | 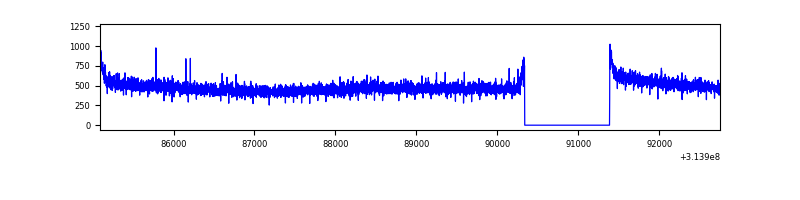 |
| B | 7658 | 6609 | 3 | 3 | 0.04% | 0.05% | 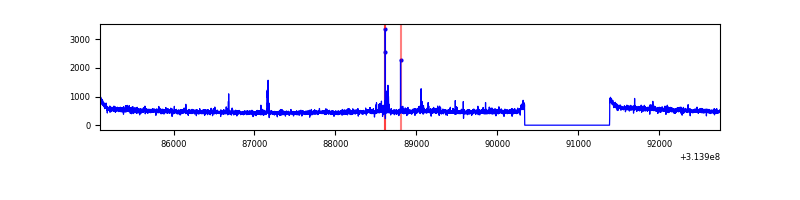 |
| C | 7658 | 6609 | 1 | 1 | 0.01% | 0.02% | 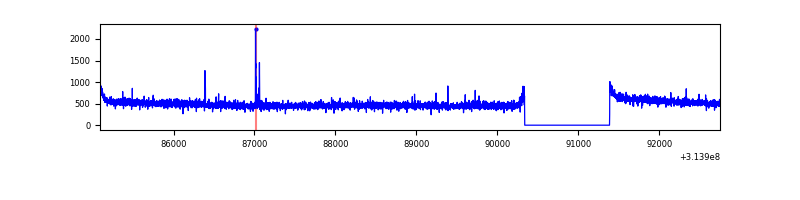 |
| D | 7658 | 6609 | 93 | 93 | 1.21% | 1.41% | 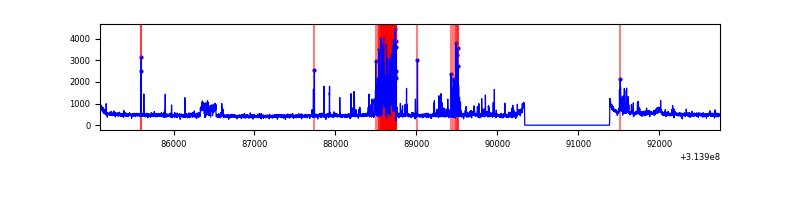 |
Top three noisy pixels from each quadrant. If the there are fewer than three noisy pixels in the level2.evt file, extra rows are filled as -1
| Pixel properties | Quadrant properties | ||||||
|---|---|---|---|---|---|---|---|
| Quadrant | DetID | PixID | Counts | Sigma | Mean | Median | Sigma |
| A | 13 | 254 | 11661 | 66.65 | 823 | 808 | 162.8 |
| A | 0 | 226 | 6972 | 37.85 | 823 | 808 | 162.8 |
| A | 3 | 137 | 6654 | 35.9 | 823 | 808 | 162.8 |
| B | 0 | 190 | 27615 | 174.93 | 822 | 802 | 153.3 |
| B | 0 | 230 | 18846 | 117.72 | 822 | 802 | 153.3 |
| B | 12 | 111 | 17984 | 112.1 | 822 | 802 | 153.3 |
| C | 14 | 238 | 128125 | 687.61 | 798 | 805 | 185.2 |
| C | 10 | 22 | 22505 | 117.19 | 798 | 805 | 185.2 |
| C | 13 | 61 | 5579 | 25.78 | 798 | 805 | 185.2 |
| D | 12 | 233 | 368788 | 1909.24 | 799 | 776 | 192.8 |
| D | 7 | 238 | 128963 | 665.03 | 799 | 776 | 192.8 |
| D | 1 | 52 | 78702 | 404.28 | 799 | 776 | 192.8 |
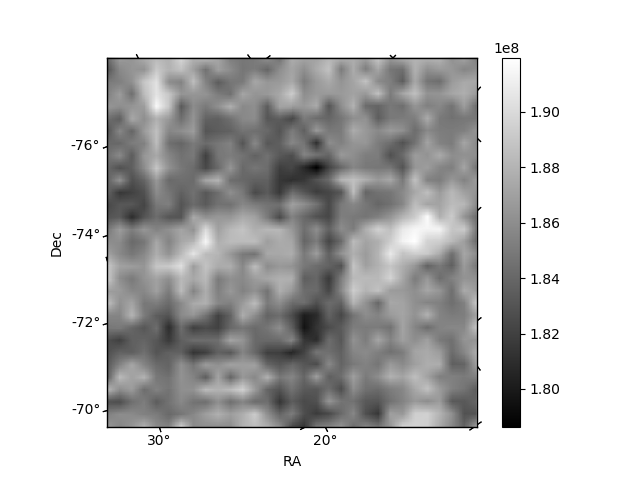
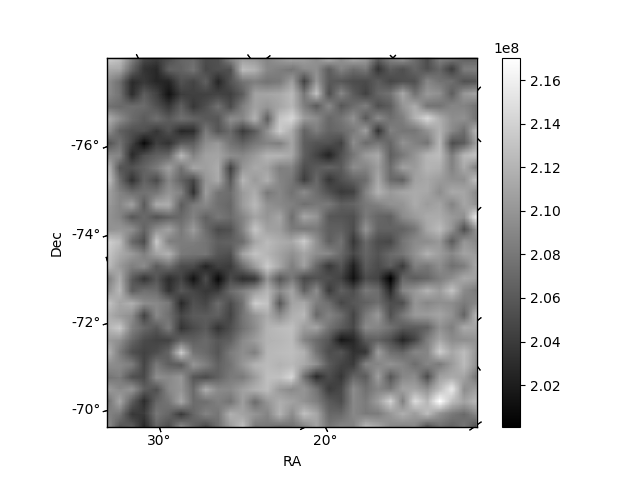
Histogram calculated using DETX and DETY for each event in the final _common_clean file
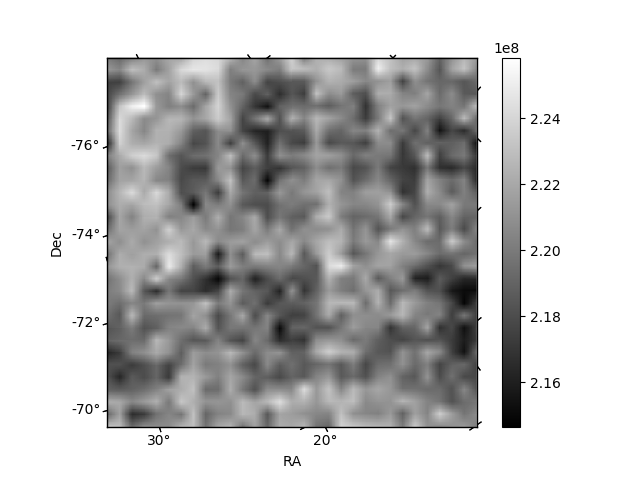
| Quadrant A |  |
 |
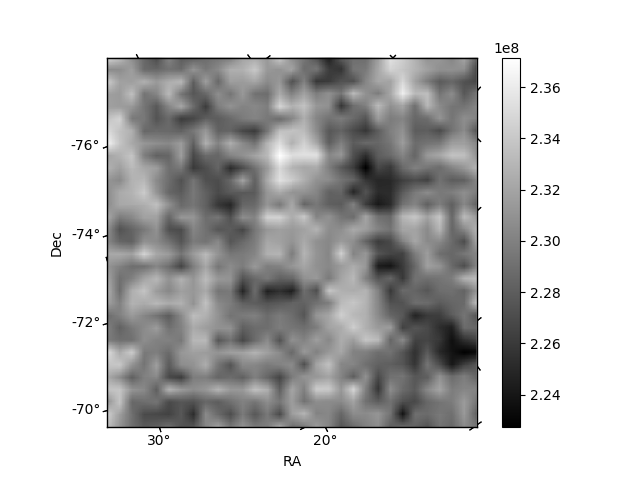
Quadrant B |
|---|---|---|---|
| Quadrant D |  |
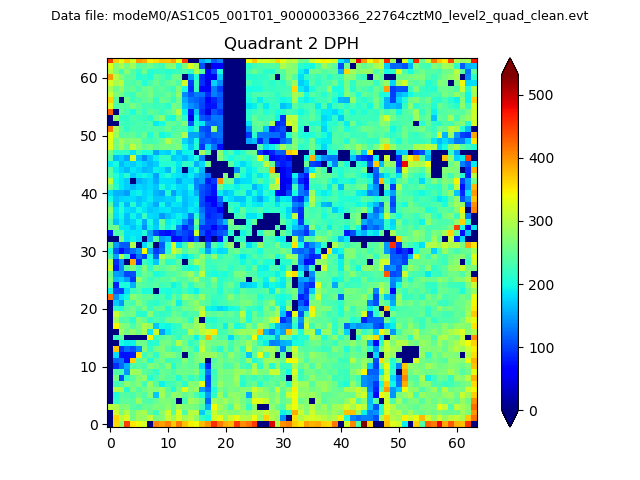 |
Quadrant C |
| Plot type | Count rate plots | Images |
|---|---|---|
| Comparison with Poisson distribution Blue bars denote a histogram of data divided into 1 sec bins. Red curve is a Poisson curve with rate = median count rate of data. |
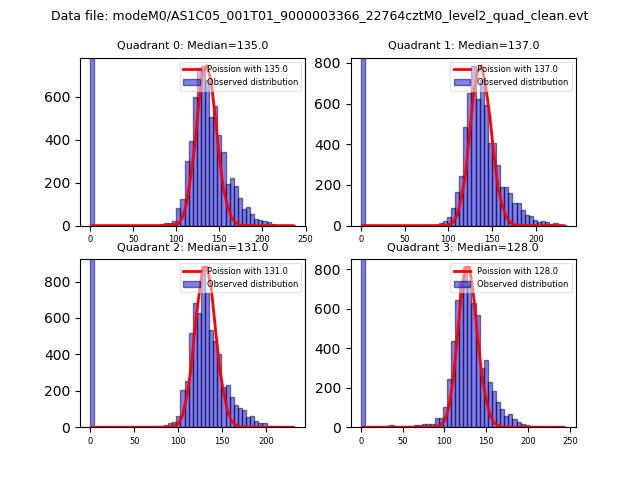 |
 |
| Quadrant-wise count rates Data is divided into 100 sec bins |
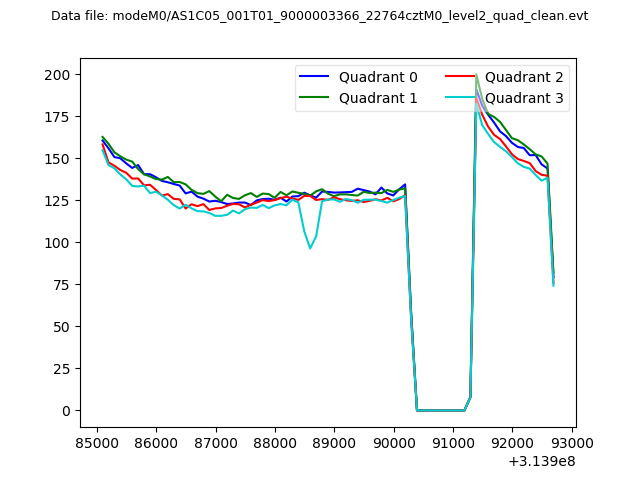 |
|
| Module-wise count rates for Quadrant A Data is divided into 100 sec bins |
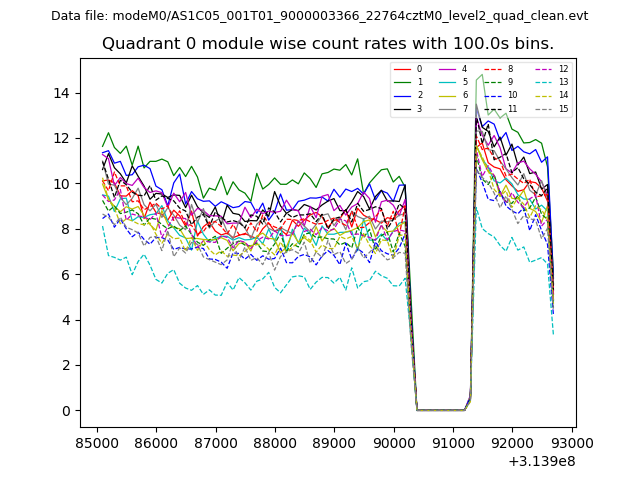 |
 |
| Module-wise count rates for Quadrant B Data is divided into 100 sec bins |
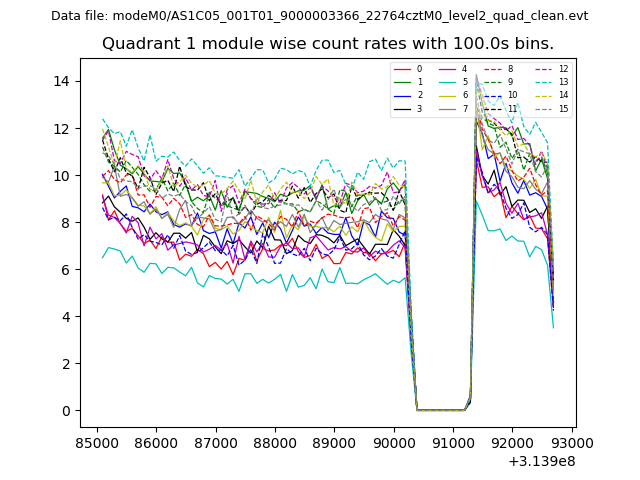 |
 |
| Module-wise count rates for Quadrant C Data is divided into 100 sec bins |
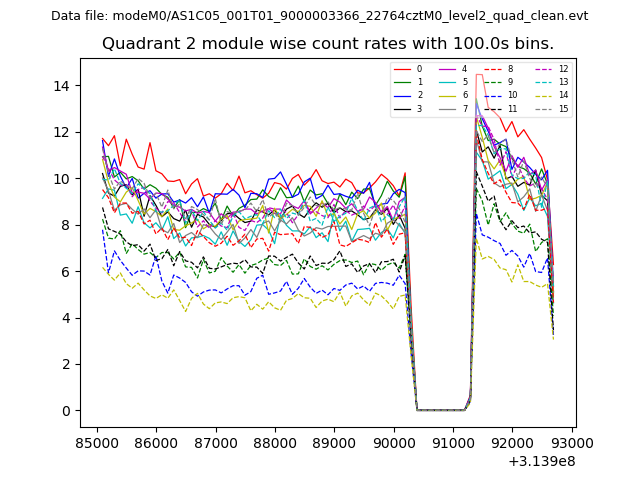 |
 |
| Module-wise count rates for Quadrant D Data is divided into 100 sec bins |
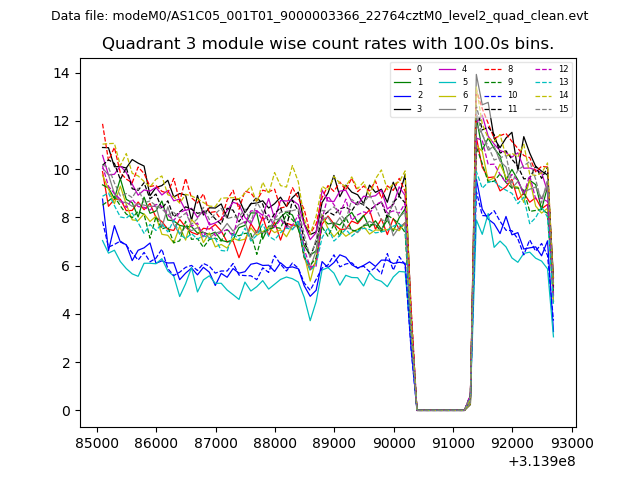 |
 |
| Parameter | Plot |
|---|---|
| CZT HV Monitor | 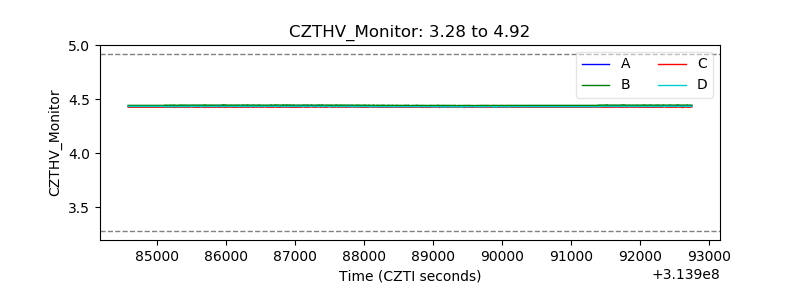 |
| D_VDD | 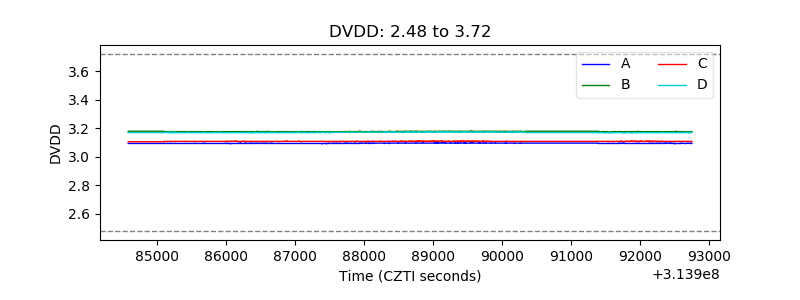 |
| Temperature 1 | 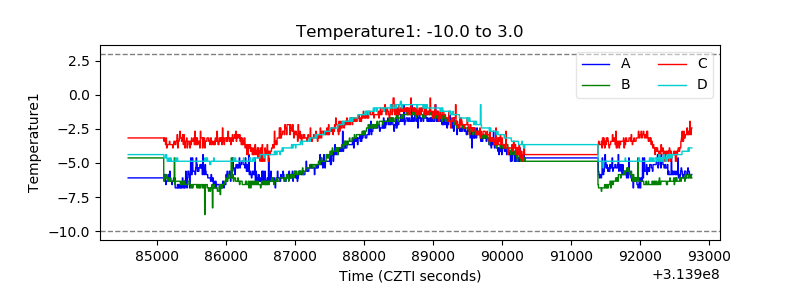 |
| Veto HV Monitor | 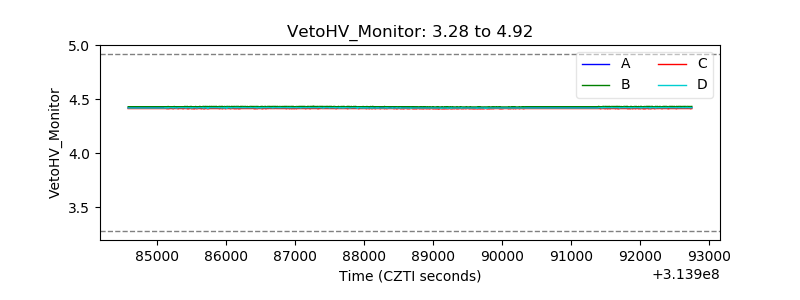 |
| Veto LLD | 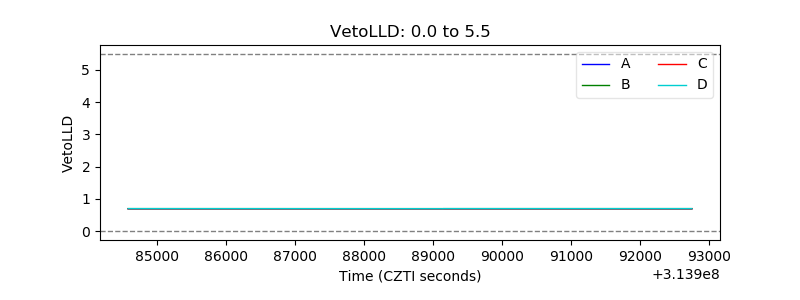 |
| Alpha Counter | 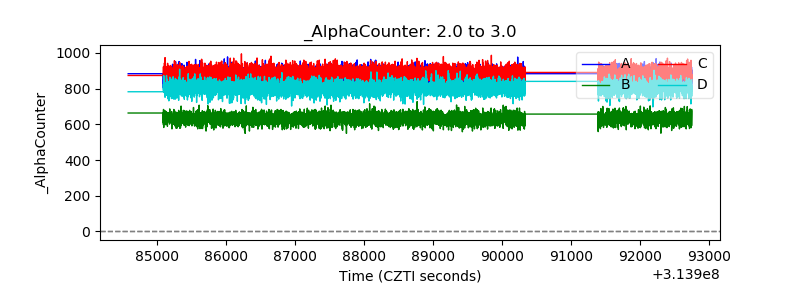 |
| _CPM_Rate | 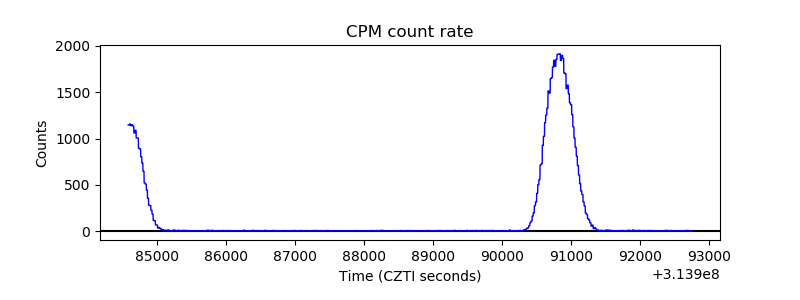 |
| CZT Counter | 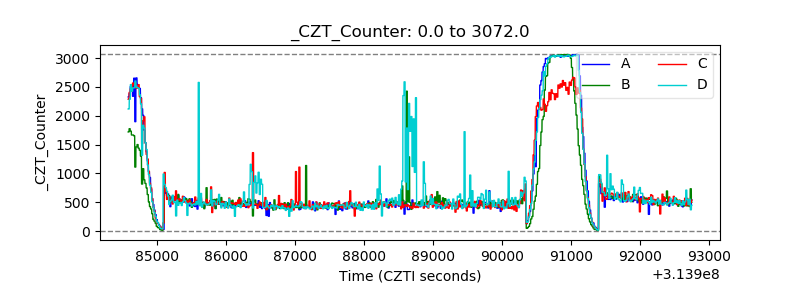 |
| +2.5 Volts monitor |  |
| +5 Volts monitor | 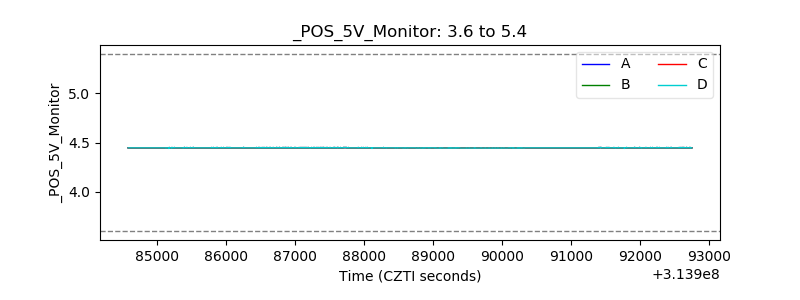 |
| _ROLL_ROT | 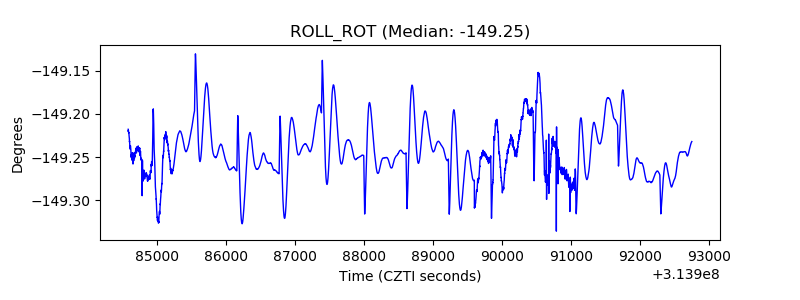 |
| _Roll_DEC | 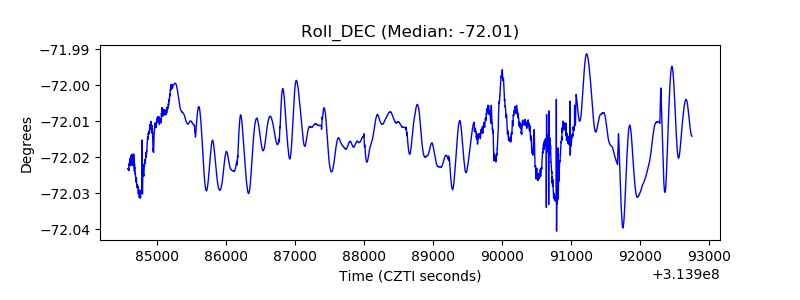 |
| _Roll_RA | 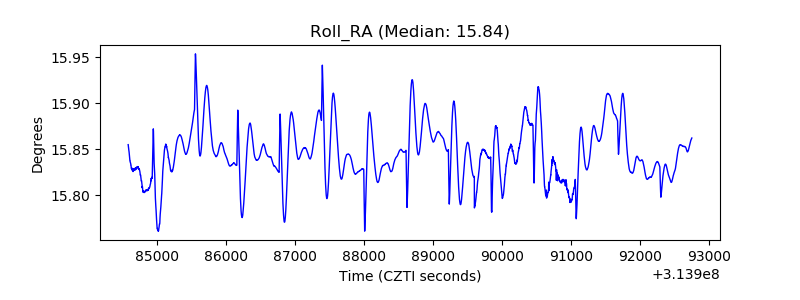 |
| Veto Counter | 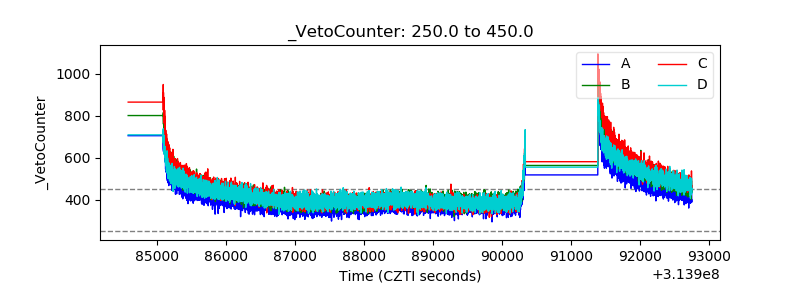 |