| Param | Original file | Final file |
|---|---|---|
| Filename | modeM0/AS1C05_001T01_9000003366_22769cztM0_level2.evt | modeM0/AS1C05_001T01_9000003366_22769cztM0_level2_quad_clean.evt |
| Size (bytes) | 508,343,040 | 146,992,320 |
| Size | 484.8 MB | 140.2 MB |
| Events in quadrant A | 3,370,522 | 1,032,811 |
| Events in quadrant B | 3,516,769 | 1,040,517 |
| Events in quadrant C | 3,358,973 | 986,097 |
| Events in quadrant D | 4,721,694 | 953,207 |
| Mode M9 | |||
|---|---|---|---|
| Quadrant | BADHDUFLAG | Total packets | Discarded packets |
| A | 0 | 13 | 0 |
| B | 0 | 13 | 0 |
| C | 0 | 13 | 0 |
| D | 0 | 13 | 0 |
| Mode SS | |||
|---|---|---|---|
| Quadrant | BADHDUFLAG | Total packets | Discarded packets |
| A | 0 | 128 | 0 |
| B | 0 | 128 | 0 |
| C | 0 | 128 | 0 |
| D | 0 | 128 | 0 |
| Mode M0 | |||
|---|---|---|---|
| Quadrant | BADHDUFLAG | Total packets | Discarded packets |
| A | 0 | 13983 | 1 |
| B | 0 | 14425 | 1 |
| C | 0 | 14048 | 1 |
| D | 0 | 18302 | 1 |
| Quadrant | Total seconds | Saturated seconds | Saturation percentage |
|---|---|---|---|
| A | 6296 | 108 | 1.715375% |
| B | 6296 | 127 | 2.017154% |
| C | 6297 | 143 | 2.270923% |
| D | 6297 | 322 | 5.113546% |
Noise dominated data is calculated using 1-second bins in cleaned event files. If a bin has >2000 counts, and if more than 50% of those come from <1% of pixels, then it is considered to be noise-dominated and hence unusable.
| Quadrant | # 1 sec bins | Bins with >0 counts | Bins with >2000 counts | High rate bins dominated by noise | Noise dominated (total time) | Noise dominated (detector-on time) | Marked lightcurve |
|---|---|---|---|---|---|---|---|
| A | 7621 | 6297 | 0 | 0 | 0.00% | 0.00% | 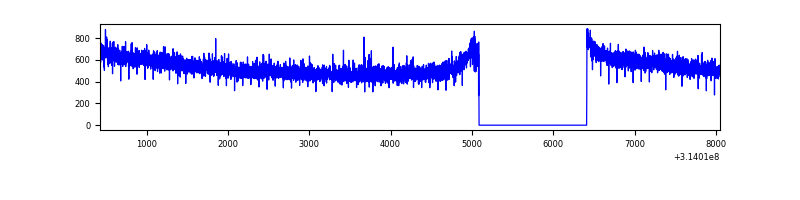 |
| B | 7621 | 6297 | 6 | 6 | 0.08% | 0.10% | 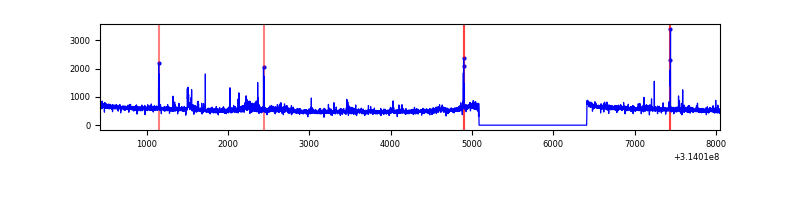 |
| C | 7622 | 6298 | 0 | 0 | 0.00% | 0.00% | 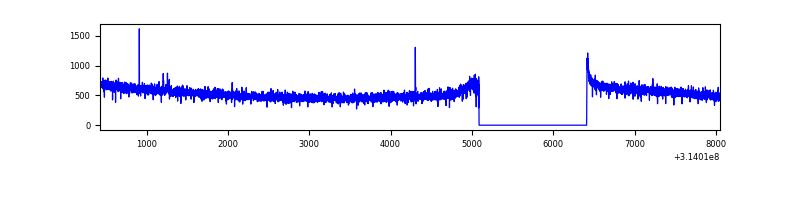 |
| D | 7622 | 6298 | 177 | 177 | 2.32% | 2.81% | 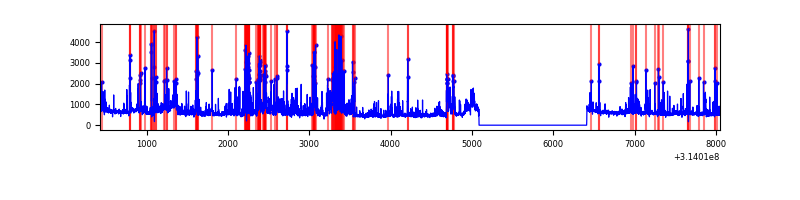 |
Top three noisy pixels from each quadrant. If the there are fewer than three noisy pixels in the level2.evt file, extra rows are filled as -1
| Pixel properties | Quadrant properties | ||||||
|---|---|---|---|---|---|---|---|
| Quadrant | DetID | PixID | Counts | Sigma | Mean | Median | Sigma |
| A | 13 | 254 | 11544 | 62.65 | 873 | 859 | 170.6 |
| A | 0 | 226 | 7777 | 40.56 | 873 | 859 | 170.6 |
| A | 12 | 194 | 6226 | 31.47 | 873 | 859 | 170.6 |
| B | 0 | 228 | 45161 | 283.8 | 861 | 841 | 156.2 |
| B | 0 | 230 | 41138 | 258.04 | 861 | 841 | 156.2 |
| B | 0 | 190 | 28209 | 175.25 | 861 | 841 | 156.2 |
| C | 14 | 238 | 134915 | 719.8 | 822 | 828 | 186.3 |
| C | 10 | 22 | 9677 | 47.5 | 822 | 828 | 186.3 |
| C | 0 | 10 | 8158 | 39.35 | 822 | 828 | 186.3 |
| D | 1 | 52 | 1176922 | 5893.01 | 836 | 812 | 199.6 |
| D | 12 | 233 | 142263 | 708.75 | 836 | 812 | 199.6 |
| D | 2 | 152 | 71178 | 352.58 | 836 | 812 | 199.6 |
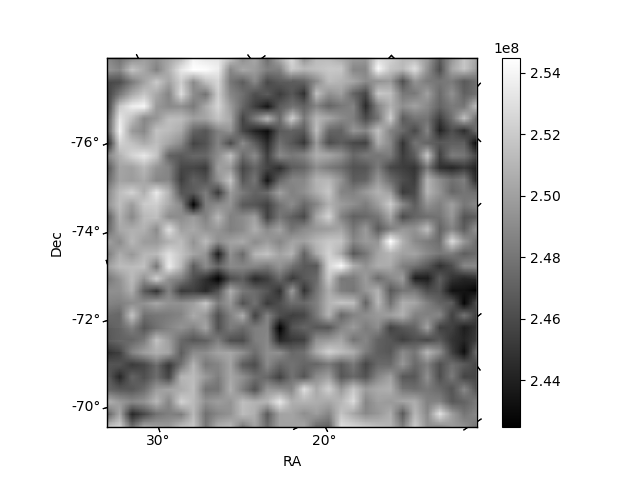
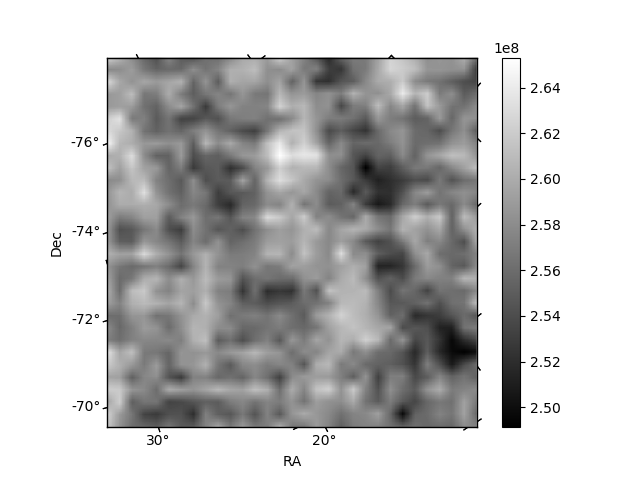
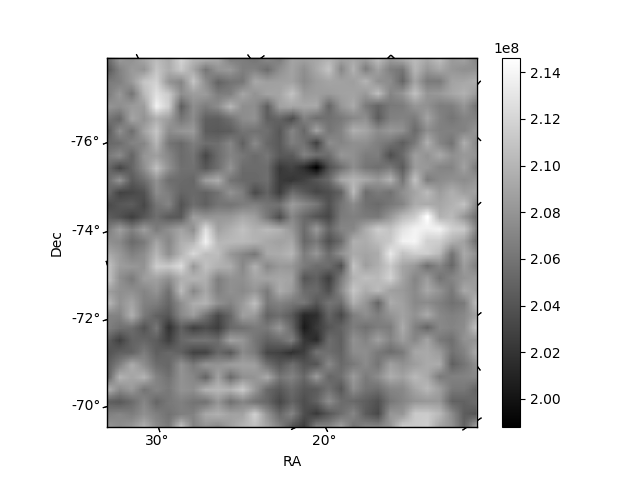
Histogram calculated using DETX and DETY for each event in the final _common_clean file
| Quadrant A | 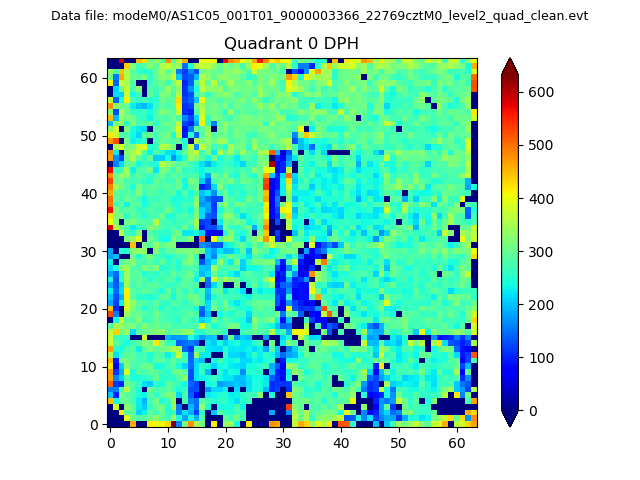 |
 |
Quadrant B |
|---|---|---|---|
| Quadrant D | 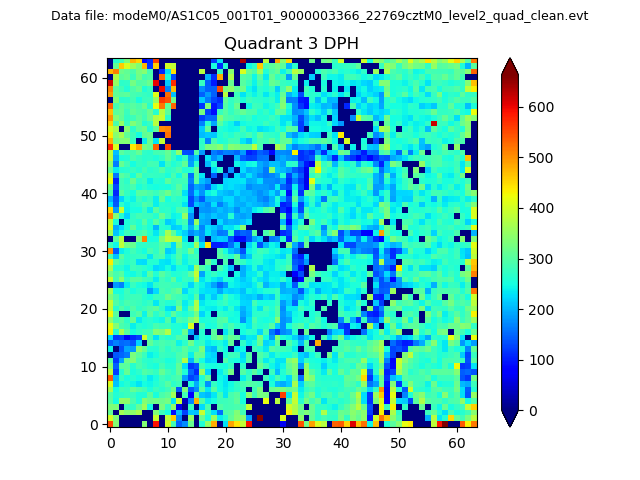 |
 |
Quadrant C |
| Plot type | Count rate plots | Images |
|---|---|---|
| Comparison with Poisson distribution Blue bars denote a histogram of data divided into 1 sec bins. Red curve is a Poisson curve with rate = median count rate of data. |
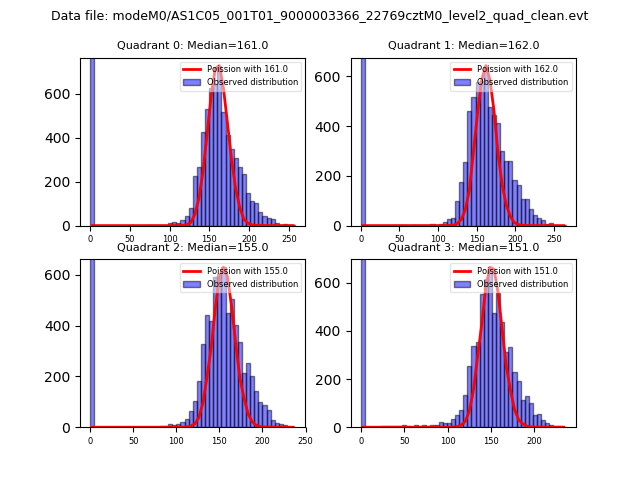 |
 |
| Quadrant-wise count rates Data is divided into 100 sec bins |
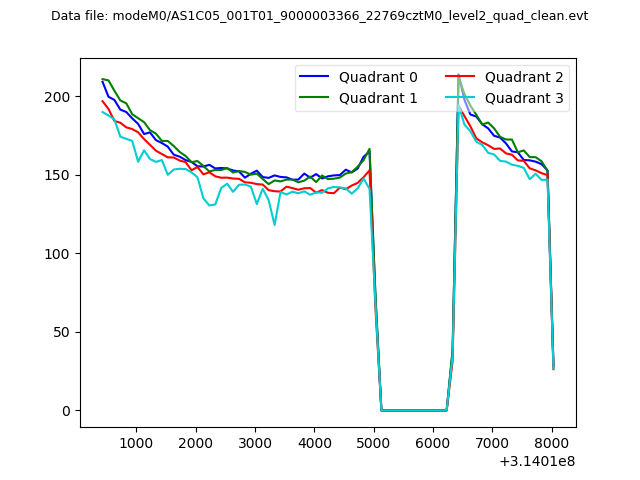 |
|
| Module-wise count rates for Quadrant A Data is divided into 100 sec bins |
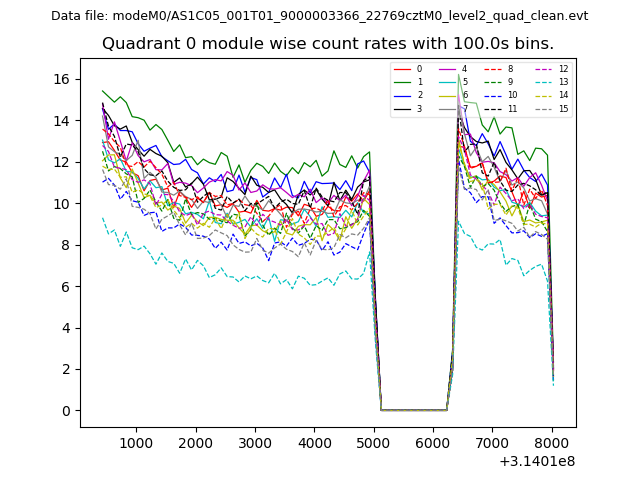 |
 |
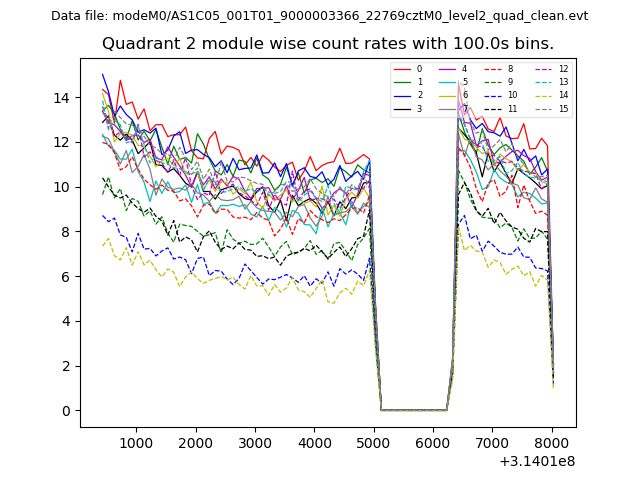
| Module-wise count rates for Quadrant B Data is divided into 100 sec bins |
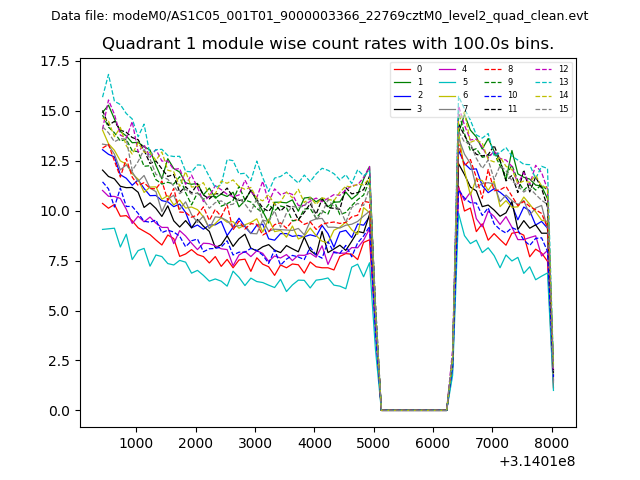 |
 |
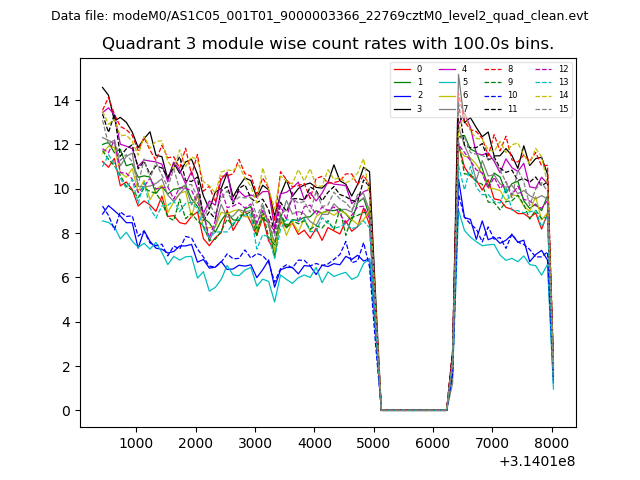
| Module-wise count rates for Quadrant C Data is divided into 100 sec bins |
 |
 |
| Module-wise count rates for Quadrant D Data is divided into 100 sec bins |
 |
 |
| Parameter | Plot |
|---|---|
| CZT HV Monitor | 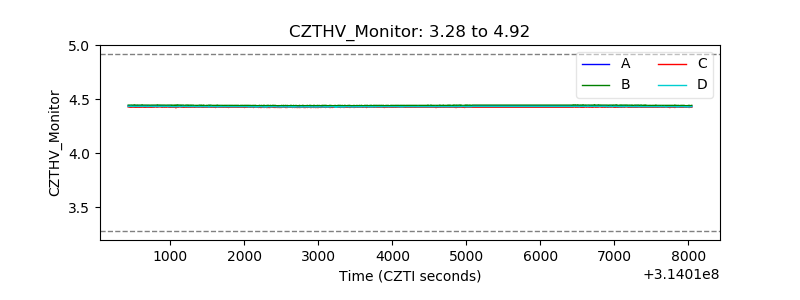 |
| D_VDD | 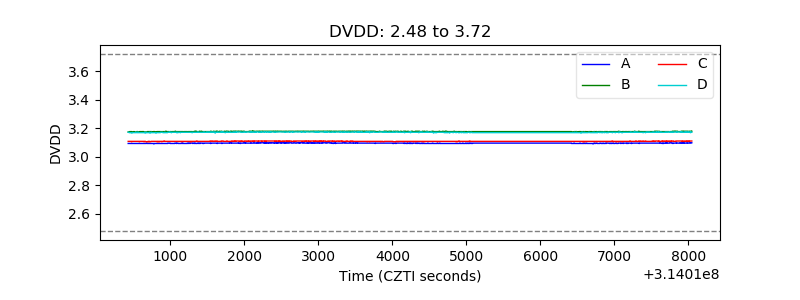 |
| Temperature 1 |  |
| Veto HV Monitor | 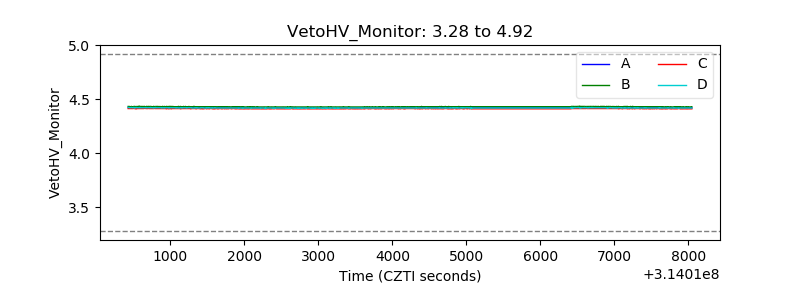 |
| Veto LLD | 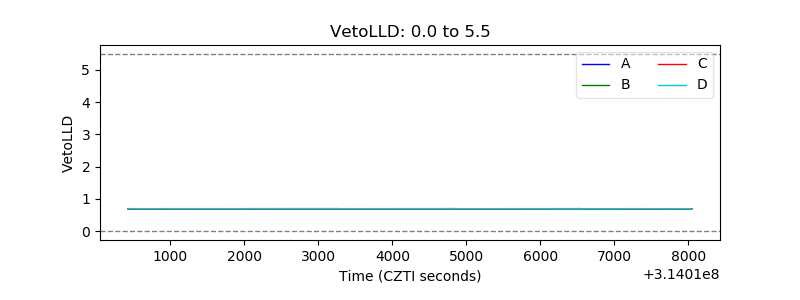 |
| Alpha Counter | 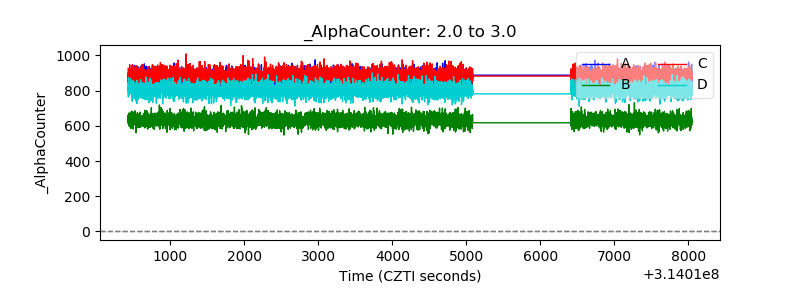 |
| _CPM_Rate | 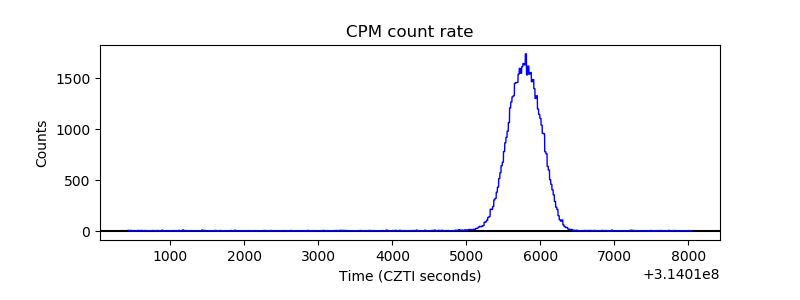 |
| CZT Counter | 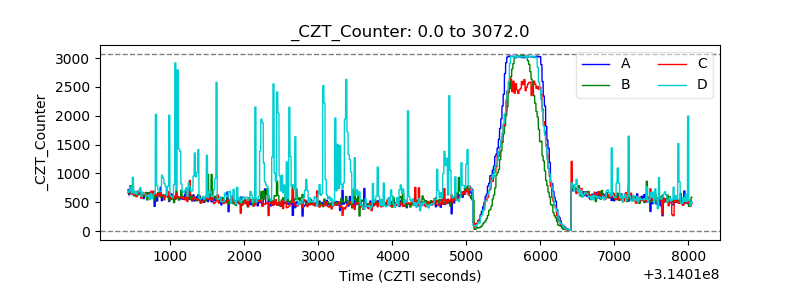 |
| +2.5 Volts monitor |  |
| +5 Volts monitor | 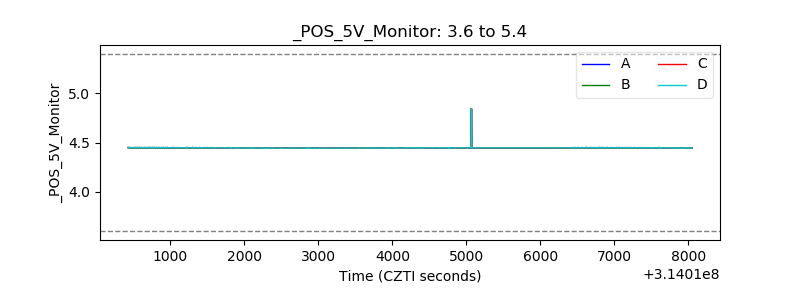 |
| _ROLL_ROT | 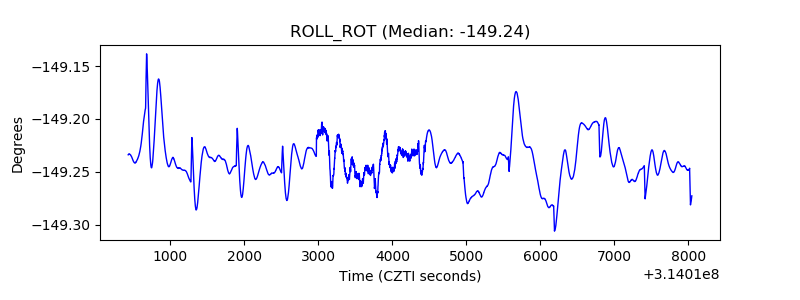 |
| _Roll_DEC | 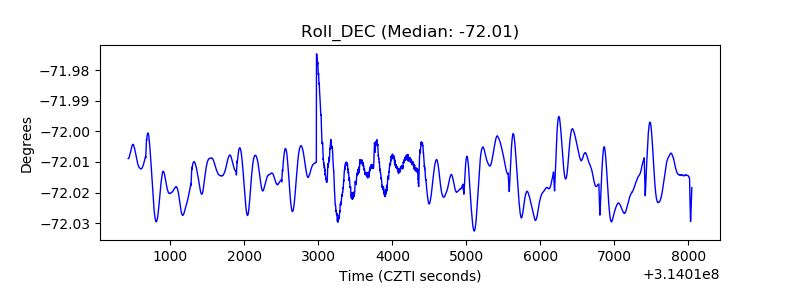 |
| _Roll_RA | 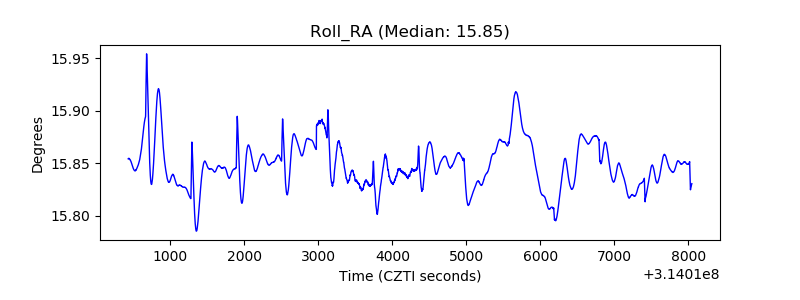 |
| Veto Counter | 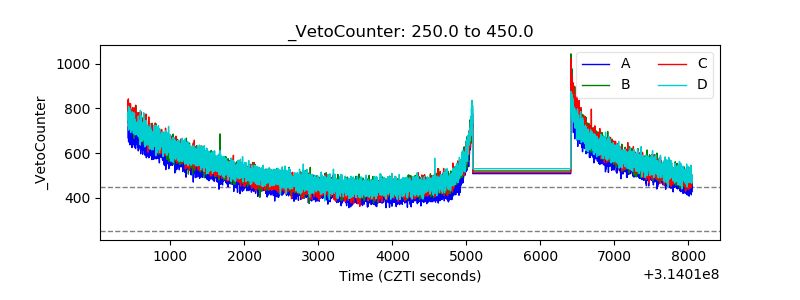 |