| Param | Original file | Final file |
|---|---|---|
| Filename | modeM0/AS1C05_013T02_9000003364cztM0_level2.fits | modeM0/AS1C05_013T02_9000003364cztM0_level2_quad_clean.evt |
| Size (bytes) | 59,791,680 | 45,812,160 |
| Size | 57.0 MB | 43.7 MB |
| Events in quadrant A | 380,226 | 251,398 |
| Events in quadrant B | 360,896 | 248,076 |
| Events in quadrant C | 364,364 | 240,242 |
| Events in quadrant D | 281,484 | 223,314 |
| Mode M0 | |||
|---|---|---|---|
| Quadrant | BADHDUFLAG | Total packets | Discarded packets |
| A | 0 | 12536 | 0 |
| B | 0 | 12596 | 0 |
| C | 0 | 12499 | 0 |
| D | 0 | 21060 | 0 |
| Mode M9 | |||
|---|---|---|---|
| Quadrant | BADHDUFLAG | Total packets | Discarded packets |
| A | 0 | 12 | 0 |
| B | 0 | 12 | 0 |
| C | 0 | 12 | 0 |
| D | 0 | 12 | 0 |
| Mode SS | |||
|---|---|---|---|
| Quadrant | BADHDUFLAG | Total packets | Discarded packets |
| A | 0 | 126 | 0 |
| B | 0 | 126 | 0 |
| C | 0 | 126 | 0 |
| D | 0 | 126 | 0 |
| Quadrant | Total seconds | Saturated seconds | Saturation percentage |
|---|---|---|---|
| A | 6060 | 103 | 1.699670% |
| B | 6060 | 105 | 1.732673% |
| C | 6060 | 125 | 2.062706% |
| D | 6060 | 1292 | 21.320132% |
Noise dominated data is calculated using 1-second bins in cleaned event files. If a bin has >2000 counts, and if more than 50% of those come from <1% of pixels, then it is considered to be noise-dominated and hence unusable.
| Quadrant | # 1 sec bins | Bins with >0 counts | Bins with >2000 counts | High rate bins dominated by noise | Noise dominated (total time) | Noise dominated (detector-on time) | Marked lightcurve |
|---|---|---|---|---|---|---|---|
| A | 7170 | 6060 | 0 | 0 | 0.00% | 0.00% |  |
| B | 7170 | 6060 | 0 | 0 | 0.00% | 0.00% |  |
| C | 7170 | 6060 | 0 | 0 | 0.00% | 0.00% |  |
| D | 7170 | 6052 | 0 | 0 | 0.00% | 0.00% |  |
Top three noisy pixels from each quadrant. If the there are fewer than three noisy pixels in the level2.evt file, extra rows are filled as -1
| Pixel properties | Quadrant properties | ||||||
|---|---|---|---|---|---|---|---|
| Quadrant | DetID | PixID | Counts | Sigma | Mean | Median | Sigma |
| A | 0 | 29 | 350 | 9.82 | 99 | 94 | 26.1 |
| A | 7 | 110 | 290 | 7.52 | 99 | 94 | 26.1 |
| A | 0 | 30 | 280 | 7.13 | 99 | 94 | 26.1 |
| B | 2 | 9 | 281 | 9.16 | 95 | 92 | 20.6 |
| B | 5 | 255 | 248 | 7.56 | 95 | 92 | 20.6 |
| B | 2 | 8 | 244 | 7.37 | 95 | 92 | 20.6 |
| C | 3 | 126 | 276 | 7.06 | 96 | 91 | 26.2 |
| C | 3 | 234 | 257 | 6.33 | 96 | 91 | 26.2 |
| C | 7 | 172 | 256 | 6.29 | 96 | 91 | 26.2 |
| D | 10 | 189 | 219 | 6.37 | 80 | 73 | 22.9 |
| D | 3 | 14 | 217 | 6.29 | 80 | 73 | 22.9 |
| D | 6 | 38 | 212 | 6.07 | 80 | 73 | 22.9 |
Histogram calculated using DETX and DETY for each event in the final _common_clean file
| Quadrant A | 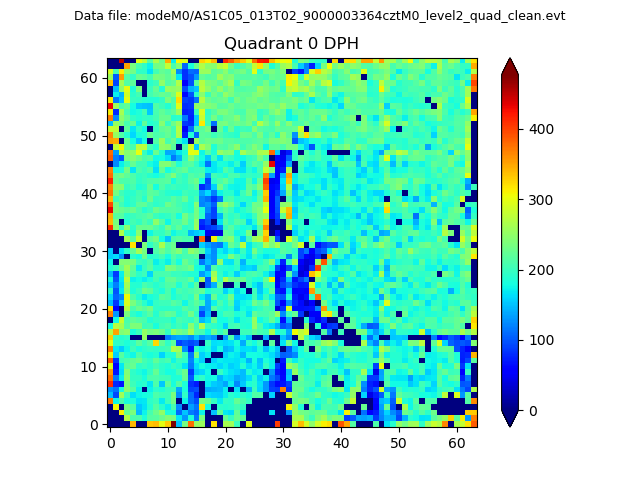 |
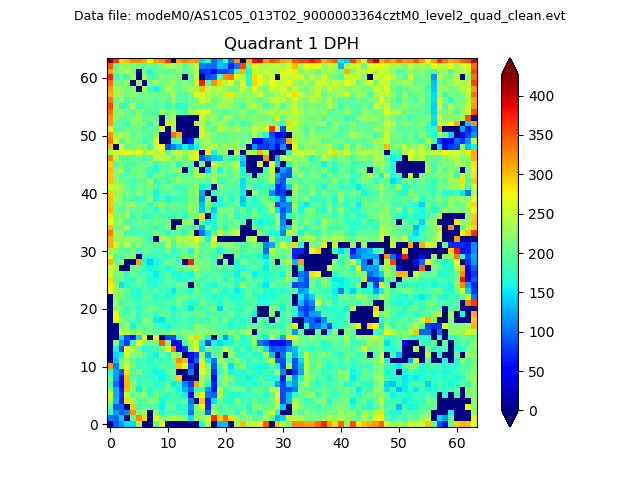 |
Quadrant B |
|---|---|---|---|
| Quadrant D |  |
 |
Quadrant C |
| Plot type | Count rate plots | Images |
|---|---|---|
| Comparison with Poisson distribution Blue bars denote a histogram of data divided into 1 sec bins. Red curve is a Poisson curve with rate = median count rate of data. |
 |
 |
| Quadrant-wise count rates Data is divided into 100 sec bins |
 |
|
| Module-wise count rates for Quadrant A Data is divided into 100 sec bins |
 |
 |
| Module-wise count rates for Quadrant B Data is divided into 100 sec bins |
 |
 |
| Module-wise count rates for Quadrant C Data is divided into 100 sec bins |
 |
 |
| Module-wise count rates for Quadrant D Data is divided into 100 sec bins |
 |
 |
| Parameter | Plot |
|---|---|
| CZT HV Monitor |  |
| D_VDD |  |
| Temperature 1 |  |
| Veto HV Monitor |  |
| Veto LLD |  |
| Alpha Counter |  |
| _CPM_Rate |  |
| CZT Counter |  |
| +2.5 Volts monitor |  |
| +5 Volts monitor |  |
| _ROLL_ROT |  |
| _Roll_DEC |  |
| _Roll_RA |  |
| Veto Counter |  |