| Param | Original file | Final file |
|---|---|---|
| Filename | modeM0/AS1C05_013T02_9000003364_22756cztM0_level2.evt | modeM0/AS1C05_013T02_9000003364_22756cztM0_level2_quad_clean.evt |
| Size (bytes) | 234,126,720 | 39,300,480 |
| Size | 223.3 MB | 37.5 MB |
| Events in quadrant A | 1,113,273 | 288,800 |
| Events in quadrant B | 1,136,654 | 291,815 |
| Events in quadrant C | 1,104,922 | 275,405 |
| Events in quadrant D | 3,586,733 | 176,970 |
| Mode M0 | |||
|---|---|---|---|
| Quadrant | BADHDUFLAG | Total packets | Discarded packets |
| A | 0 | 4562 | 1 |
| B | 0 | 4628 | 1 |
| C | 0 | 4557 | 1 |
| D | 0 | 12099 | 1 |
| Mode M9 | |||
|---|---|---|---|
| Quadrant | BADHDUFLAG | Total packets | Discarded packets |
| A | 0 | 11 | 0 |
| B | 0 | 11 | 0 |
| C | 0 | 11 | 0 |
| D | 0 | 11 | 0 |
| Mode SS | |||
|---|---|---|---|
| Quadrant | BADHDUFLAG | Total packets | Discarded packets |
| A | 0 | 46 | 0 |
| B | 0 | 46 | 0 |
| C | 0 | 46 | 0 |
| D | 0 | 46 | 0 |
| Quadrant | Total seconds | Saturated seconds | Saturation percentage |
|---|---|---|---|
| A | 2156 | 55 | 2.551020% |
| B | 2156 | 64 | 2.968460% |
| C | 2156 | 56 | 2.597403% |
| D | 2156 | 1215 | 56.354360% |
Noise dominated data is calculated using 1-second bins in cleaned event files. If a bin has >2000 counts, and if more than 50% of those come from <1% of pixels, then it is considered to be noise-dominated and hence unusable.
| Quadrant | # 1 sec bins | Bins with >0 counts | Bins with >2000 counts | High rate bins dominated by noise | Noise dominated (total time) | Noise dominated (detector-on time) | Marked lightcurve |
|---|---|---|---|---|---|---|---|
| A | 3266 | 2157 | 0 | 0 | 0.00% | 0.00% | 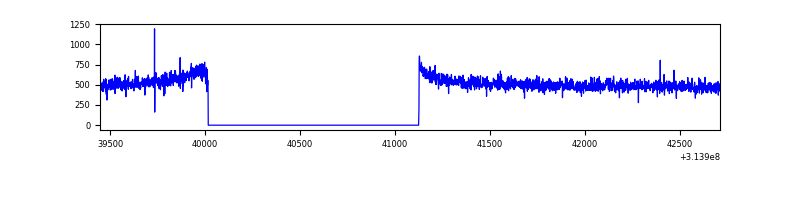 |
| B | 3266 | 2157 | 1 | 1 | 0.03% | 0.05% | 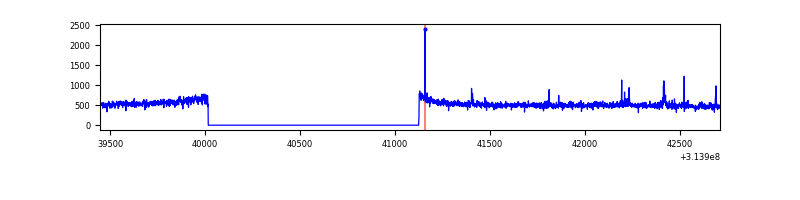 |
| C | 3266 | 2157 | 0 | 0 | 0.00% | 0.00% | 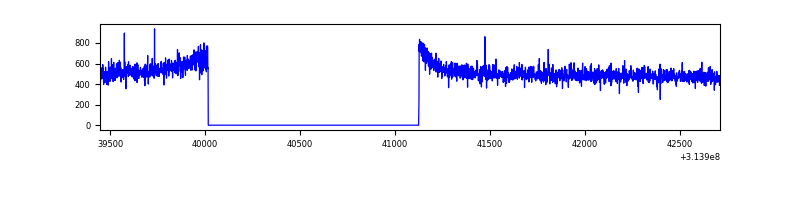 |
| D | 3266 | 2157 | 1122 | 1122 | 34.35% | 52.02% | 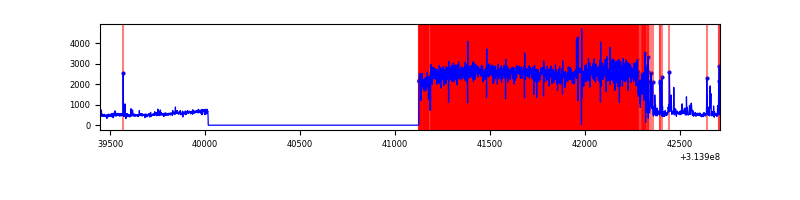 |
Top three noisy pixels from each quadrant. If the there are fewer than three noisy pixels in the level2.evt file, extra rows are filled as -1
| Pixel properties | Quadrant properties | ||||||
|---|---|---|---|---|---|---|---|
| Quadrant | DetID | PixID | Counts | Sigma | Mean | Median | Sigma |
| A | 13 | 254 | 3634 | 57.55 | 288 | 281 | 58.3 |
| A | 0 | 226 | 2617 | 40.09 | 288 | 281 | 58.3 |
| A | 3 | 137 | 2268 | 34.1 | 288 | 281 | 58.3 |
| B | 0 | 228 | 10803 | 194.27 | 283 | 276 | 54.2 |
| B | 0 | 230 | 6464 | 114.2 | 283 | 276 | 54.2 |
| B | 12 | 111 | 6122 | 107.89 | 283 | 276 | 54.2 |
| C | 14 | 238 | 43227 | 671.36 | 271 | 272 | 64.0 |
| C | 10 | 22 | 2242 | 30.79 | 271 | 272 | 64.0 |
| C | 13 | 61 | 1855 | 24.74 | 271 | 272 | 64.0 |
| D | 7 | 238 | 2596458 | 52181.33 | 202 | 196 | 49.8 |
| D | 1 | 52 | 120098 | 2409.87 | 202 | 196 | 49.8 |
| D | 2 | 152 | 51493 | 1031.0 | 202 | 196 | 49.8 |
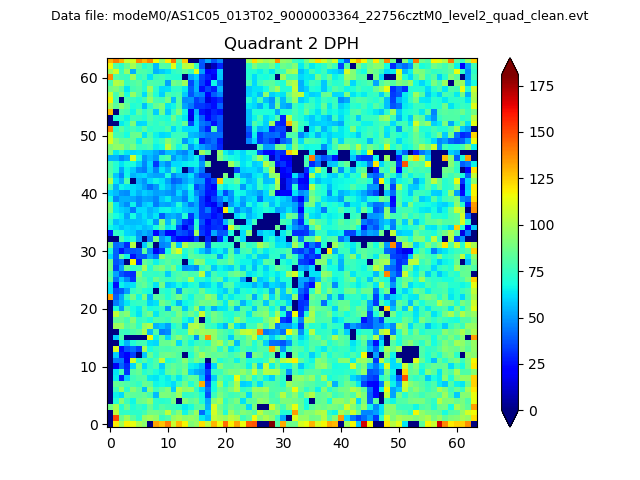
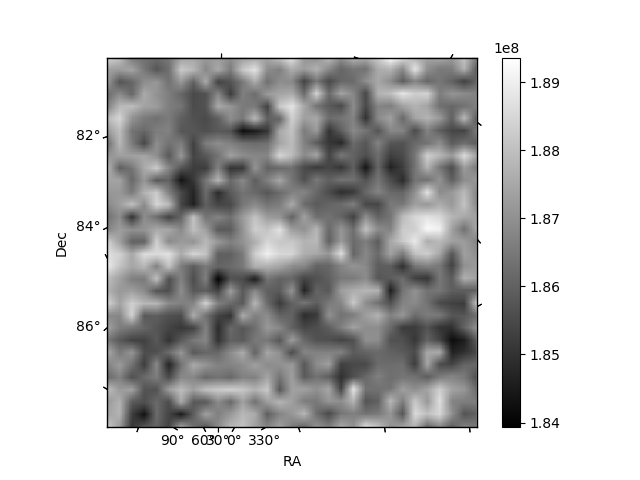
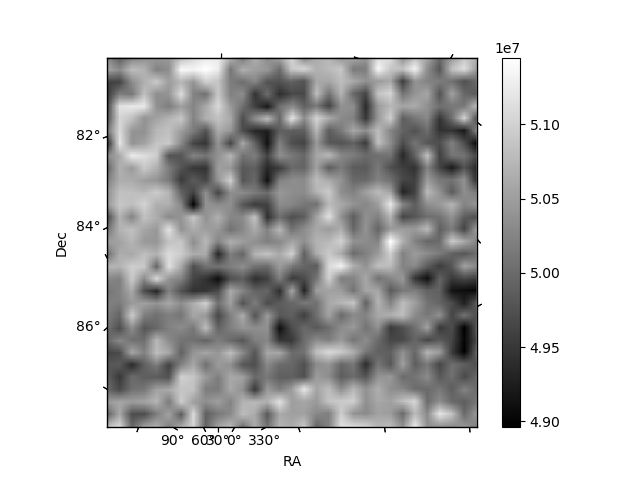
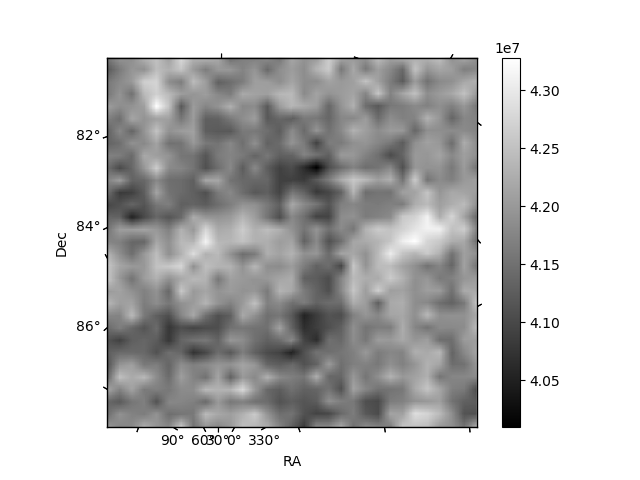
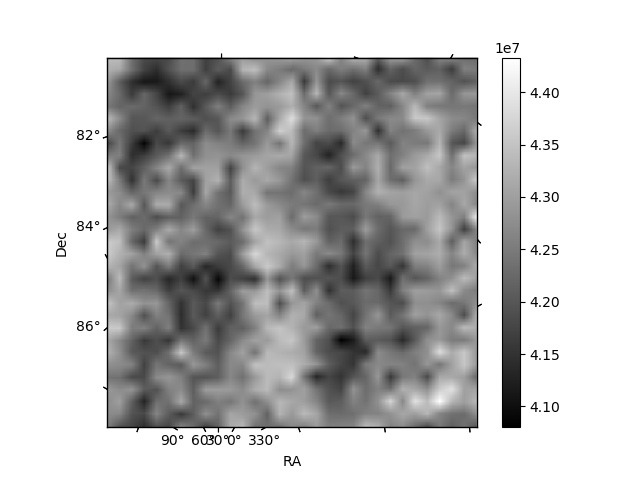
Histogram calculated using DETX and DETY for each event in the final _common_clean file
| Quadrant A | 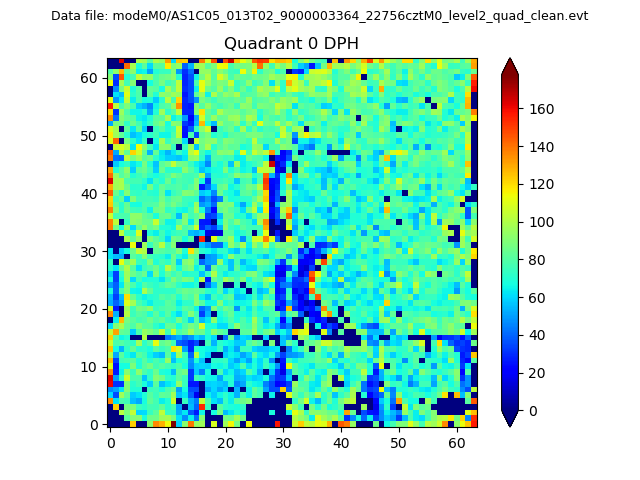 |
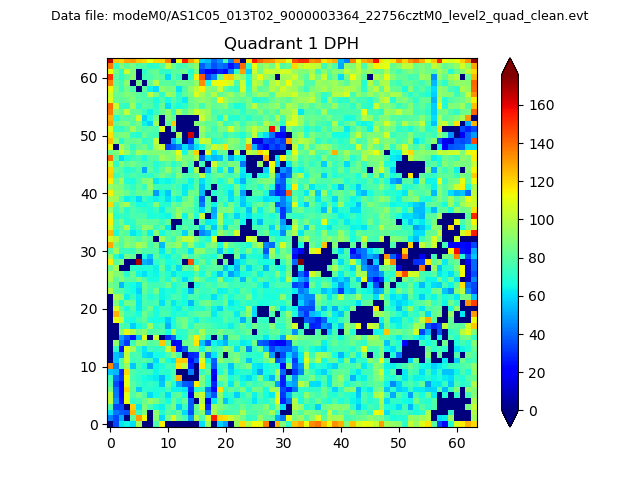 |
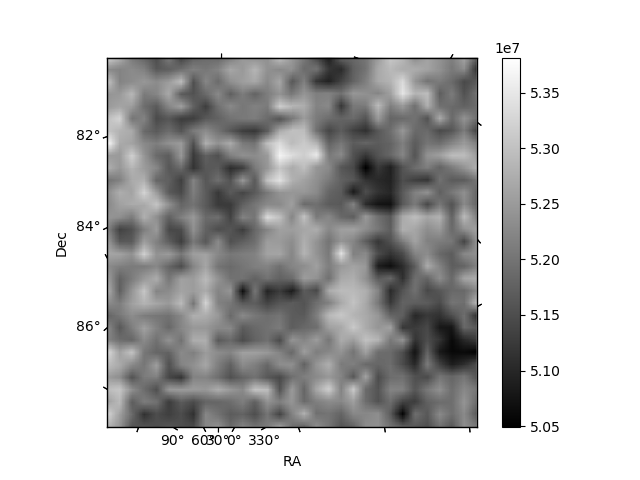
Quadrant B |
|---|---|---|---|
| Quadrant D | 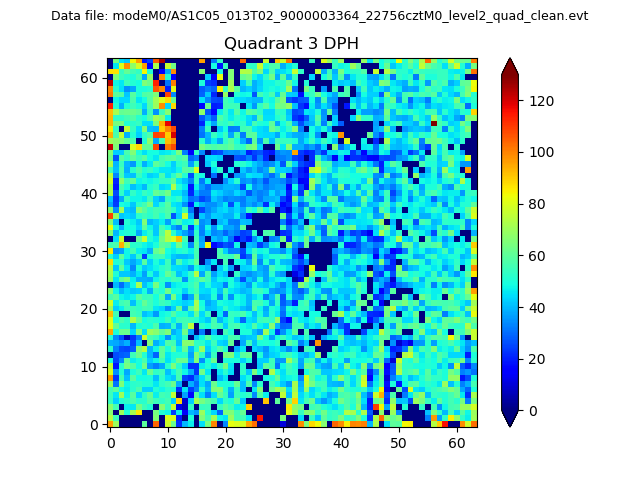 |
 |
Quadrant C |
| Plot type | Count rate plots | Images |
|---|---|---|
| Comparison with Poisson distribution Blue bars denote a histogram of data divided into 1 sec bins. Red curve is a Poisson curve with rate = median count rate of data. |
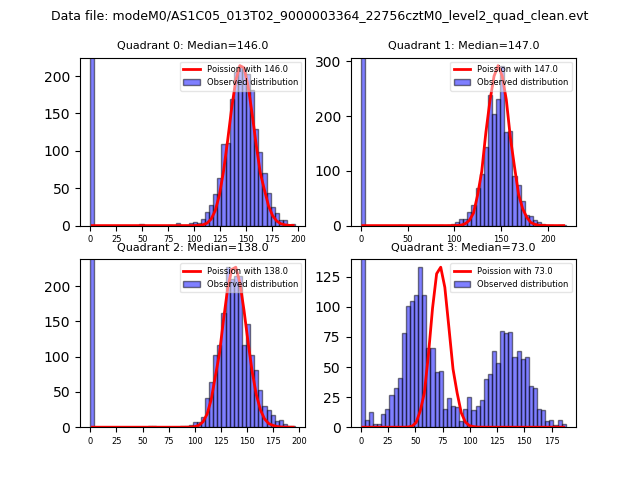 |
 |
| Quadrant-wise count rates Data is divided into 100 sec bins |
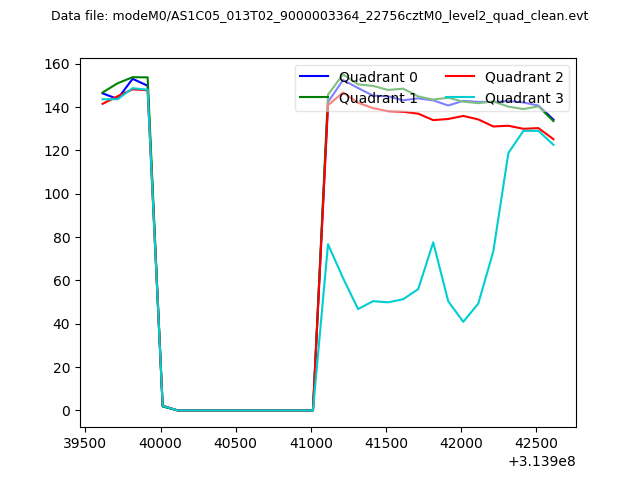 |
|
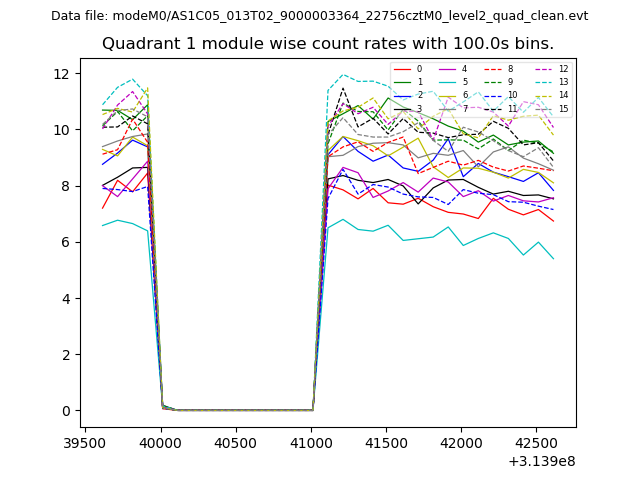
| Module-wise count rates for Quadrant A Data is divided into 100 sec bins |
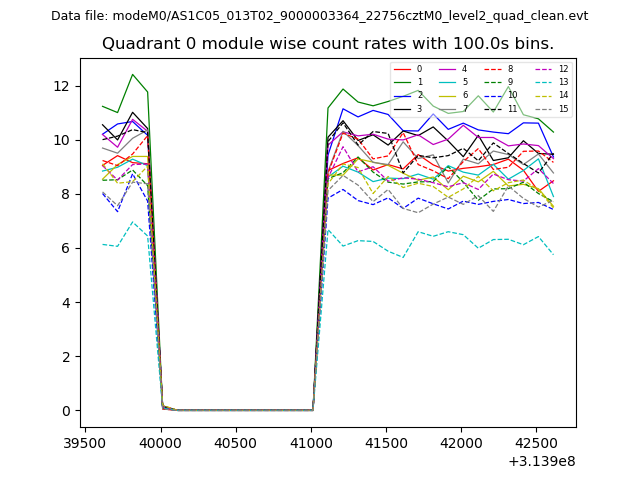 |
 |
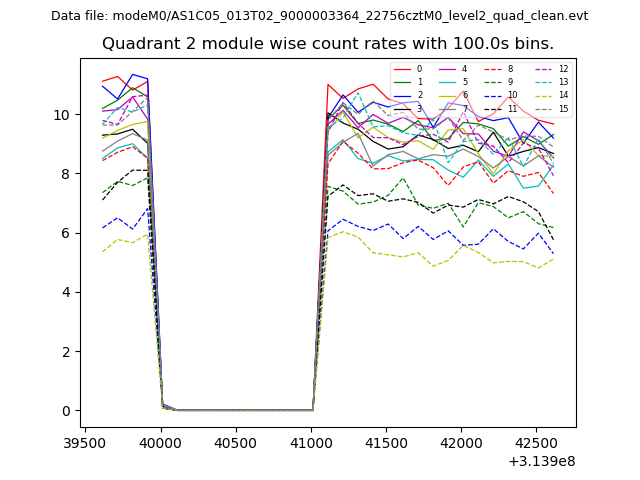
| Module-wise count rates for Quadrant B Data is divided into 100 sec bins |
 |
 |
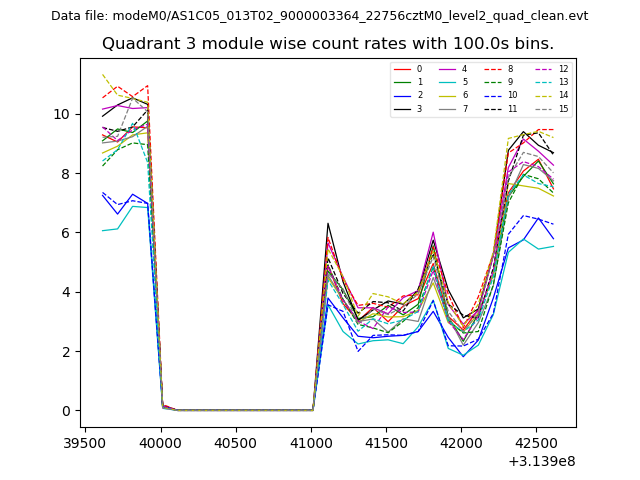
| Module-wise count rates for Quadrant C Data is divided into 100 sec bins |
 |
 |
| Module-wise count rates for Quadrant D Data is divided into 100 sec bins |
 |
 |
| Parameter | Plot |
|---|---|
| CZT HV Monitor | 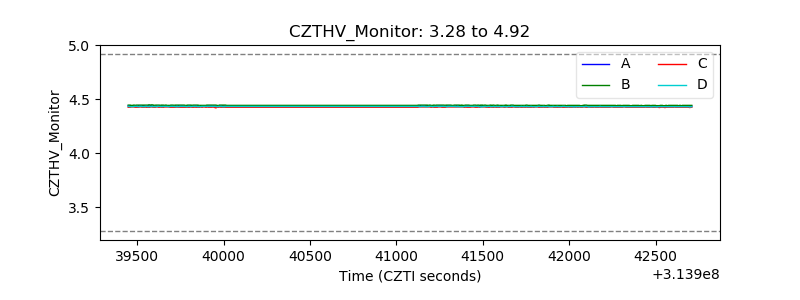 |
| D_VDD | 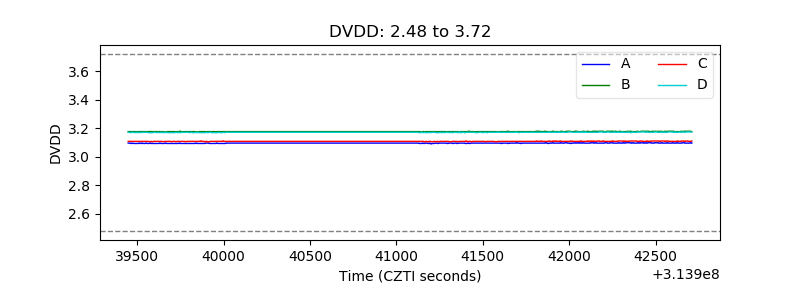 |
| Temperature 1 | 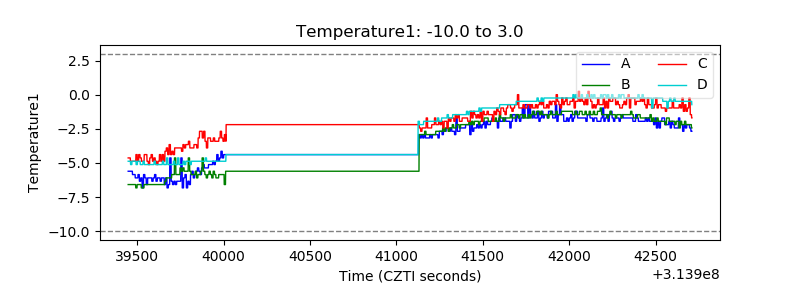 |
| Veto HV Monitor |  |
| Veto LLD | 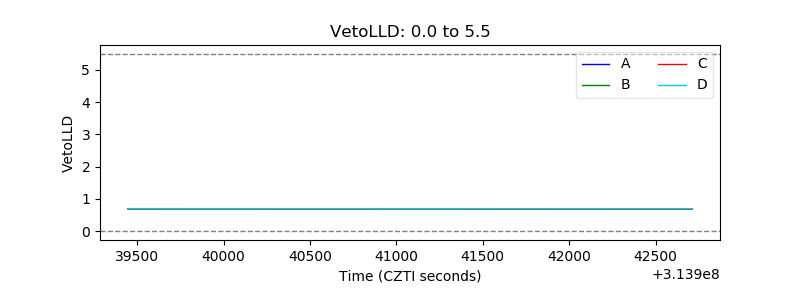 |
| Alpha Counter | 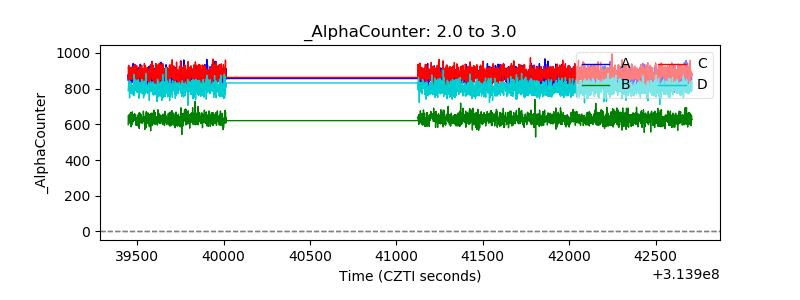 |
| _CPM_Rate | 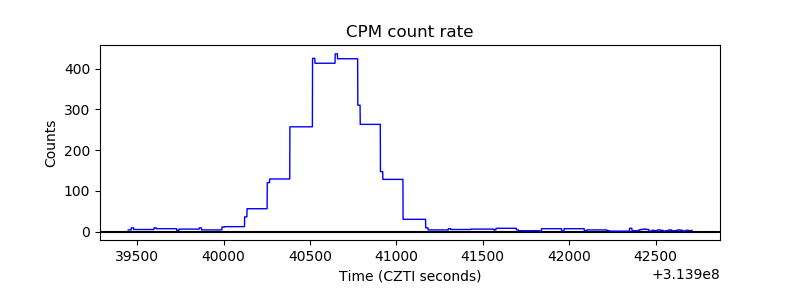 |
| CZT Counter | 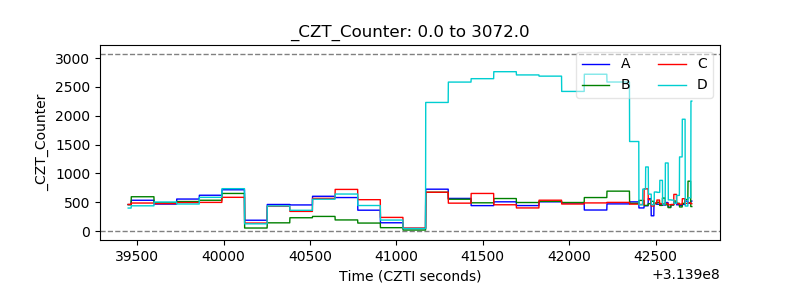 |
| +2.5 Volts monitor |  |
| +5 Volts monitor |  |
| _ROLL_ROT | 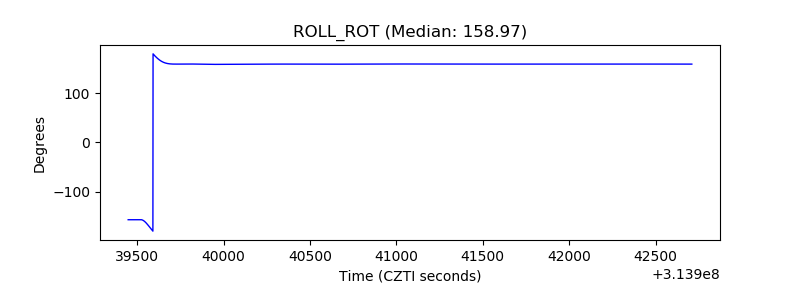 |
| _Roll_DEC | 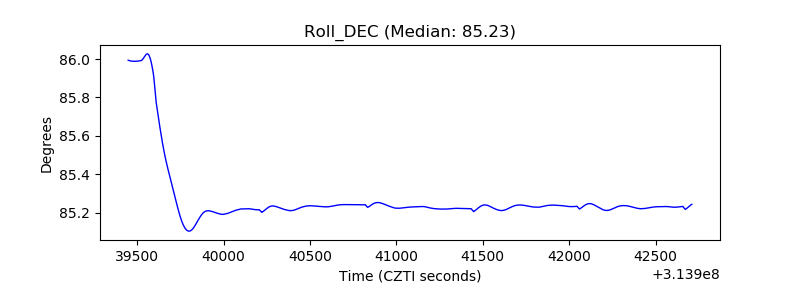 |
| _Roll_RA | 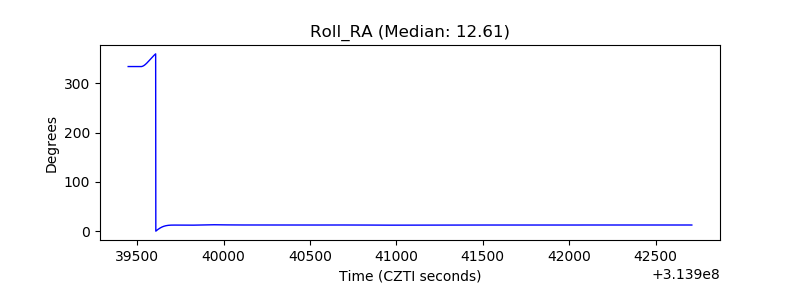 |
| Veto Counter | 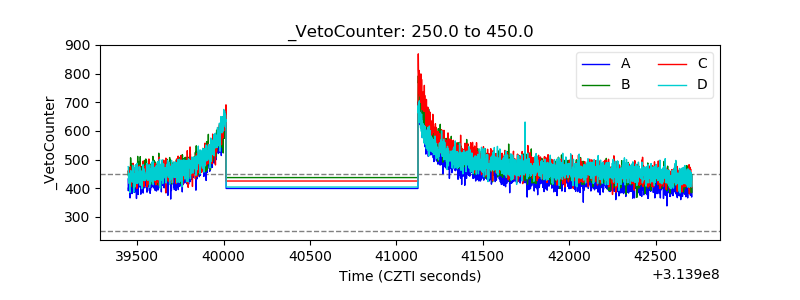 |