| Param | Original file | Final file |
|---|---|---|
| Filename | modeM0/AS1C05_013T02_9000003364_22757cztM0_level2.evt | modeM0/AS1C05_013T02_9000003364_22757cztM0_level2_quad_clean.evt |
| Size (bytes) | 411,984,000 | 101,741,760 |
| Size | 392.9 MB | 97.0 MB |
| Events in quadrant A | 2,425,752 | 715,928 |
| Events in quadrant B | 2,472,681 | 712,688 |
| Events in quadrant C | 2,441,016 | 683,905 |
| Events in quadrant D | 4,781,930 | 602,579 |
| Mode M0 | |||
|---|---|---|---|
| Quadrant | BADHDUFLAG | Total packets | Discarded packets |
| A | 0 | 10627 | 0 |
| B | 0 | 10681 | 0 |
| C | 0 | 10602 | 0 |
| D | 0 | 17707 | 0 |
| Mode M9 | |||
|---|---|---|---|
| Quadrant | BADHDUFLAG | Total packets | Discarded packets |
| A | 0 | 1 | 0 |
| B | 0 | 1 | 0 |
| C | 0 | 1 | 0 |
| D | 0 | 1 | 0 |
| Mode SS | |||
|---|---|---|---|
| Quadrant | BADHDUFLAG | Total packets | Discarded packets |
| A | 0 | 106 | 0 |
| B | 0 | 106 | 0 |
| C | 0 | 106 | 0 |
| D | 0 | 106 | 0 |
| Quadrant | Total seconds | Saturated seconds | Saturation percentage |
|---|---|---|---|
| A | 5224 | 49 | 0.937979% |
| B | 5225 | 42 | 0.803828% |
| C | 5225 | 73 | 1.397129% |
| D | 5225 | 996 | 19.062201% |
Noise dominated data is calculated using 1-second bins in cleaned event files. If a bin has >2000 counts, and if more than 50% of those come from <1% of pixels, then it is considered to be noise-dominated and hence unusable.
| Quadrant | # 1 sec bins | Bins with >0 counts | Bins with >2000 counts | High rate bins dominated by noise | Noise dominated (total time) | Noise dominated (detector-on time) | Marked lightcurve |
|---|---|---|---|---|---|---|---|
| A | 5224 | 5224 | 0 | 0 | 0.00% | 0.00% | 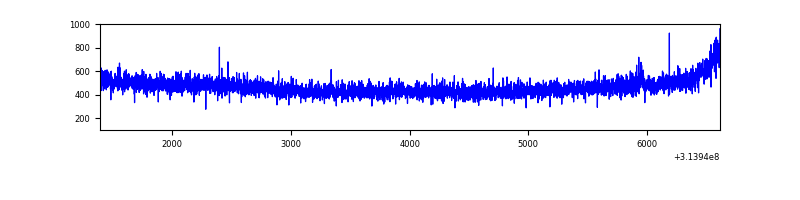 |
| B | 5225 | 5225 | 0 | 0 | 0.00% | 0.00% | 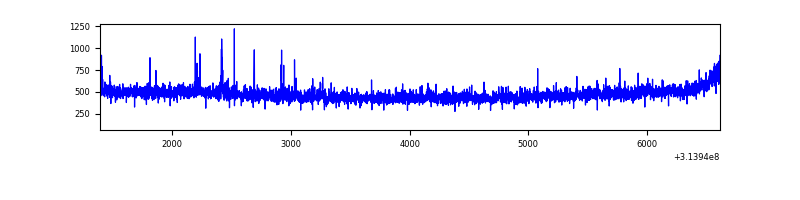 |
| C | 5225 | 5225 | 0 | 0 | 0.00% | 0.00% | 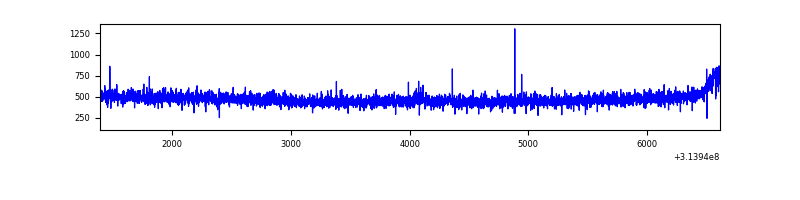 |
| D | 5225 | 5225 | 913 | 913 | 17.47% | 17.47% | 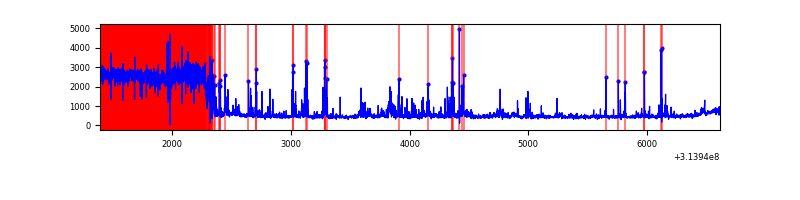 |
Top three noisy pixels from each quadrant. If the there are fewer than three noisy pixels in the level2.evt file, extra rows are filled as -1
| Pixel properties | Quadrant properties | ||||||
|---|---|---|---|---|---|---|---|
| Quadrant | DetID | PixID | Counts | Sigma | Mean | Median | Sigma |
| A | 13 | 252 | 10964 | 82.75 | 626 | 612 | 125.1 |
| A | 13 | 254 | 8641 | 64.18 | 626 | 612 | 125.1 |
| A | 0 | 226 | 5585 | 39.75 | 626 | 612 | 125.1 |
| B | 0 | 228 | 19982 | 168.01 | 620 | 605 | 115.3 |
| B | 0 | 230 | 19868 | 167.02 | 620 | 605 | 115.3 |
| B | 12 | 111 | 13477 | 111.61 | 620 | 605 | 115.3 |
| C | 14 | 238 | 95559 | 678.9 | 599 | 602 | 139.9 |
| C | 10 | 22 | 7373 | 48.41 | 599 | 602 | 139.9 |
| C | 13 | 61 | 4245 | 26.05 | 599 | 602 | 139.9 |
| D | 7 | 238 | 2049515 | 15364.77 | 552 | 535 | 133.4 |
| D | 1 | 52 | 351085 | 2628.68 | 552 | 535 | 133.4 |
| D | 12 | 233 | 149465 | 1116.79 | 552 | 535 | 133.4 |
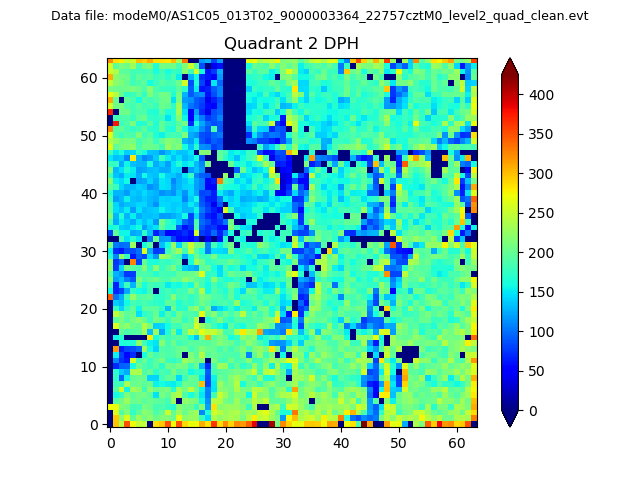
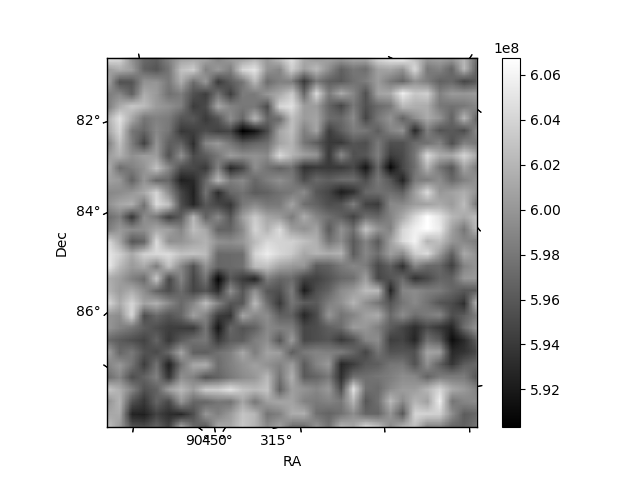
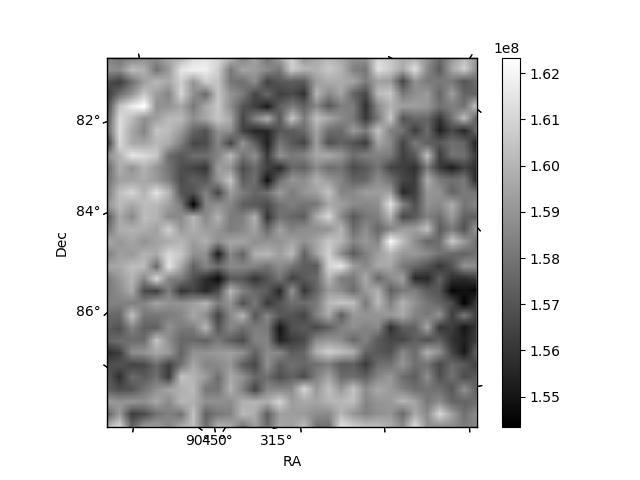
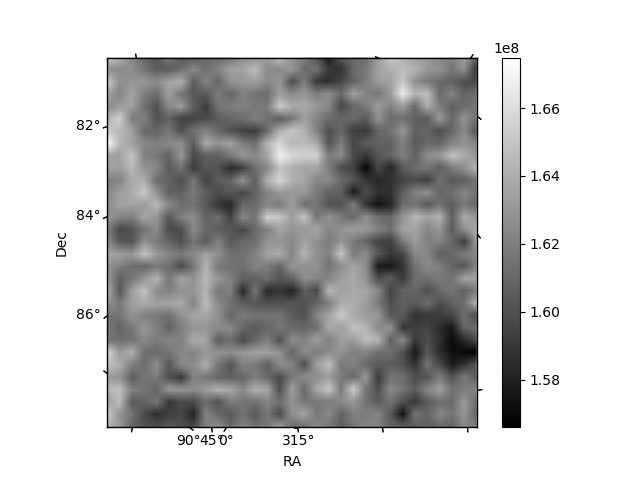
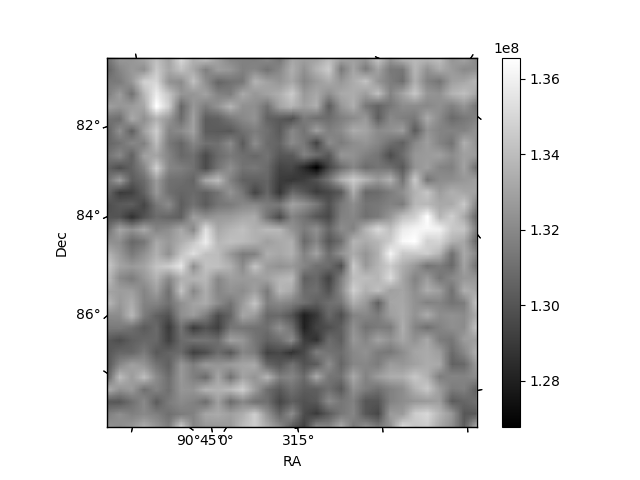
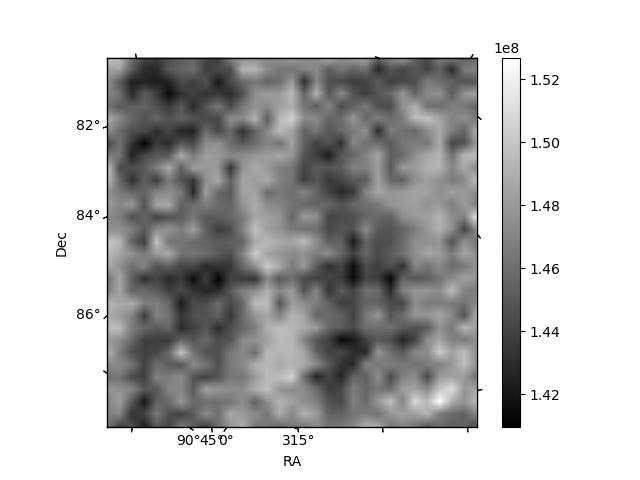
Histogram calculated using DETX and DETY for each event in the final _common_clean file
| Quadrant A | 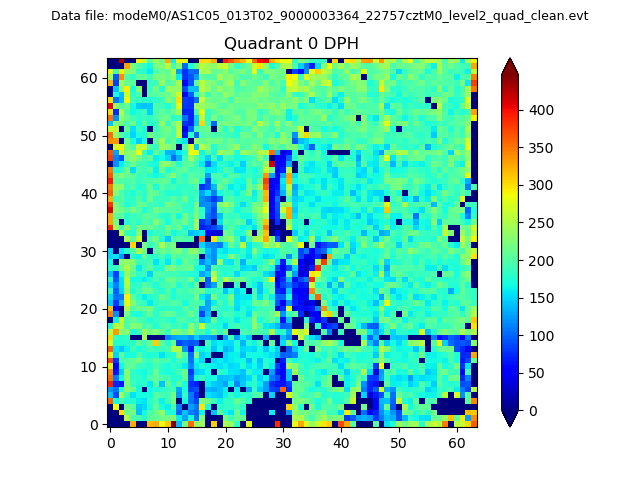 |
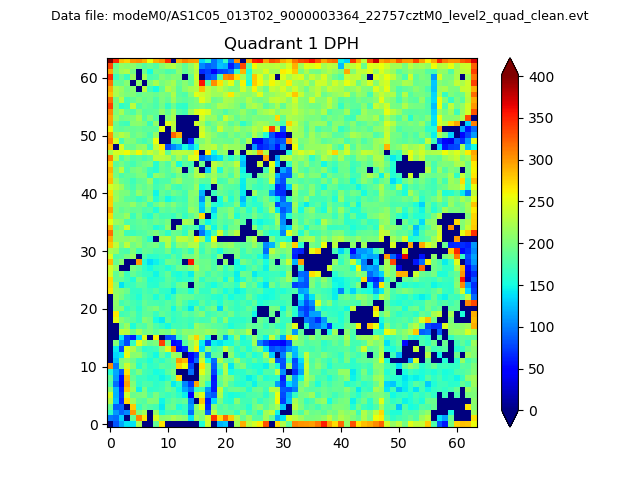 |
Quadrant B |
|---|---|---|---|
| Quadrant D | 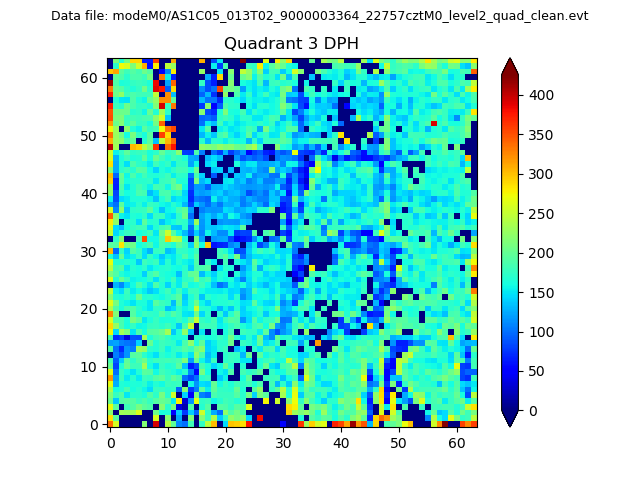 |
 |
Quadrant C |
| Plot type | Count rate plots | Images |
|---|---|---|
| Comparison with Poisson distribution Blue bars denote a histogram of data divided into 1 sec bins. Red curve is a Poisson curve with rate = median count rate of data. |
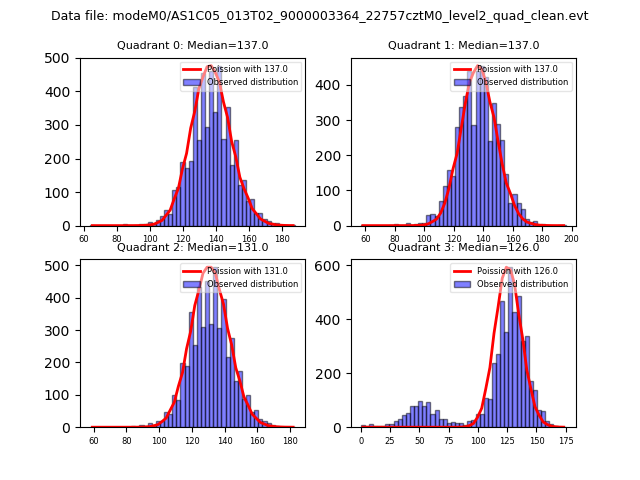 |
 |
| Quadrant-wise count rates Data is divided into 100 sec bins |
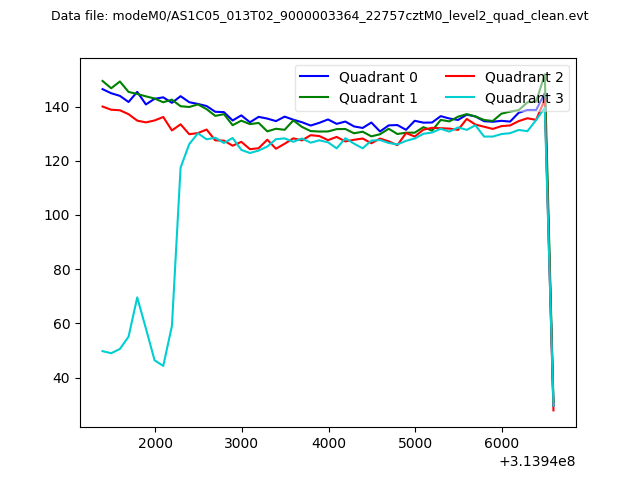 |
|
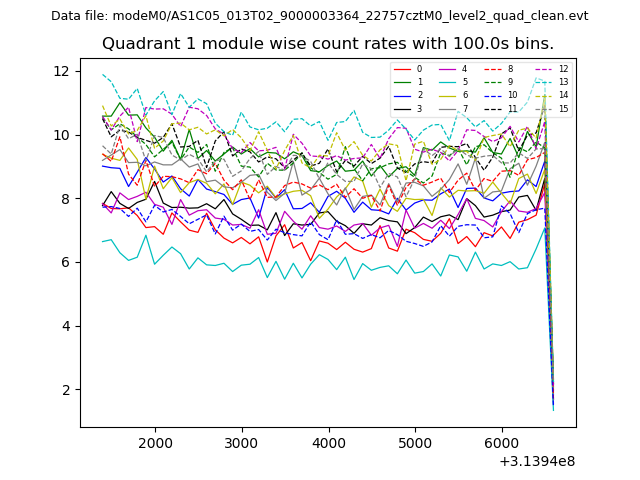
| Module-wise count rates for Quadrant A Data is divided into 100 sec bins |
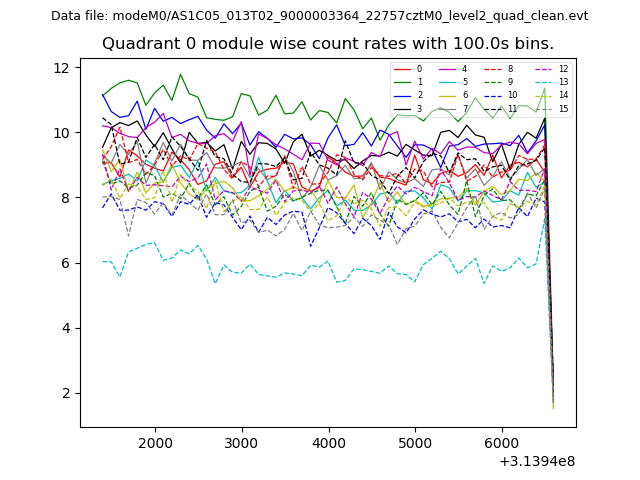 |
 |
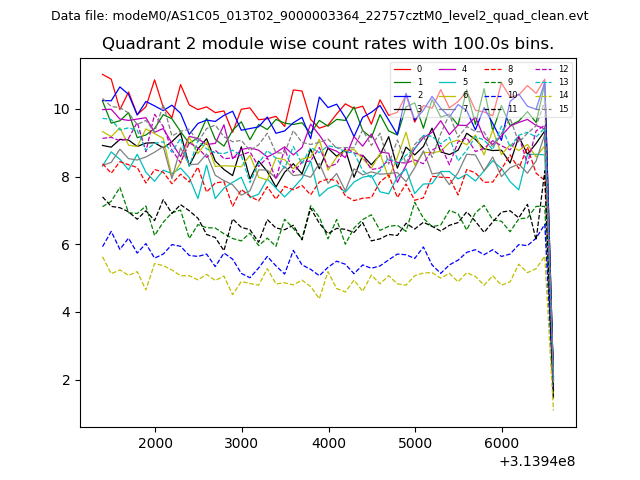
| Module-wise count rates for Quadrant B Data is divided into 100 sec bins |
 |
 |
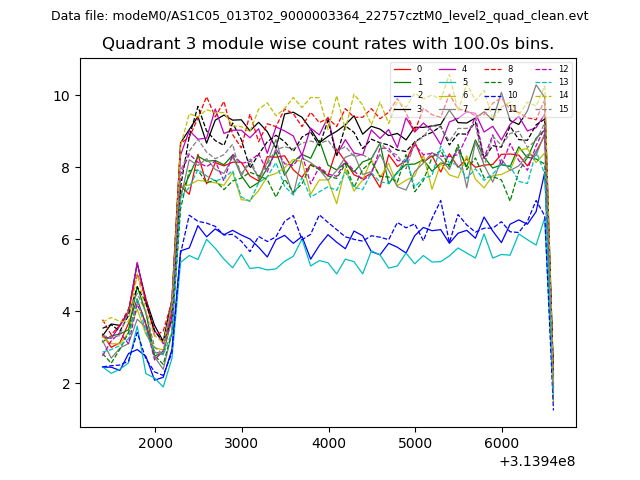
| Module-wise count rates for Quadrant C Data is divided into 100 sec bins |
 |
 |
| Module-wise count rates for Quadrant D Data is divided into 100 sec bins |
 |
 |
| Parameter | Plot |
|---|---|
| CZT HV Monitor | 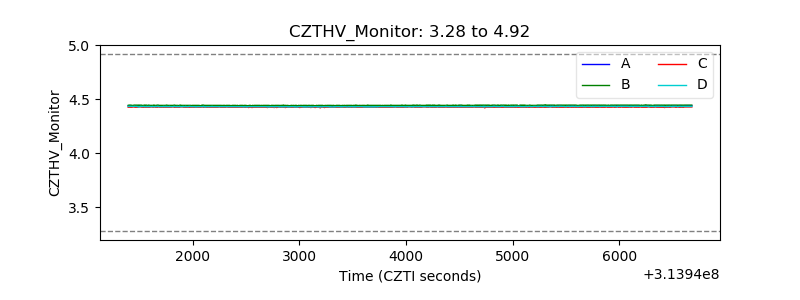 |
| D_VDD | 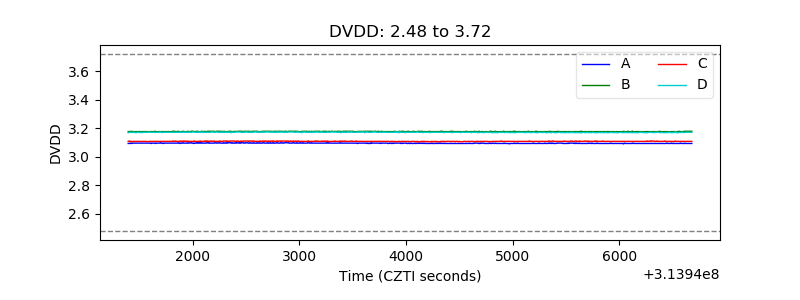 |
| Temperature 1 | 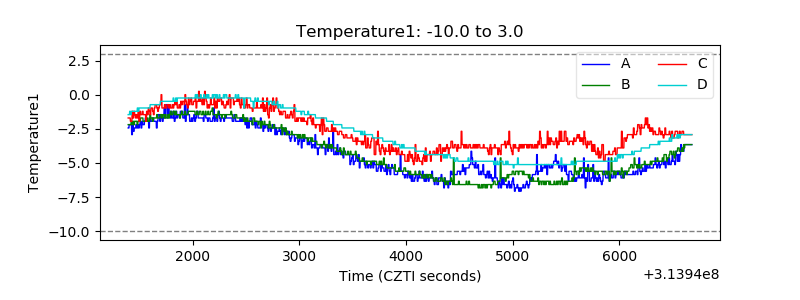 |
| Veto HV Monitor | 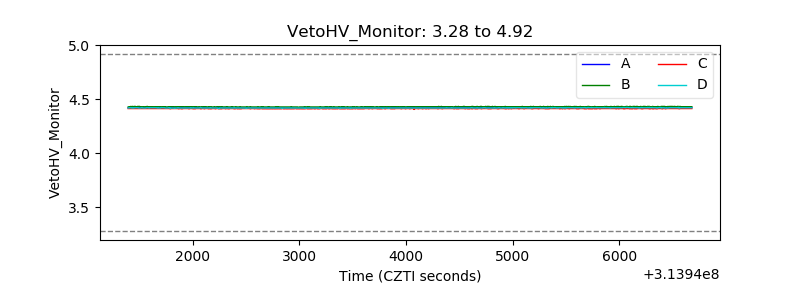 |
| Veto LLD | 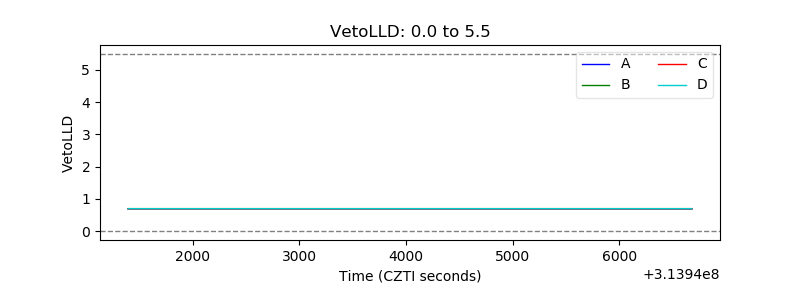 |
| Alpha Counter | 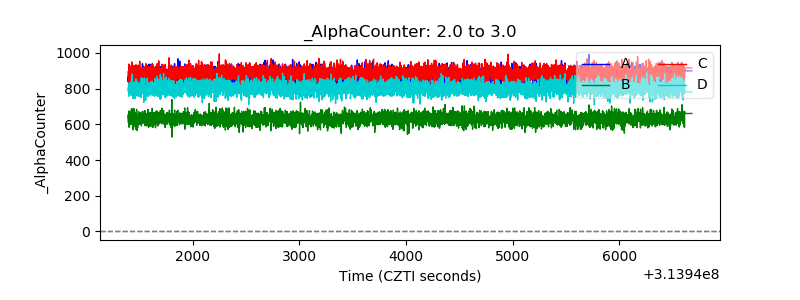 |
| _CPM_Rate | 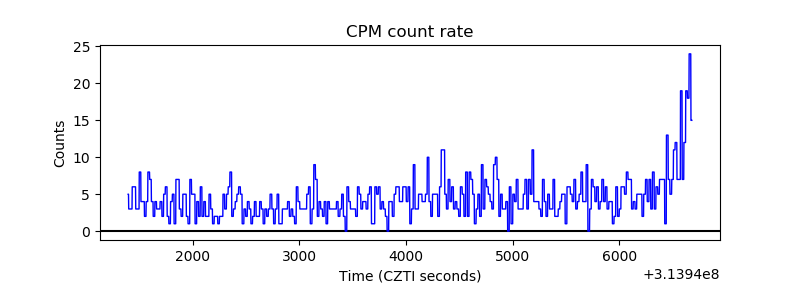 |
| CZT Counter | 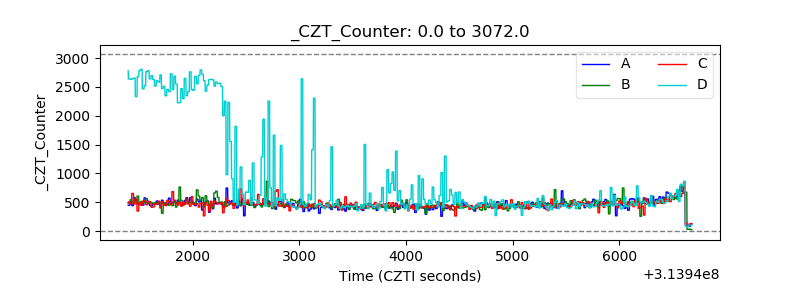 |
| +2.5 Volts monitor | 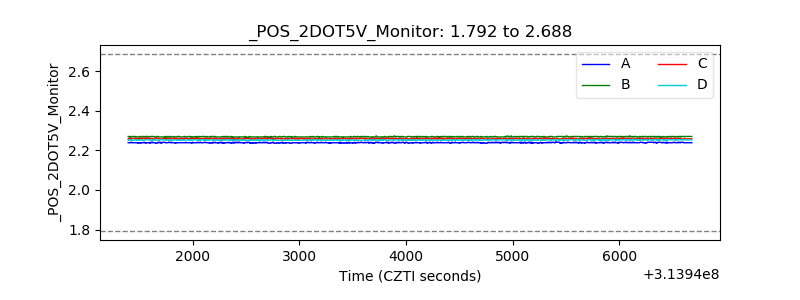 |
| +5 Volts monitor |  |
| _ROLL_ROT | 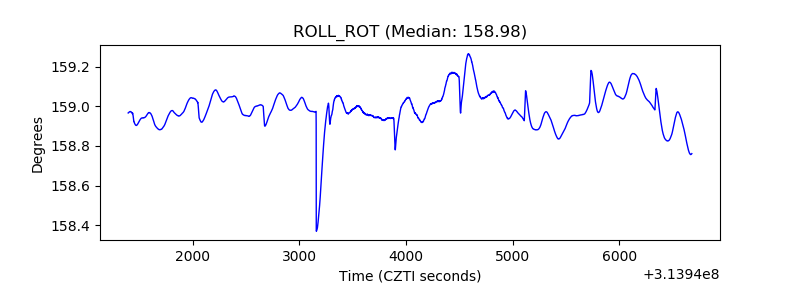 |
| _Roll_DEC | 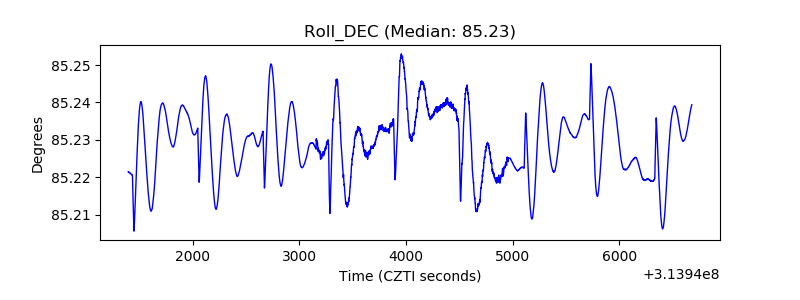 |
| _Roll_RA | 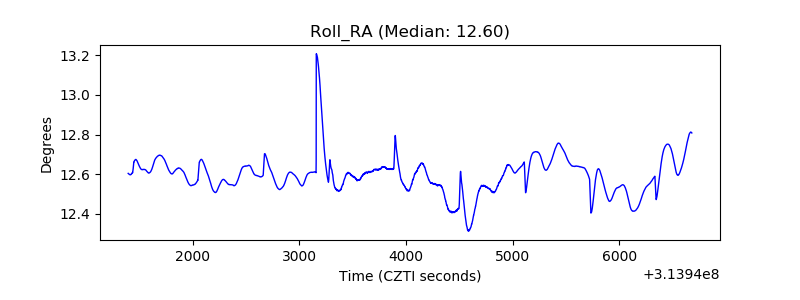 |
| Veto Counter | 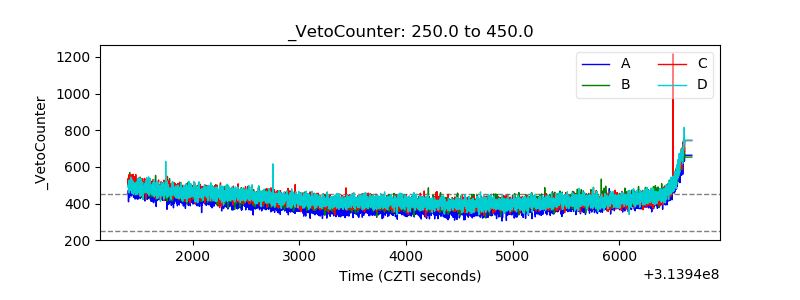 |