| Param | Original file | Final file |
|---|---|---|
| Filename | modeM0/AS1T03_168T01_9000003368_22771cztM0_level2.evt | modeM0/AS1T03_168T01_9000003368_22771cztM0_level2_quad_clean.evt |
| Size (bytes) | 215,614,080 | 57,576,960 |
| Size | 205.6 MB | 54.9 MB |
| Events in quadrant A | 1,455,461 | 396,083 |
| Events in quadrant B | 1,489,488 | 400,027 |
| Events in quadrant C | 1,420,671 | 380,350 |
| Events in quadrant D | 1,972,196 | 367,127 |
| Mode SS | |||
|---|---|---|---|
| Quadrant | BADHDUFLAG | Total packets | Discarded packets |
| A | 0 | 56 | 0 |
| B | 0 | 56 | 0 |
| C | 0 | 56 | 0 |
| D | 0 | 56 | 0 |
| Mode M9 | |||
|---|---|---|---|
| Quadrant | BADHDUFLAG | Total packets | Discarded packets |
| A | 0 | 10 | 0 |
| B | 0 | 10 | 0 |
| C | 0 | 10 | 0 |
| D | 0 | 10 | 0 |
| Mode M0 | |||
|---|---|---|---|
| Quadrant | BADHDUFLAG | Total packets | Discarded packets |
| A | 0 | 5945 | 1 |
| B | 0 | 6055 | 1 |
| C | 0 | 5895 | 1 |
| D | 0 | 7668 | 1 |
| Quadrant | Total seconds | Saturated seconds | Saturation percentage |
|---|---|---|---|
| A | 2802 | 73 | 2.605282% |
| B | 2802 | 78 | 2.783726% |
| C | 2802 | 100 | 3.568879% |
| D | 2802 | 183 | 6.531049% |
Noise dominated data is calculated using 1-second bins in cleaned event files. If a bin has >2000 counts, and if more than 50% of those come from <1% of pixels, then it is considered to be noise-dominated and hence unusable.
| Quadrant | # 1 sec bins | Bins with >0 counts | Bins with >2000 counts | High rate bins dominated by noise | Noise dominated (total time) | Noise dominated (detector-on time) | Marked lightcurve |
|---|---|---|---|---|---|---|---|
| A | 3742 | 2803 | 0 | 0 | 0.00% | 0.00% | 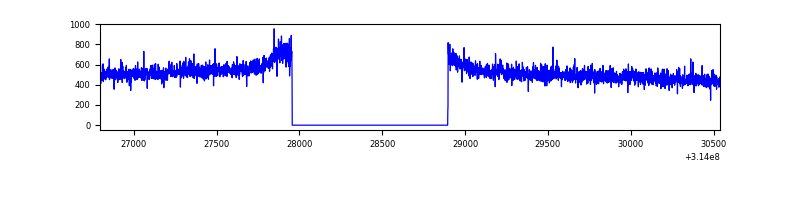 |
| B | 3742 | 2803 | 1 | 1 | 0.03% | 0.04% |  |
| C | 3742 | 2803 | 0 | 0 | 0.00% | 0.00% | 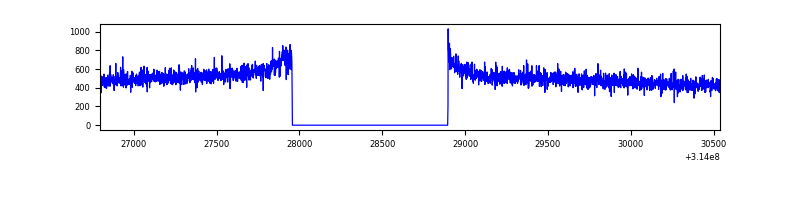 |
| D | 3742 | 2803 | 90 | 90 | 2.41% | 3.21% | 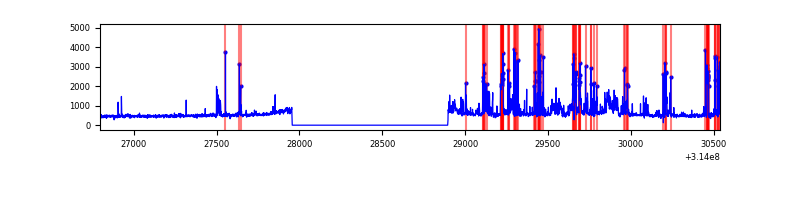 |
Top three noisy pixels from each quadrant. If the there are fewer than three noisy pixels in the level2.evt file, extra rows are filled as -1
| Pixel properties | Quadrant properties | ||||||
|---|---|---|---|---|---|---|---|
| Quadrant | DetID | PixID | Counts | Sigma | Mean | Median | Sigma |
| A | 10 | 17 | 42232 | 560.59 | 366 | 358 | 74.7 |
| A | 13 | 254 | 4969 | 61.73 | 366 | 358 | 74.7 |
| A | 0 | 226 | 3313 | 39.56 | 366 | 358 | 74.7 |
| B | 0 | 190 | 36402 | 521.06 | 361 | 352 | 69.2 |
| B | 0 | 228 | 18573 | 263.36 | 361 | 352 | 69.2 |
| B | 0 | 230 | 16494 | 233.32 | 361 | 352 | 69.2 |
| C | 14 | 238 | 55858 | 677.6 | 349 | 350 | 81.9 |
| C | 13 | 61 | 2532 | 26.64 | 349 | 350 | 81.9 |
| C | 0 | 10 | 2442 | 25.54 | 349 | 350 | 81.9 |
| D | 1 | 52 | 574390 | 6642.29 | 350 | 340 | 86.4 |
| D | 2 | 152 | 24955 | 284.82 | 350 | 340 | 86.4 |
| D | 7 | 238 | 15581 | 176.35 | 350 | 340 | 86.4 |
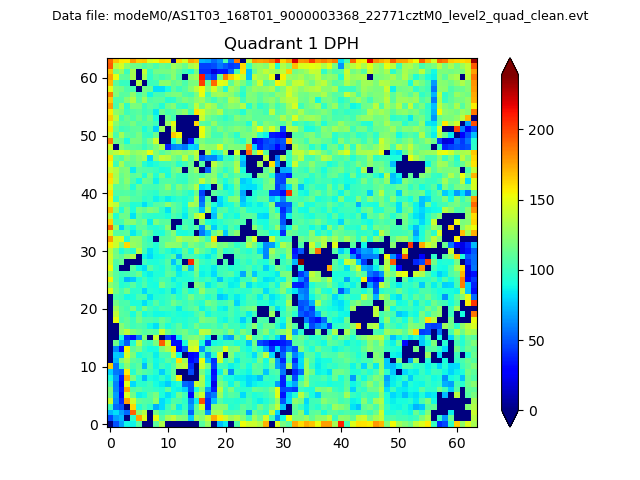
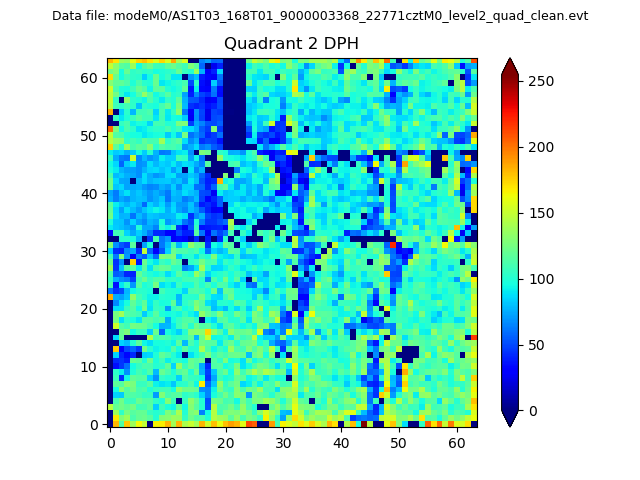
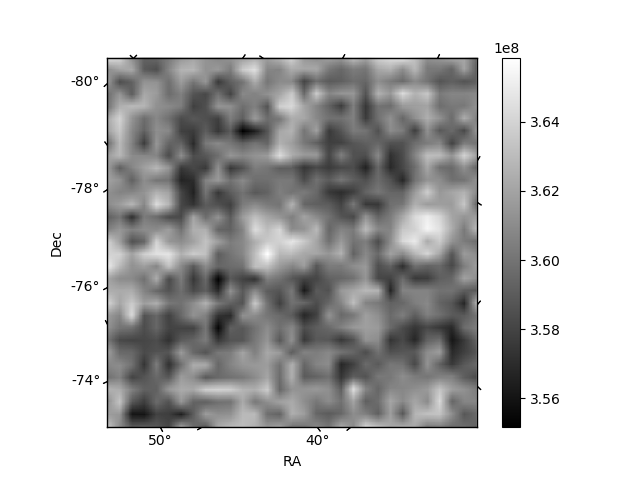
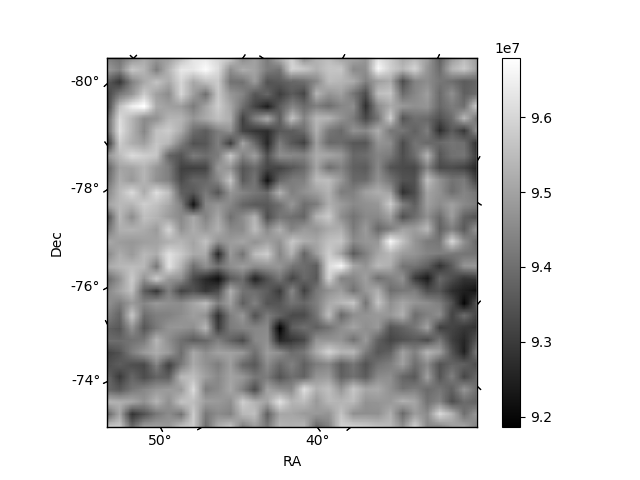
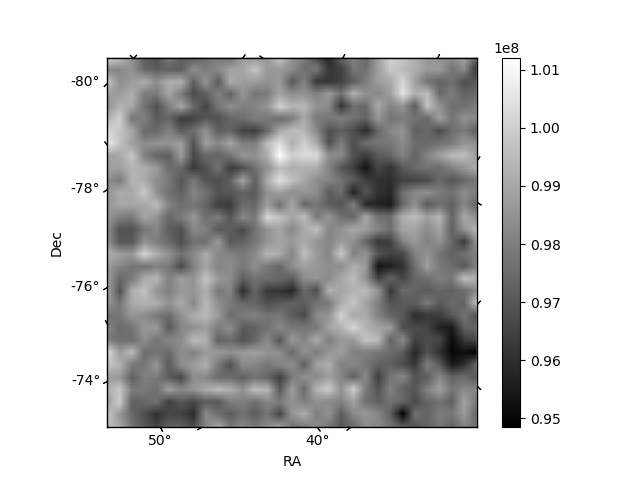
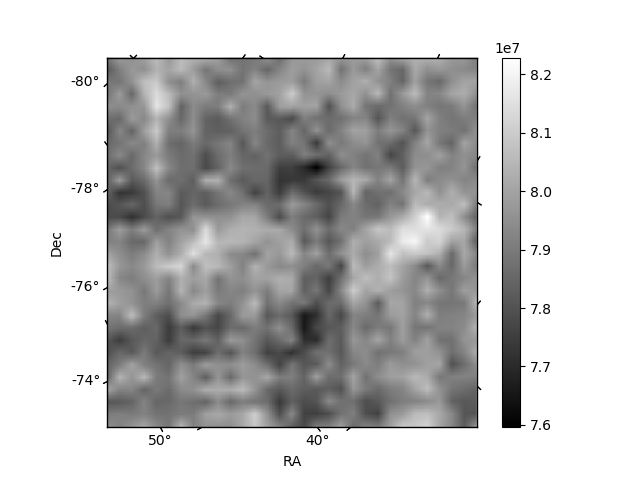
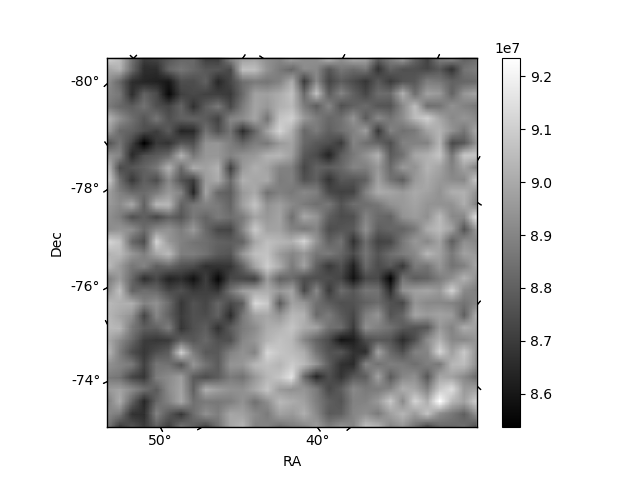
Histogram calculated using DETX and DETY for each event in the final _common_clean file
| Quadrant A | 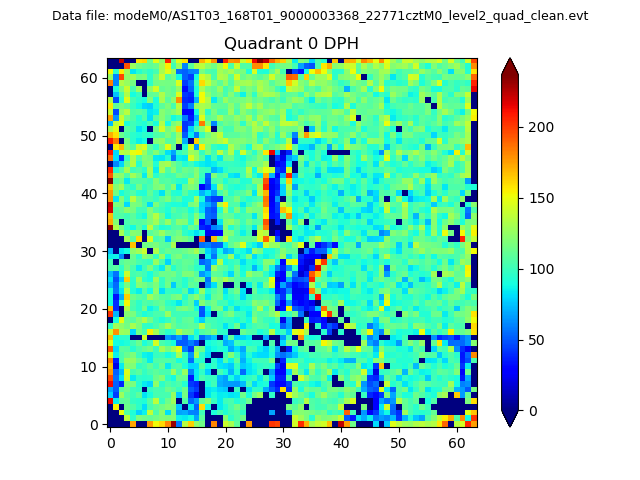 |
 |
Quadrant B |
|---|---|---|---|
| Quadrant D | 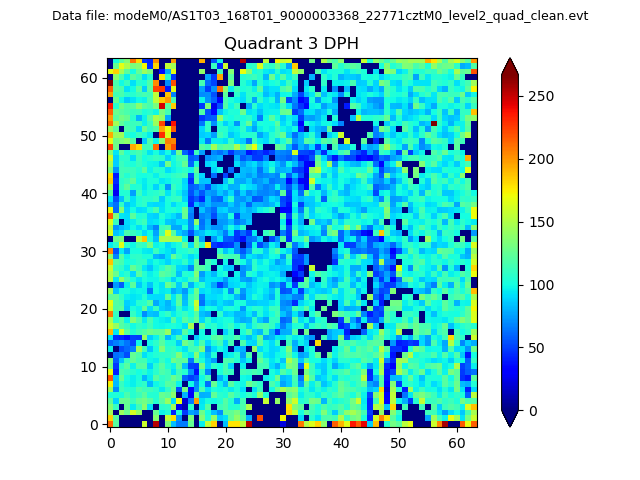 |
 |
Quadrant C |
| Plot type | Count rate plots | Images |
|---|---|---|
| Comparison with Poisson distribution Blue bars denote a histogram of data divided into 1 sec bins. Red curve is a Poisson curve with rate = median count rate of data. |
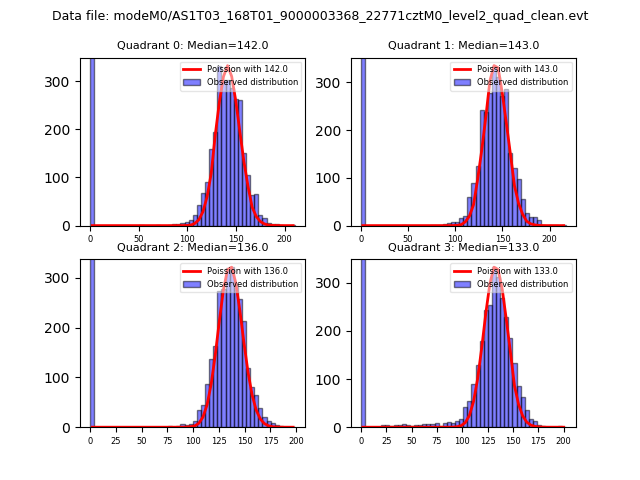 |
 |
| Quadrant-wise count rates Data is divided into 100 sec bins |
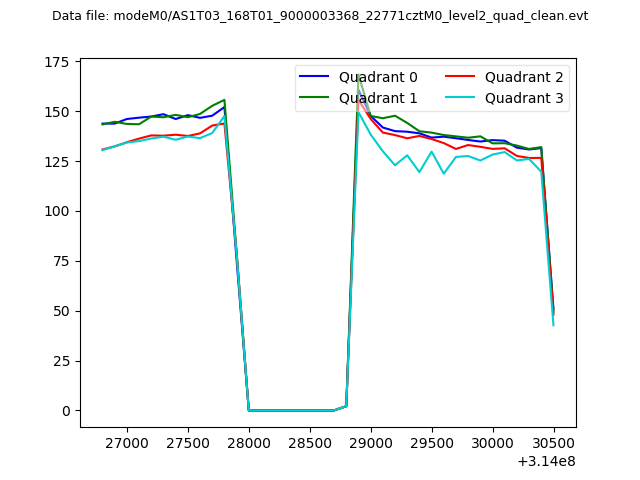 |
|
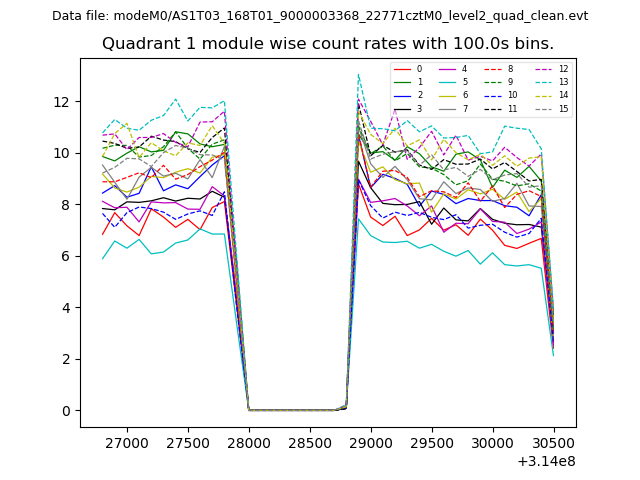
| Module-wise count rates for Quadrant A Data is divided into 100 sec bins |
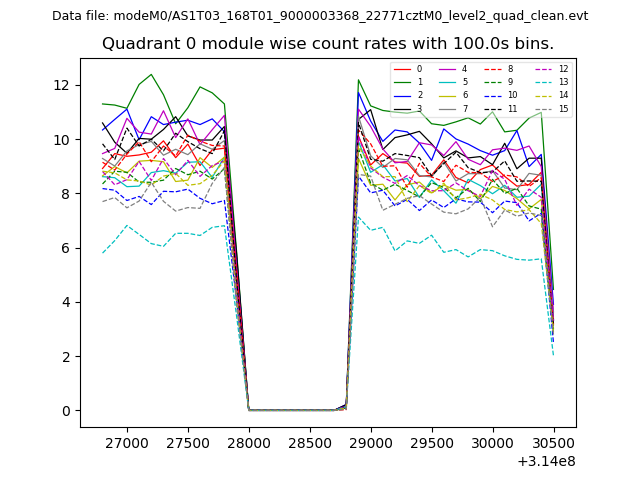 |
 |
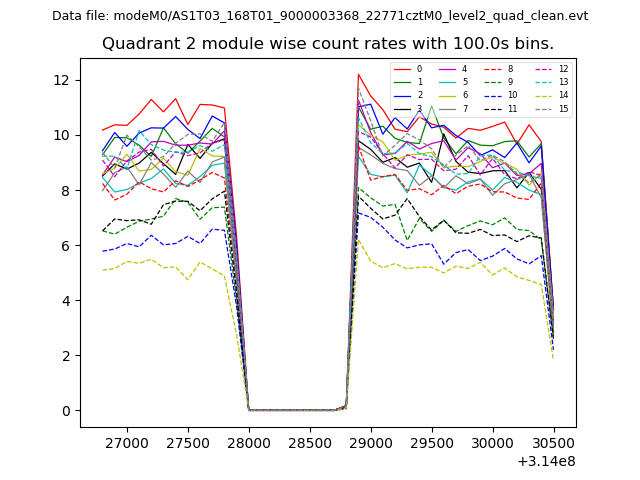
| Module-wise count rates for Quadrant B Data is divided into 100 sec bins |
 |
 |
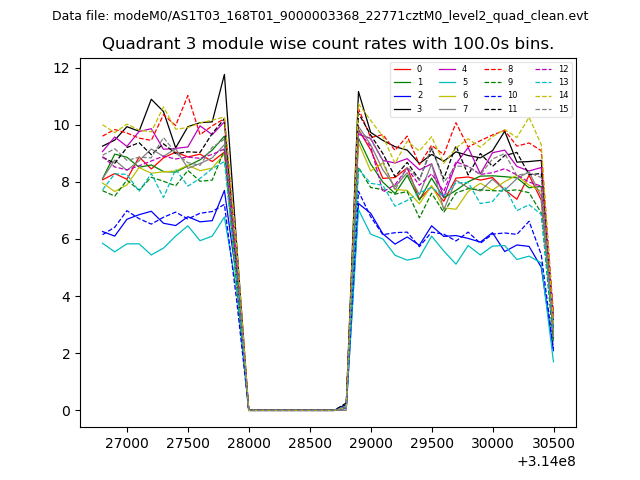
| Module-wise count rates for Quadrant C Data is divided into 100 sec bins |
 |
 |
| Module-wise count rates for Quadrant D Data is divided into 100 sec bins |
 |
 |
| Parameter | Plot |
|---|---|
| CZT HV Monitor | 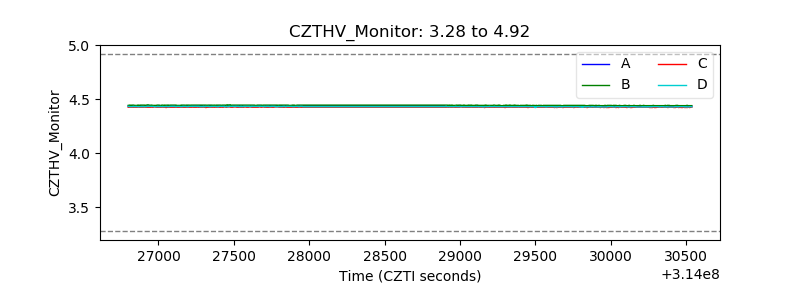 |
| D_VDD | 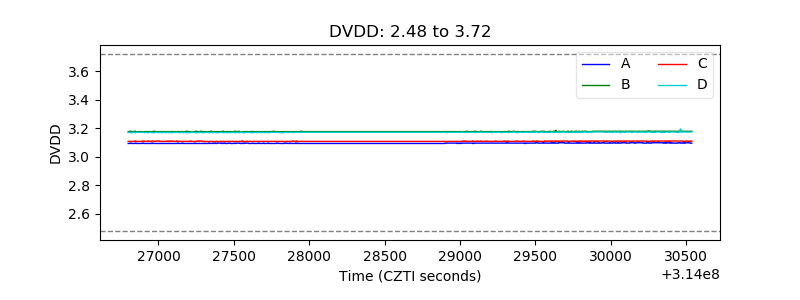 |
| Temperature 1 | 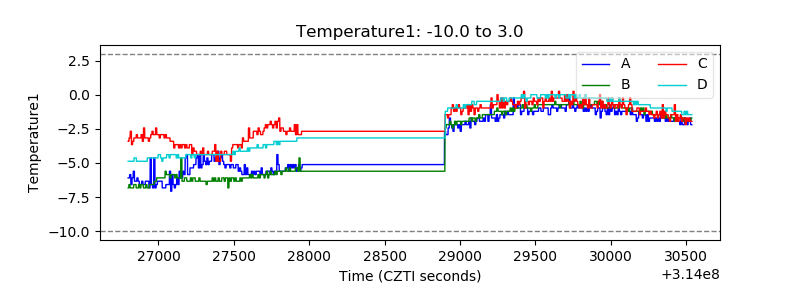 |
| Veto HV Monitor |  |
| Veto LLD | 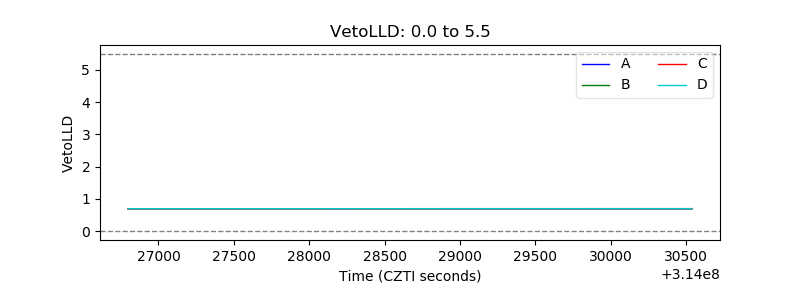 |
| Alpha Counter | 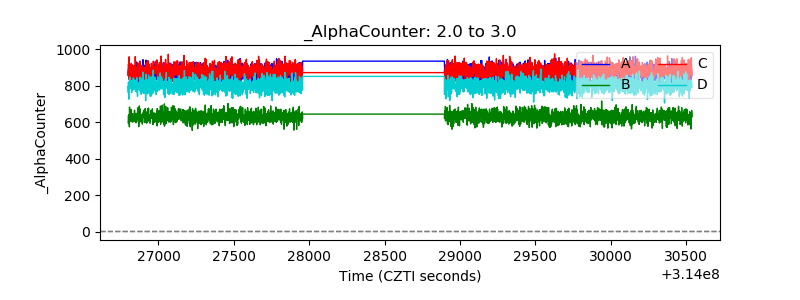 |
| _CPM_Rate | 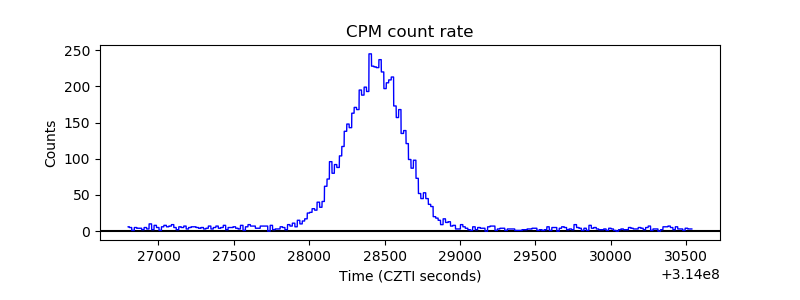 |
| CZT Counter | 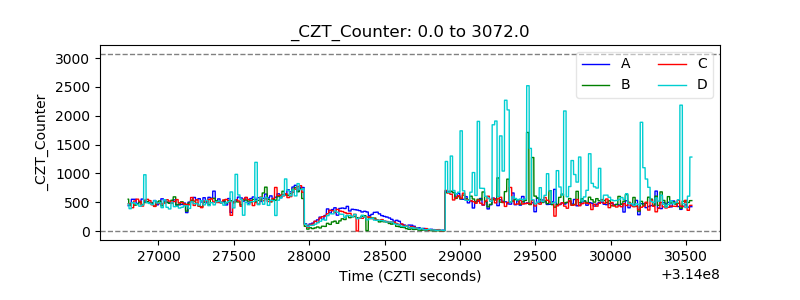 |
| +2.5 Volts monitor |  |
| +5 Volts monitor |  |
| _ROLL_ROT | 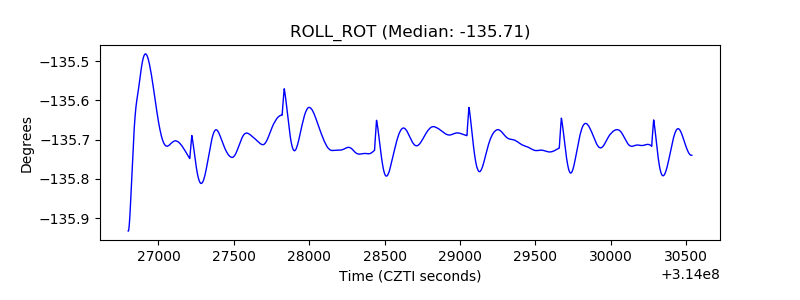 |
| _Roll_DEC |  |
| _Roll_RA | 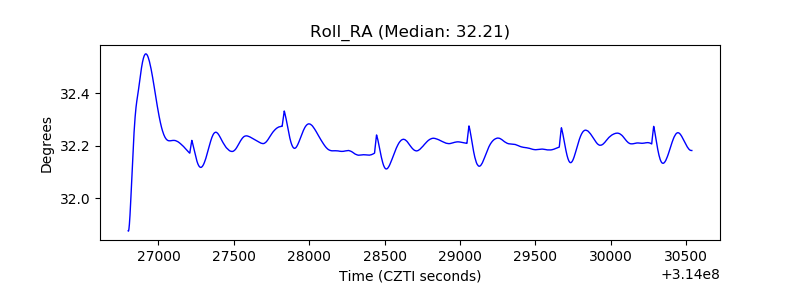 |
| Veto Counter | 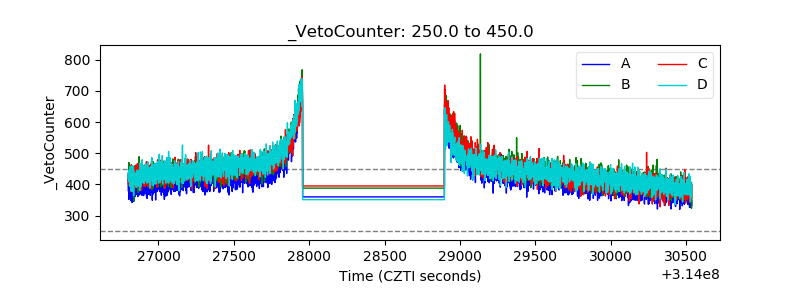 |