| Param | Original file | Final file |
|---|---|---|
| Filename | modeM0/AS1T03_168T01_9000003368_22772cztM0_level2.evt | modeM0/AS1T03_168T01_9000003368_22772cztM0_level2_quad_clean.evt |
| Size (bytes) | 446,811,840 | 126,368,640 |
| Size | 426.1 MB | 120.5 MB |
| Events in quadrant A | 3,037,498 | 865,282 |
| Events in quadrant B | 3,143,271 | 869,541 |
| Events in quadrant C | 2,996,171 | 828,120 |
| Events in quadrant D | 3,914,375 | 812,761 |
| Mode SS | |||
|---|---|---|---|
| Quadrant | BADHDUFLAG | Total packets | Discarded packets |
| A | 0 | 132 | 0 |
| B | 0 | 132 | 0 |
| C | 0 | 132 | 0 |
| D | 0 | 132 | 0 |
| Mode M9 | |||
|---|---|---|---|
| Quadrant | BADHDUFLAG | Total packets | Discarded packets |
| A | 0 | 5 | 0 |
| B | 0 | 5 | 0 |
| C | 0 | 5 | 0 |
| D | 0 | 5 | 0 |
| Mode M0 | |||
|---|---|---|---|
| Quadrant | BADHDUFLAG | Total packets | Discarded packets |
| A | 0 | 13271 | 2 |
| B | 0 | 13489 | 1 |
| C | 0 | 13264 | 1 |
| D | 0 | 15954 | 1 |
| Quadrant | Total seconds | Saturated seconds | Saturation percentage |
|---|---|---|---|
| A | 6476 | 56 | 0.864731% |
| B | 6477 | 69 | 1.065308% |
| C | 6477 | 98 | 1.513046% |
| D | 6477 | 162 | 2.501158% |
Noise dominated data is calculated using 1-second bins in cleaned event files. If a bin has >2000 counts, and if more than 50% of those come from <1% of pixels, then it is considered to be noise-dominated and hence unusable.
| Quadrant | # 1 sec bins | Bins with >0 counts | Bins with >2000 counts | High rate bins dominated by noise | Noise dominated (total time) | Noise dominated (detector-on time) | Marked lightcurve |
|---|---|---|---|---|---|---|---|
| A | 7011 | 6477 | 0 | 0 | 0.00% | 0.00% | 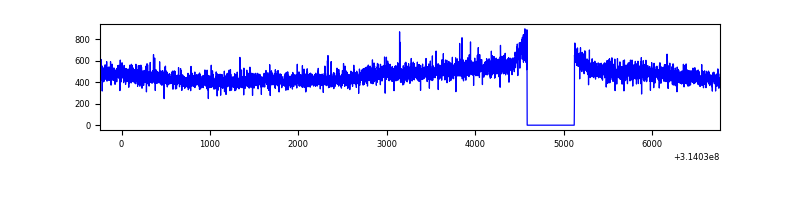 |
| B | 7012 | 6478 | 2 | 2 | 0.03% | 0.03% | 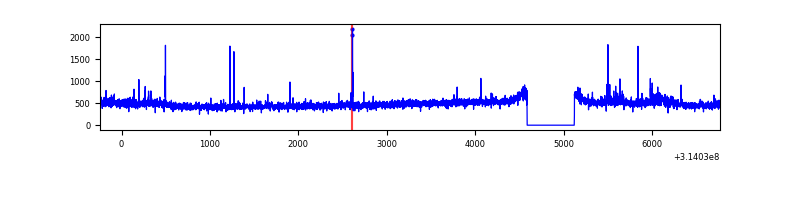 |
| C | 7012 | 6478 | 0 | 0 | 0.00% | 0.00% | 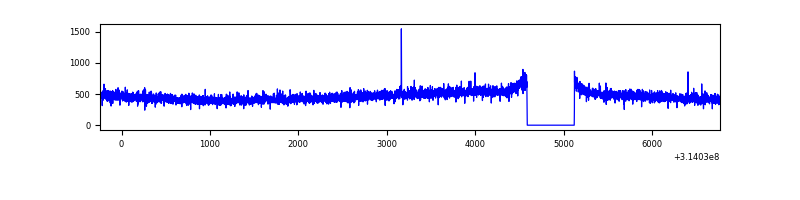 |
| D | 7012 | 6478 | 111 | 111 | 1.58% | 1.71% | 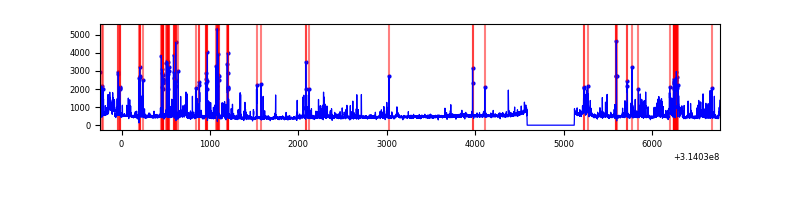 |
Top three noisy pixels from each quadrant. If the there are fewer than three noisy pixels in the level2.evt file, extra rows are filled as -1
| Pixel properties | Quadrant properties | ||||||
|---|---|---|---|---|---|---|---|
| Quadrant | DetID | PixID | Counts | Sigma | Mean | Median | Sigma |
| A | 10 | 17 | 41208 | 261.1 | 774 | 759 | 154.9 |
| A | 13 | 254 | 11912 | 71.99 | 774 | 759 | 154.9 |
| A | 0 | 226 | 6961 | 40.03 | 774 | 759 | 154.9 |
| B | 0 | 230 | 70781 | 485.22 | 771 | 752 | 144.3 |
| B | 0 | 228 | 33985 | 230.27 | 771 | 752 | 144.3 |
| B | 12 | 111 | 16434 | 108.66 | 771 | 752 | 144.3 |
| C | 14 | 238 | 117767 | 681.45 | 736 | 740 | 171.7 |
| C | 13 | 61 | 5418 | 27.24 | 736 | 740 | 171.7 |
| C | 10 | 22 | 4648 | 22.76 | 736 | 740 | 171.7 |
| D | 1 | 52 | 774795 | 4295.59 | 744 | 722 | 180.2 |
| D | 12 | 233 | 148060 | 817.63 | 744 | 722 | 180.2 |
| D | 9 | 85 | 62129 | 340.77 | 744 | 722 | 180.2 |
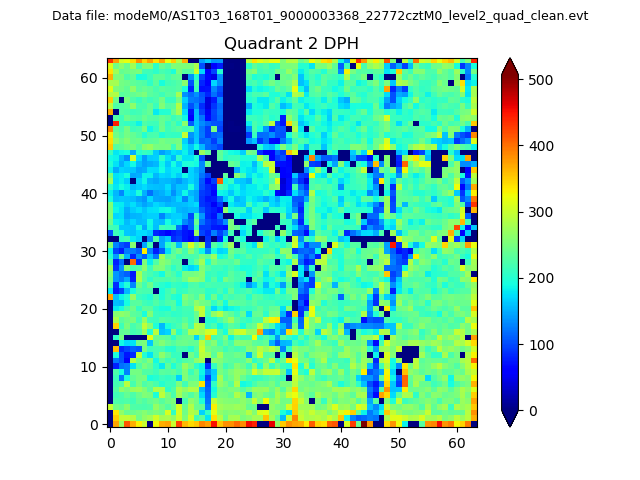
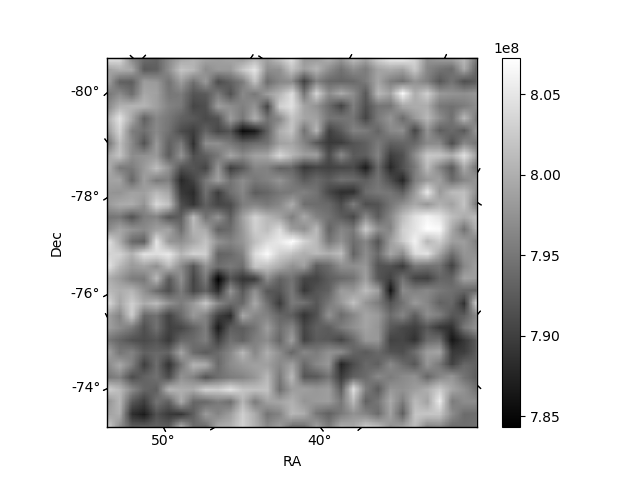
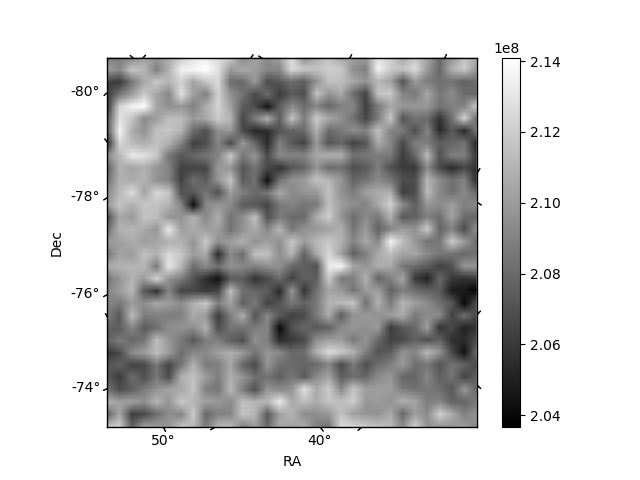
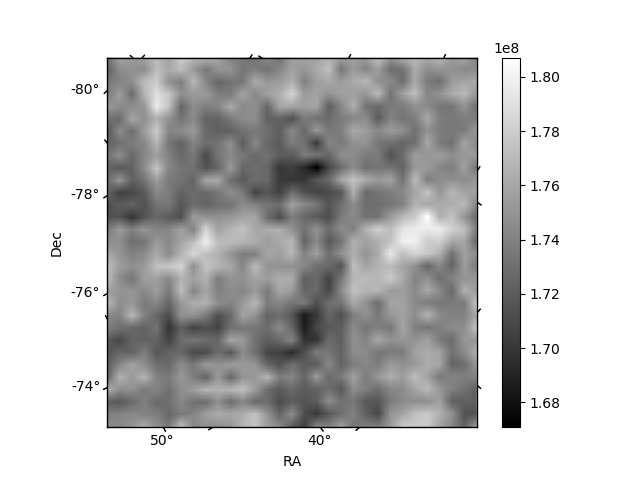
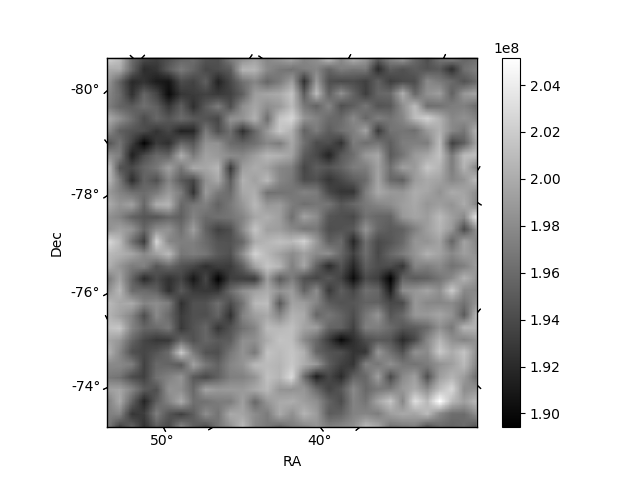
Histogram calculated using DETX and DETY for each event in the final _common_clean file
| Quadrant A | 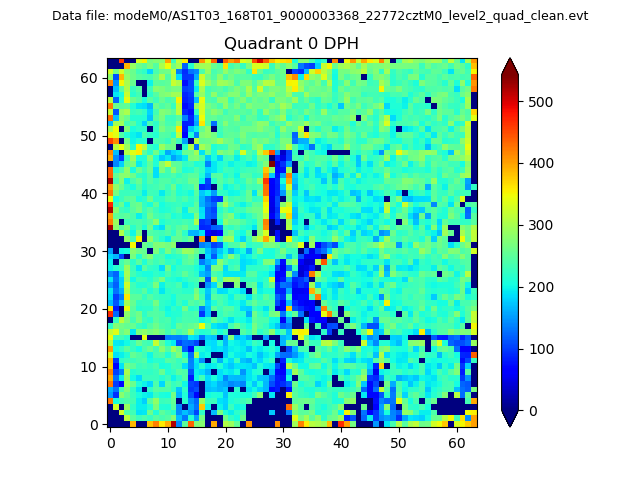 |
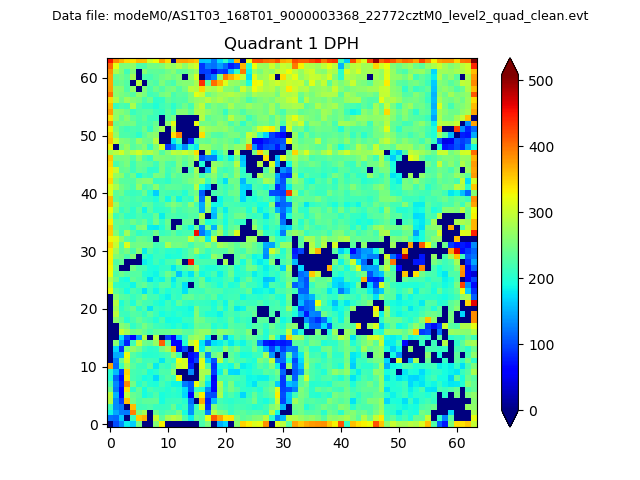 |
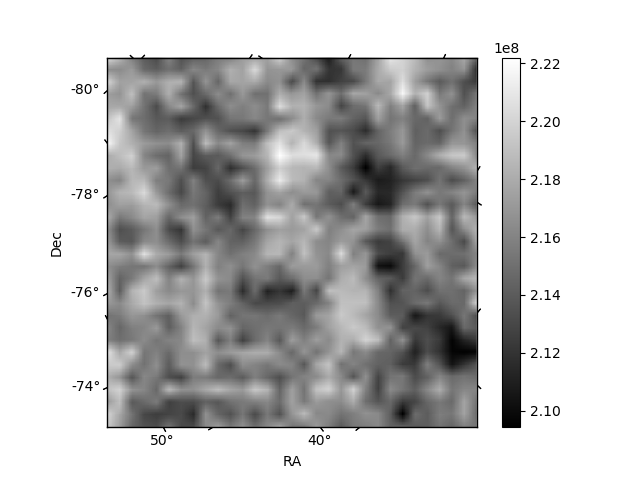
Quadrant B |
|---|---|---|---|
| Quadrant D | 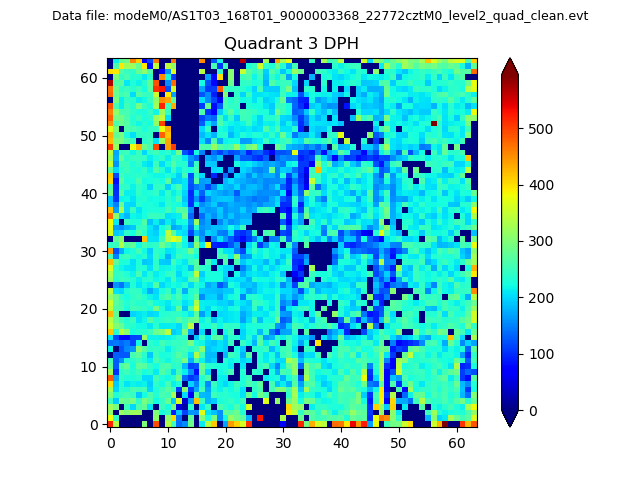 |
 |
Quadrant C |
| Plot type | Count rate plots | Images |
|---|---|---|
| Comparison with Poisson distribution Blue bars denote a histogram of data divided into 1 sec bins. Red curve is a Poisson curve with rate = median count rate of data. |
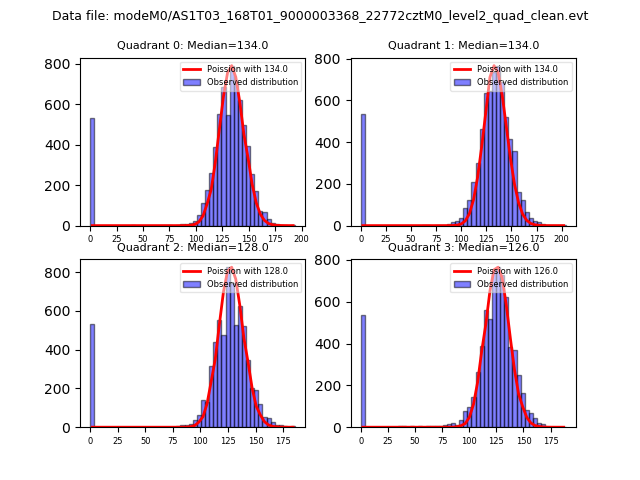 |
 |
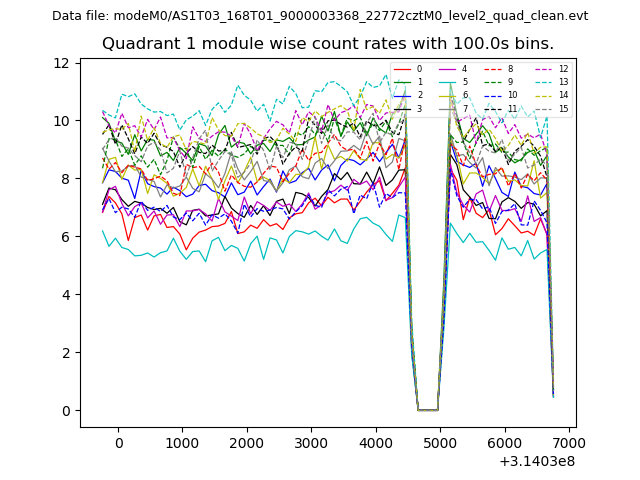
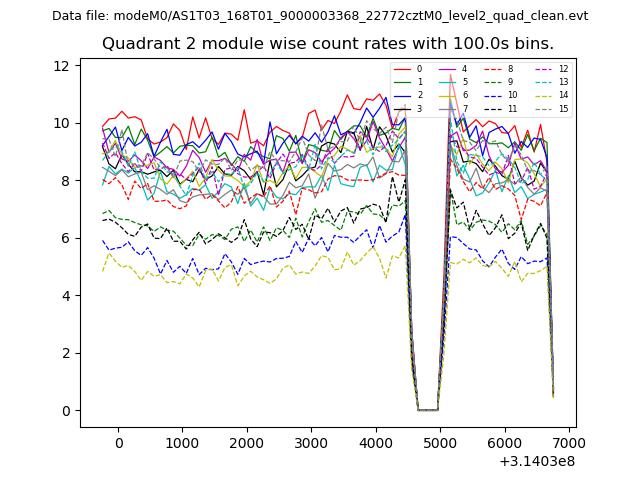
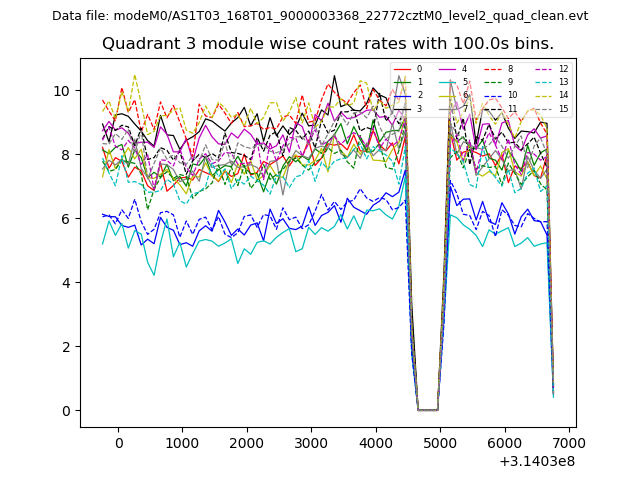
| Quadrant-wise count rates Data is divided into 100 sec bins |
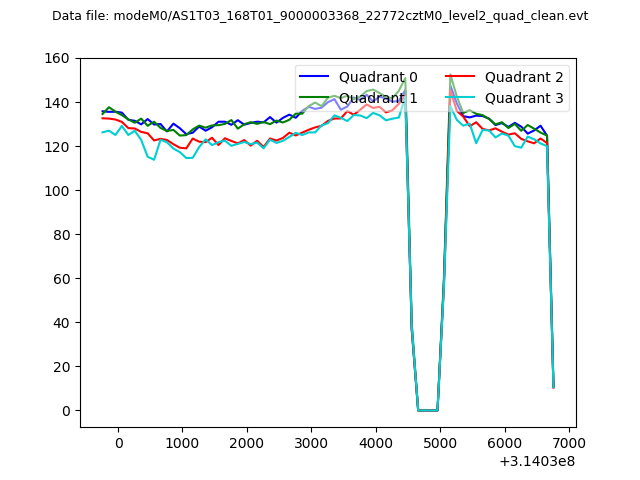 |
|
| Module-wise count rates for Quadrant A Data is divided into 100 sec bins |
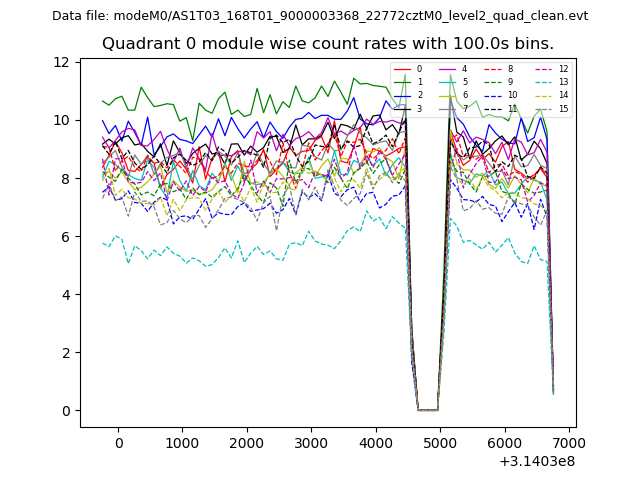 |
 |
| Module-wise count rates for Quadrant B Data is divided into 100 sec bins |
 |
 |
| Module-wise count rates for Quadrant C Data is divided into 100 sec bins |
 |
 |
| Module-wise count rates for Quadrant D Data is divided into 100 sec bins |
 |
 |
| Parameter | Plot |
|---|---|
| CZT HV Monitor | 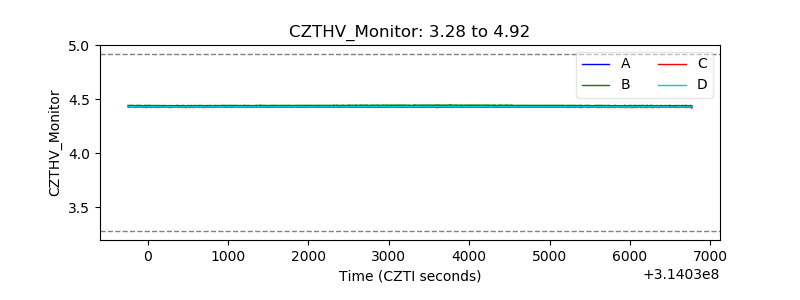 |
| D_VDD | 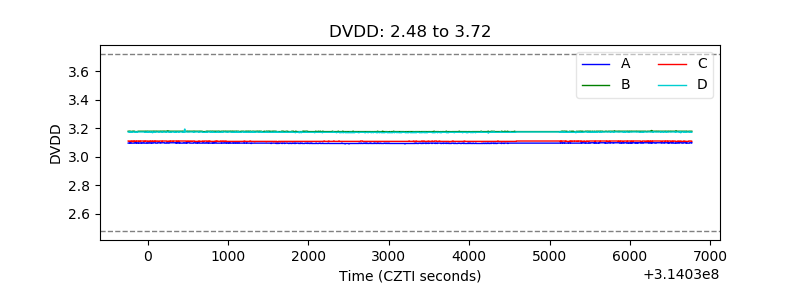 |
| Temperature 1 | 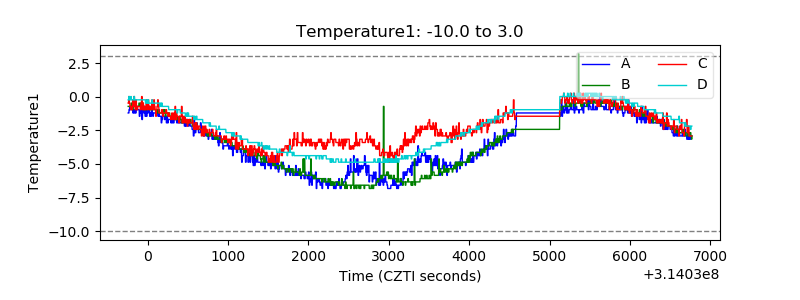 |
| Veto HV Monitor | 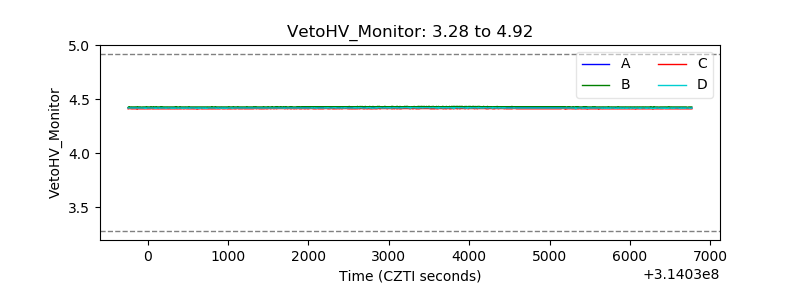 |
| Veto LLD | 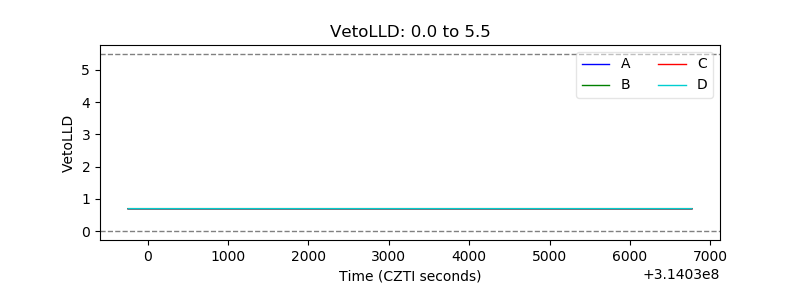 |
| Alpha Counter | 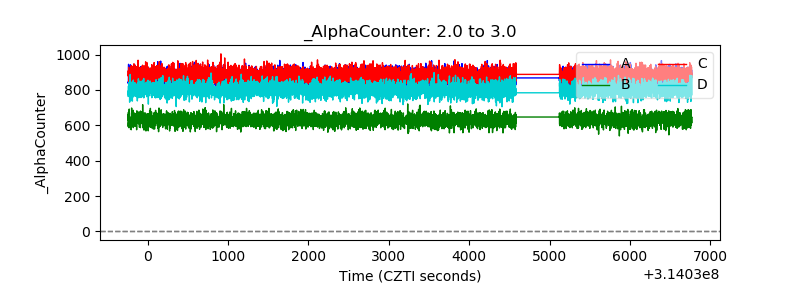 |
| _CPM_Rate | 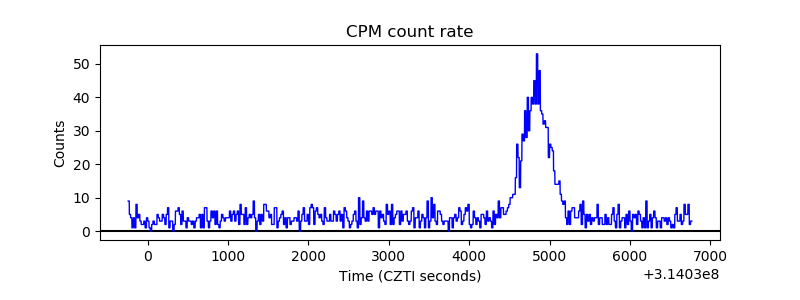 |
| CZT Counter | 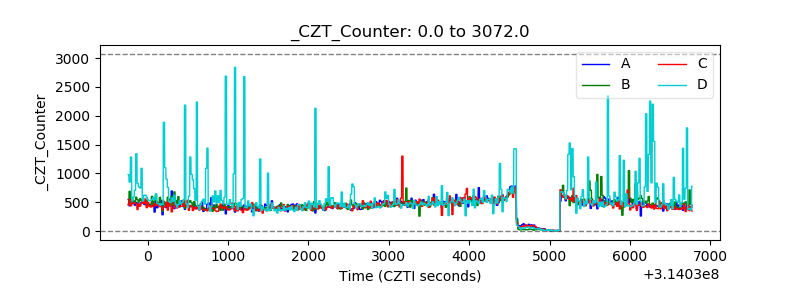 |
| +2.5 Volts monitor |  |
| +5 Volts monitor | 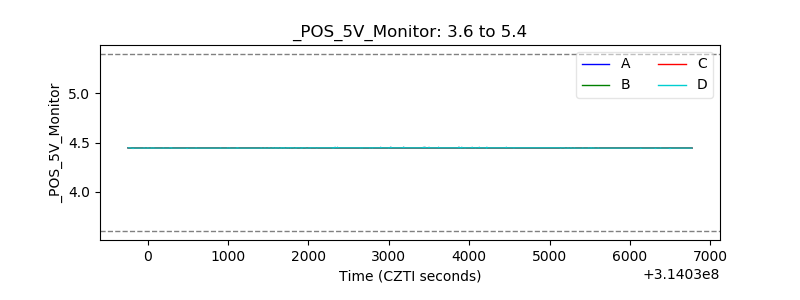 |
| _ROLL_ROT | 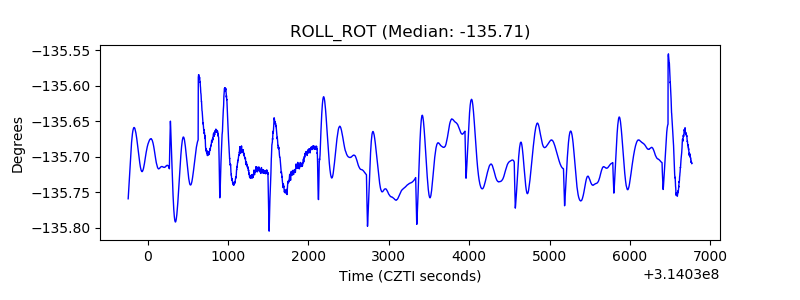 |
| _Roll_DEC | 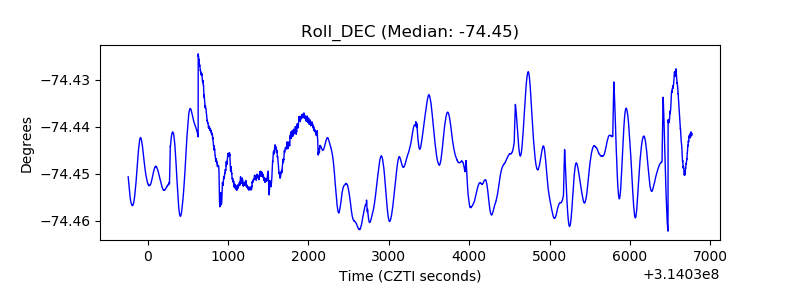 |
| _Roll_RA | 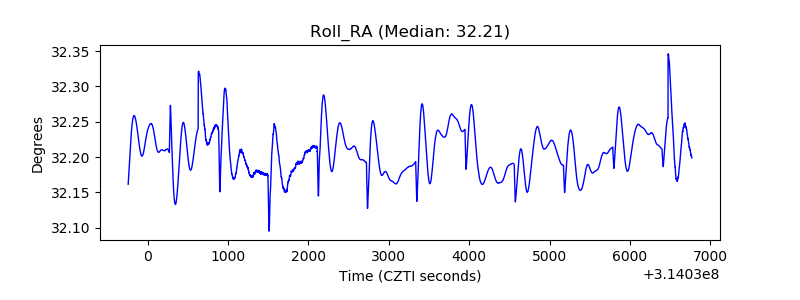 |
| Veto Counter | 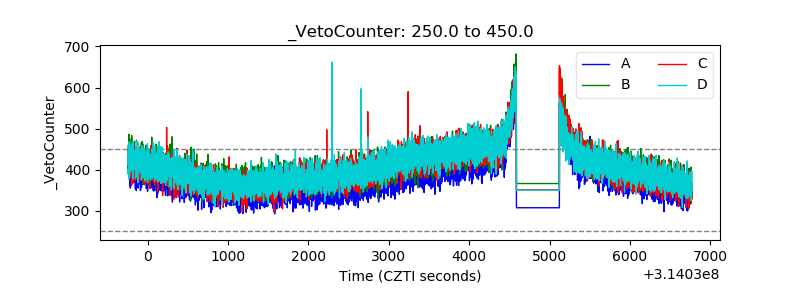 |