| Param | Original file | Final file |
|---|---|---|
| Filename | modeM0/AS1T03_168T01_9000003368_22773cztM0_level2.evt | modeM0/AS1T03_168T01_9000003368_22773cztM0_level2_quad_clean.evt |
| Size (bytes) | 487,540,800 | 136,949,760 |
| Size | 465.0 MB | 130.6 MB |
| Events in quadrant A | 3,332,806 | 933,278 |
| Events in quadrant B | 3,484,603 | 939,905 |
| Events in quadrant C | 3,370,832 | 894,110 |
| Events in quadrant D | 4,092,976 | 884,658 |
| Mode SS | |||
|---|---|---|---|
| Quadrant | BADHDUFLAG | Total packets | Discarded packets |
| A | 0 | 144 | 0 |
| B | 0 | 144 | 0 |
| C | 0 | 144 | 0 |
| D | 0 | 144 | 0 |
| Mode M9 | |||
|---|---|---|---|
| Quadrant | BADHDUFLAG | Total packets | Discarded packets |
| A | 0 | 2 | 0 |
| B | 0 | 2 | 0 |
| C | 0 | 2 | 0 |
| D | 0 | 2 | 0 |
| Mode M0 | |||
|---|---|---|---|
| Quadrant | BADHDUFLAG | Total packets | Discarded packets |
| A | 0 | 14596 | 2 |
| B | 0 | 14975 | 2 |
| C | 0 | 14828 | 2 |
| D | 0 | 16898 | 2 |
| Quadrant | Total seconds | Saturated seconds | Saturation percentage |
|---|---|---|---|
| A | 7128 | 48 | 0.673401% |
| B | 7129 | 61 | 0.855660% |
| C | 7129 | 98 | 1.374667% |
| D | 7129 | 80 | 1.122177% |
Noise dominated data is calculated using 1-second bins in cleaned event files. If a bin has >2000 counts, and if more than 50% of those come from <1% of pixels, then it is considered to be noise-dominated and hence unusable.
| Quadrant | # 1 sec bins | Bins with >0 counts | Bins with >2000 counts | High rate bins dominated by noise | Noise dominated (total time) | Noise dominated (detector-on time) | Marked lightcurve |
|---|---|---|---|---|---|---|---|
| A | 7348 | 7131 | 0 | 0 | 0.00% | 0.00% | 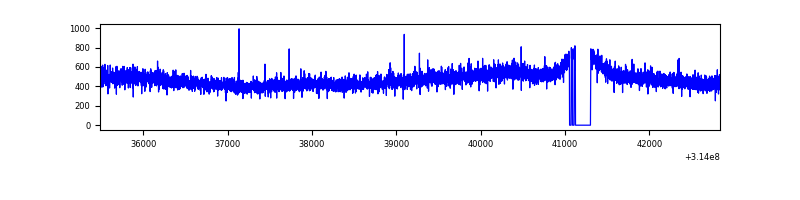 |
| B | 7349 | 7132 | 1 | 1 | 0.01% | 0.01% | 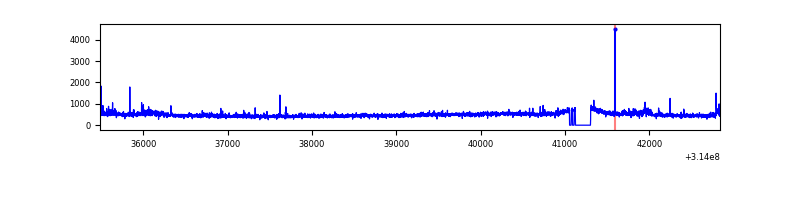 |
| C | 7349 | 7132 | 14 | 14 | 0.19% | 0.20% | 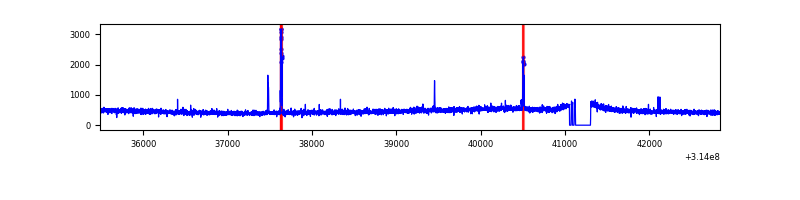 |
| D | 7349 | 7132 | 59 | 59 | 0.80% | 0.83% | 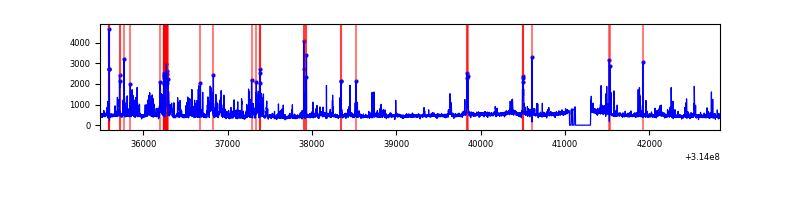 |
Top three noisy pixels from each quadrant. If the there are fewer than three noisy pixels in the level2.evt file, extra rows are filled as -1
| Pixel properties | Quadrant properties | ||||||
|---|---|---|---|---|---|---|---|
| Quadrant | DetID | PixID | Counts | Sigma | Mean | Median | Sigma |
| A | 10 | 17 | 24696 | 139.96 | 854 | 838 | 170.5 |
| A | 13 | 254 | 13393 | 73.65 | 854 | 838 | 170.5 |
| A | 0 | 226 | 7526 | 39.23 | 854 | 838 | 170.5 |
| B | 0 | 230 | 89507 | 550.98 | 851 | 830 | 160.9 |
| B | 0 | 228 | 19067 | 113.31 | 851 | 830 | 160.9 |
| B | 12 | 111 | 18169 | 107.73 | 851 | 830 | 160.9 |
| C | 14 | 238 | 128617 | 674.62 | 809 | 814 | 189.4 |
| C | 10 | 22 | 81951 | 428.29 | 809 | 814 | 189.4 |
| C | 13 | 61 | 5821 | 26.43 | 809 | 814 | 189.4 |
| D | 1 | 52 | 610041 | 3049.92 | 822 | 798 | 199.8 |
| D | 12 | 233 | 137461 | 684.15 | 822 | 798 | 199.8 |
| D | 2 | 152 | 86332 | 428.19 | 822 | 798 | 199.8 |
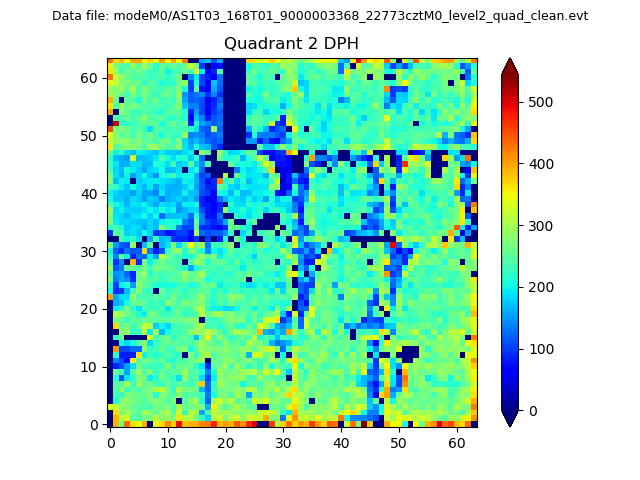
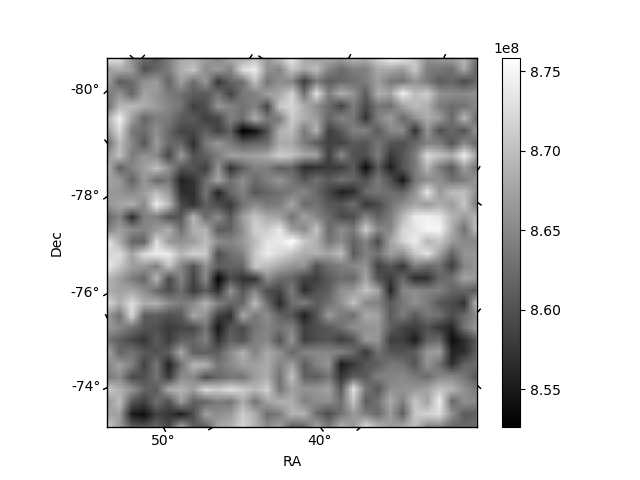
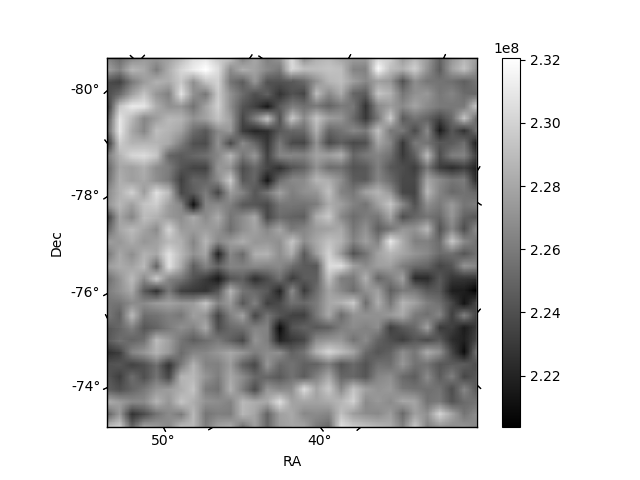
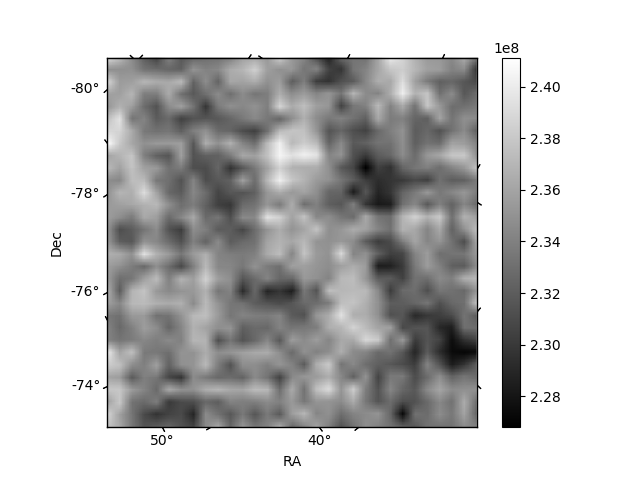
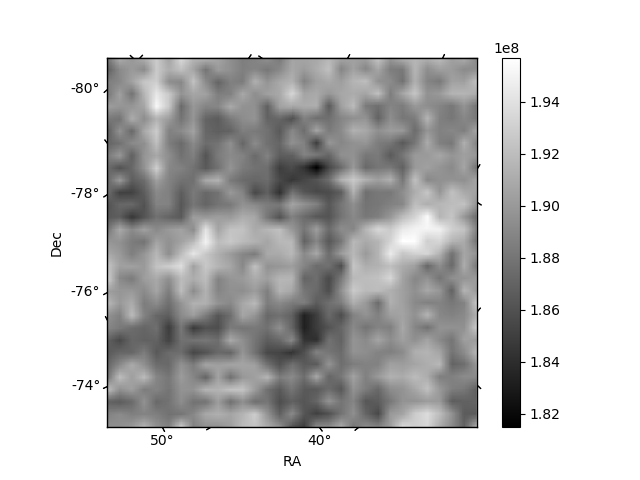
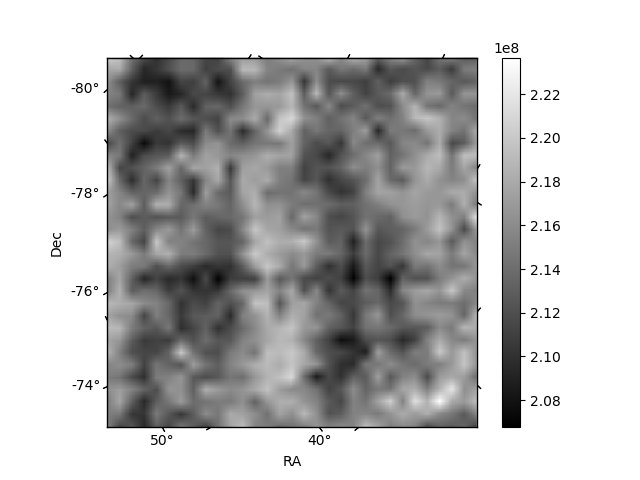
Histogram calculated using DETX and DETY for each event in the final _common_clean file
| Quadrant A | 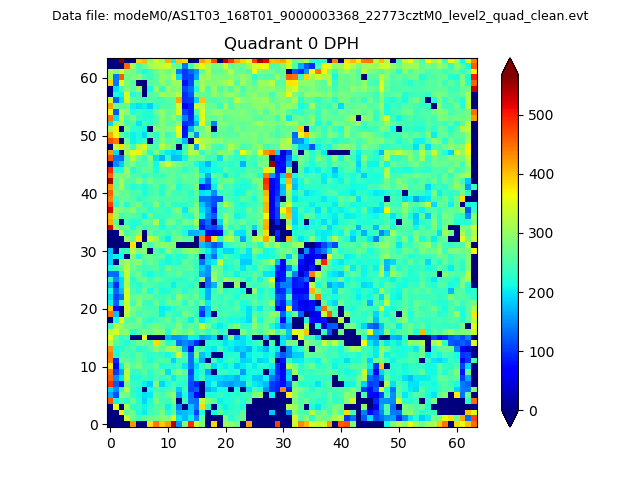 |
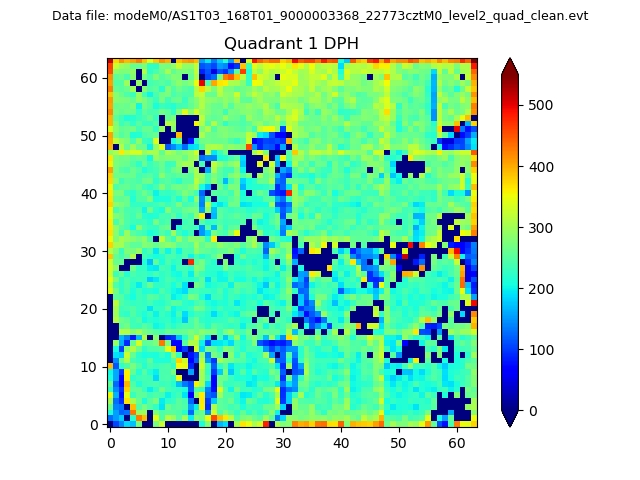 |
Quadrant B |
|---|---|---|---|
| Quadrant D | 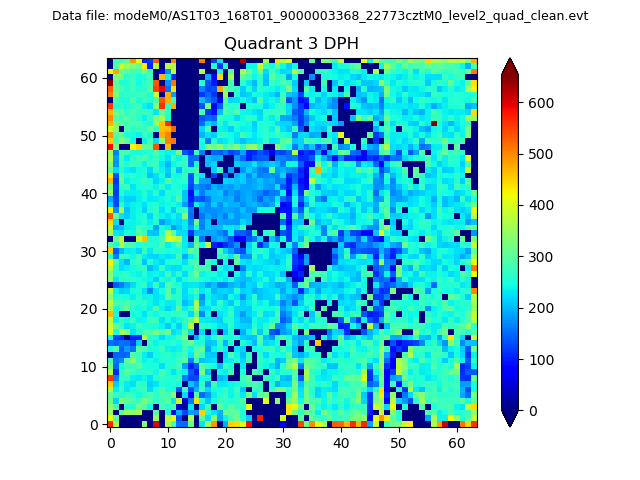 |
 |
Quadrant C |
| Plot type | Count rate plots | Images |
|---|---|---|
| Comparison with Poisson distribution Blue bars denote a histogram of data divided into 1 sec bins. Red curve is a Poisson curve with rate = median count rate of data. |
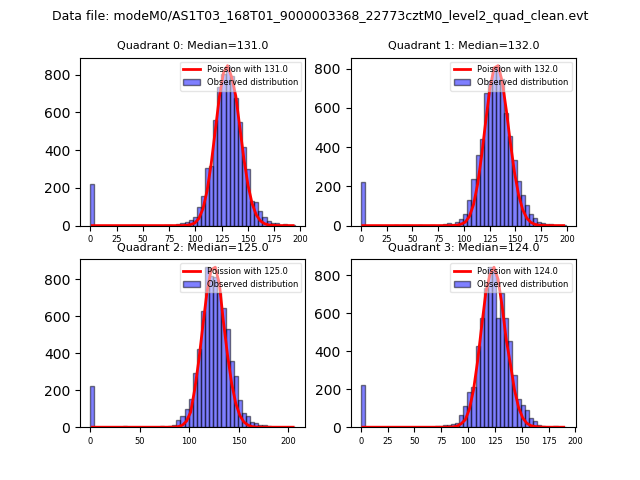 |
 |
| Quadrant-wise count rates Data is divided into 100 sec bins |
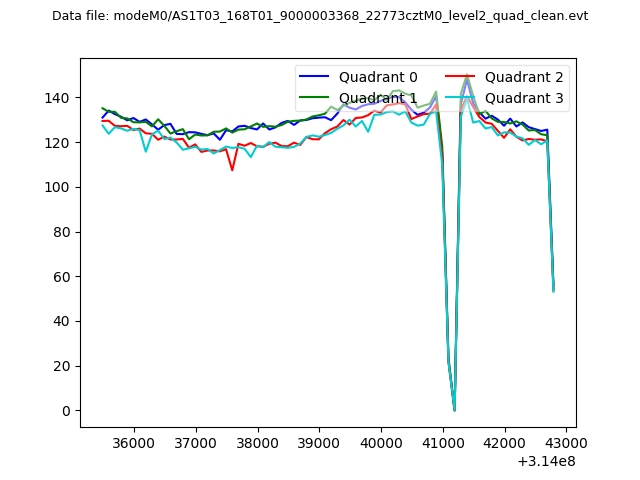 |
|
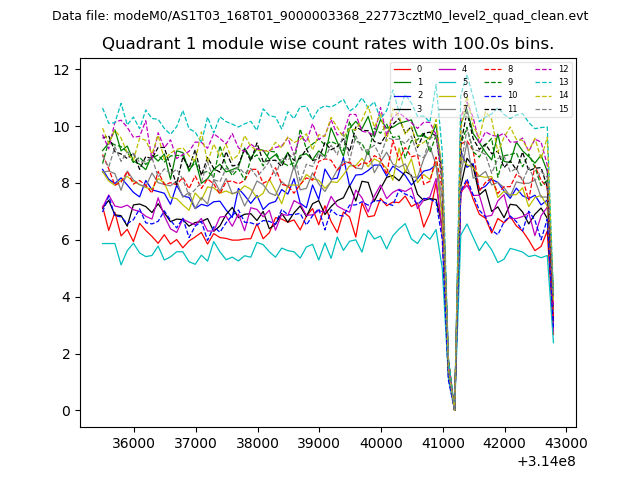
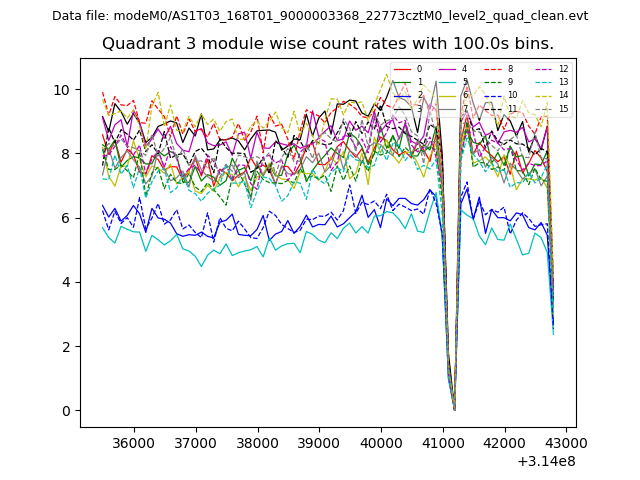
| Module-wise count rates for Quadrant A Data is divided into 100 sec bins |
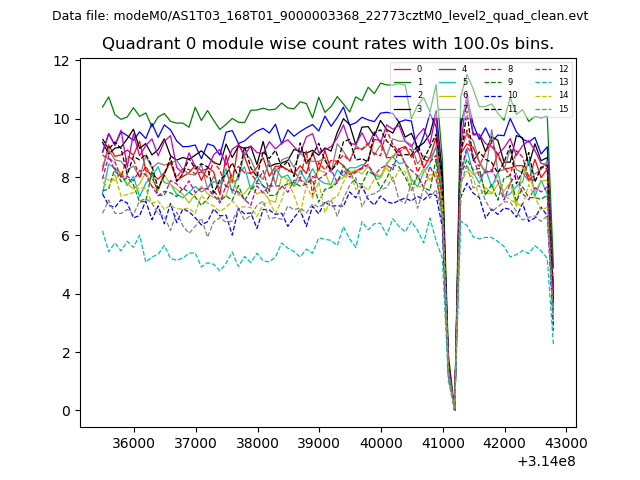 |
 |
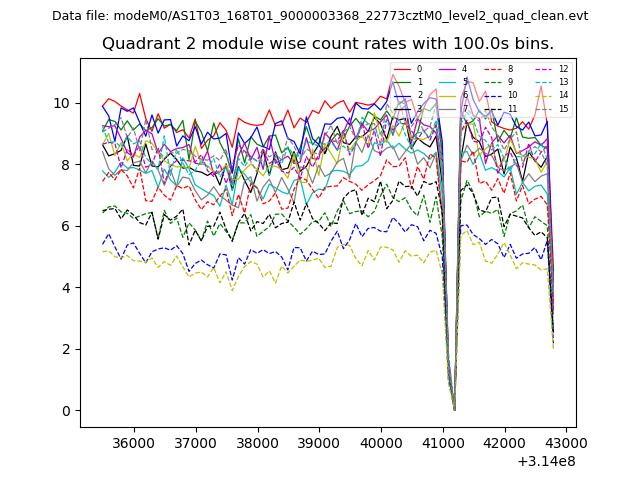
| Module-wise count rates for Quadrant B Data is divided into 100 sec bins |
 |
 |
| Module-wise count rates for Quadrant C Data is divided into 100 sec bins |
 |
 |
| Module-wise count rates for Quadrant D Data is divided into 100 sec bins |
 |
 |
| Parameter | Plot |
|---|---|
| CZT HV Monitor | 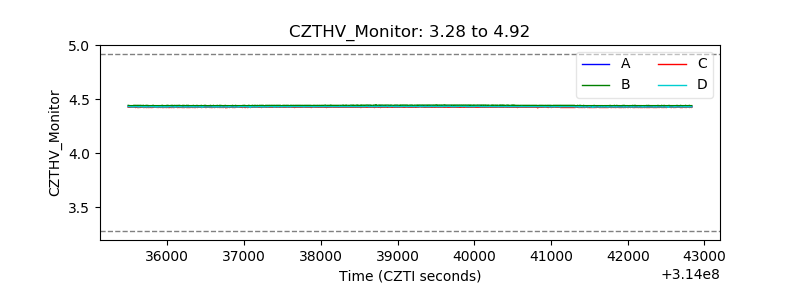 |
| D_VDD | 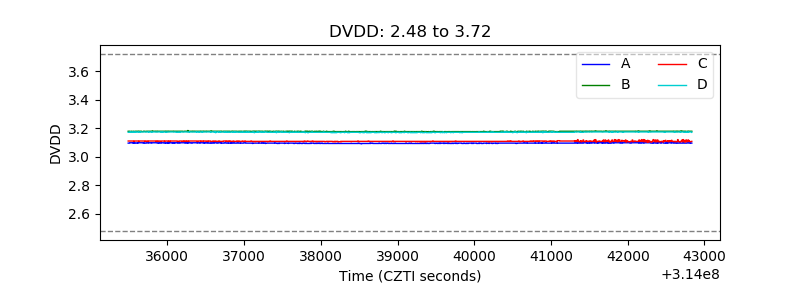 |
| Temperature 1 | 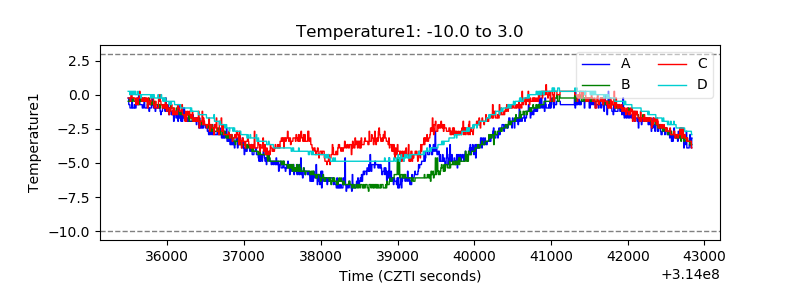 |
| Veto HV Monitor | 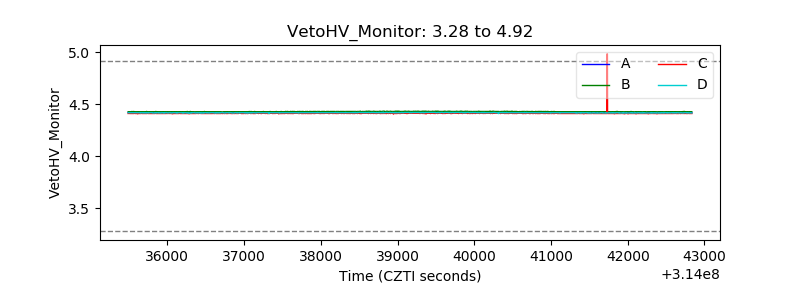 |
| Veto LLD | 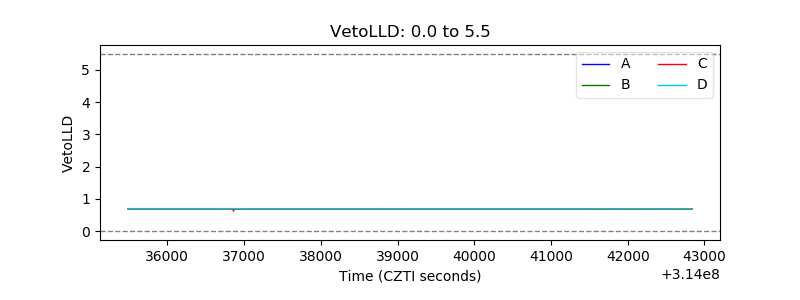 |
| Alpha Counter | 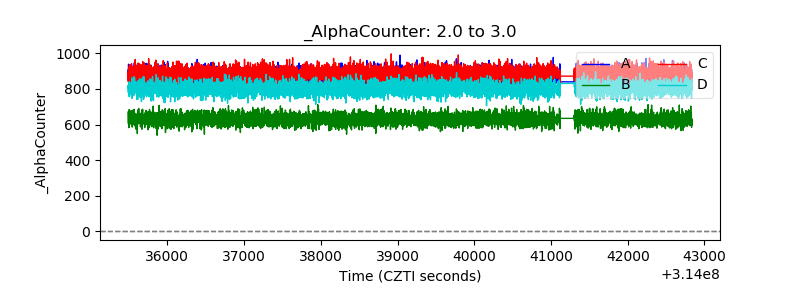 |
| _CPM_Rate | 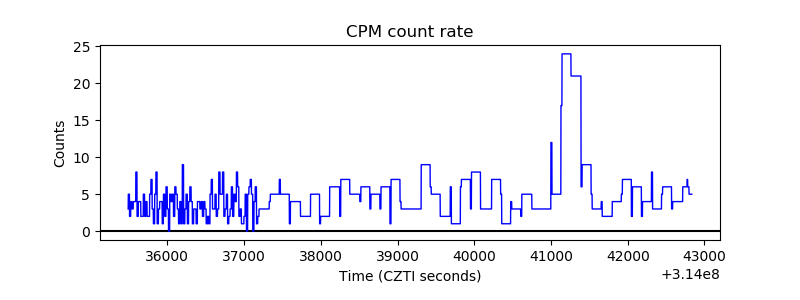 |
| CZT Counter | 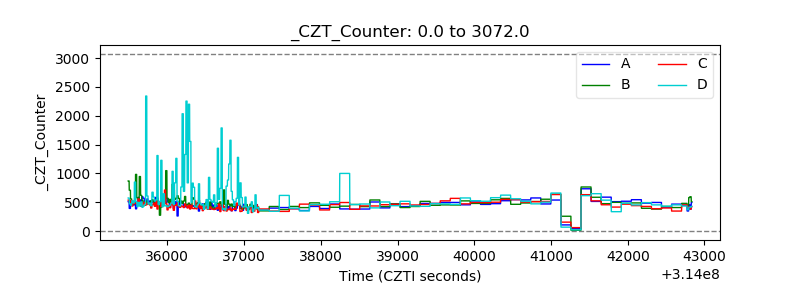 |
| +2.5 Volts monitor |  |
| +5 Volts monitor |  |
| _ROLL_ROT | 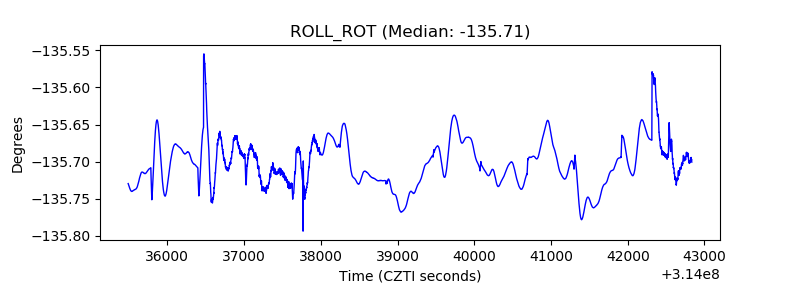 |
| _Roll_DEC | 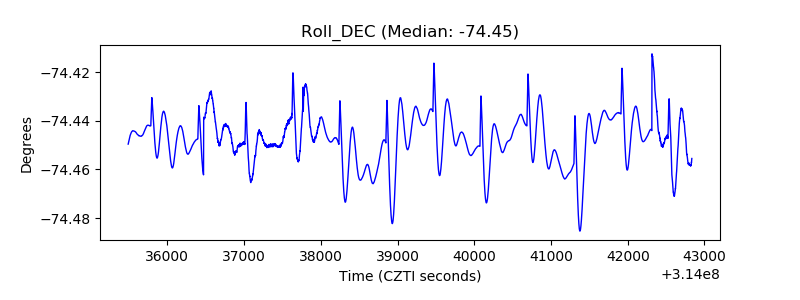 |
| _Roll_RA | 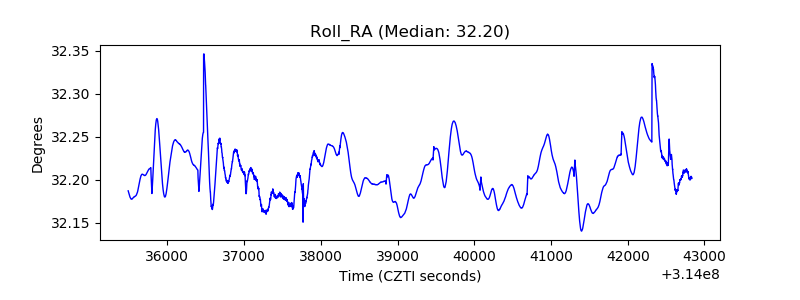 |
| Veto Counter | 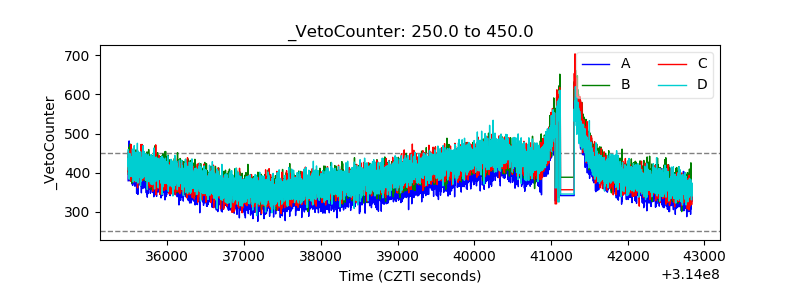 |