| Param | Original file | Final file |
|---|---|---|
| Filename | modeM0/AS1T03_168T01_9000003368_22774cztM0_level2.evt | modeM0/AS1T03_168T01_9000003368_22774cztM0_level2_quad_clean.evt |
| Size (bytes) | 516,962,880 | 146,802,240 |
| Size | 493.0 MB | 140.0 MB |
| Events in quadrant A | 3,614,889 | 1,001,397 |
| Events in quadrant B | 3,720,970 | 1,006,176 |
| Events in quadrant C | 3,668,456 | 958,511 |
| Events in quadrant D | 4,127,210 | 943,135 |
| Mode SS | |||
|---|---|---|---|
| Quadrant | BADHDUFLAG | Total packets | Discarded packets |
| A | 0 | 156 | 0 |
| B | 0 | 156 | 0 |
| C | 0 | 156 | 0 |
| D | 0 | 156 | 0 |
| Mode M9 | |||
|---|---|---|---|
| Quadrant | BADHDUFLAG | Total packets | Discarded packets |
| A | 0 | 3 | 0 |
| B | 0 | 3 | 0 |
| C | 0 | 3 | 0 |
| D | 0 | 3 | 0 |
| Mode M0 | |||
|---|---|---|---|
| Quadrant | BADHDUFLAG | Total packets | Discarded packets |
| A | 0 | 15933 | 2 |
| B | 0 | 16197 | 2 |
| C | 0 | 16153 | 2 |
| D | 0 | 17540 | 2 |
| Quadrant | Total seconds | Saturated seconds | Saturation percentage |
|---|---|---|---|
| A | 7725 | 74 | 0.957929% |
| B | 7726 | 109 | 1.410821% |
| C | 7726 | 137 | 1.773233% |
| D | 7726 | 112 | 1.449651% |
Noise dominated data is calculated using 1-second bins in cleaned event files. If a bin has >2000 counts, and if more than 50% of those come from <1% of pixels, then it is considered to be noise-dominated and hence unusable.
| Quadrant | # 1 sec bins | Bins with >0 counts | Bins with >2000 counts | High rate bins dominated by noise | Noise dominated (total time) | Noise dominated (detector-on time) | Marked lightcurve |
|---|---|---|---|---|---|---|---|
| A | 7980 | 7727 | 0 | 0 | 0.00% | 0.00% | 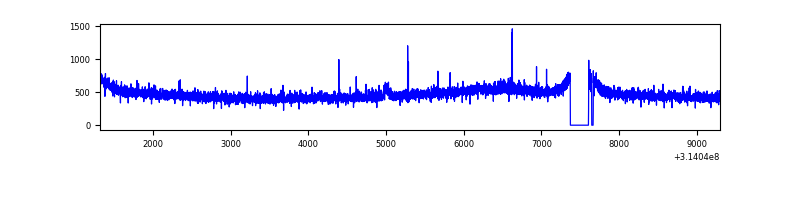 |
| B | 7981 | 7728 | 1 | 1 | 0.01% | 0.01% |  |
| C | 7981 | 7728 | 14 | 14 | 0.18% | 0.18% | 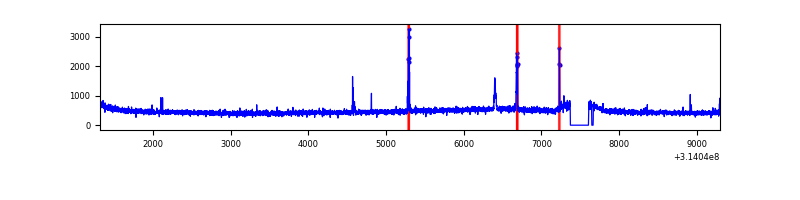 |
| D | 7981 | 7728 | 38 | 38 | 0.48% | 0.49% | 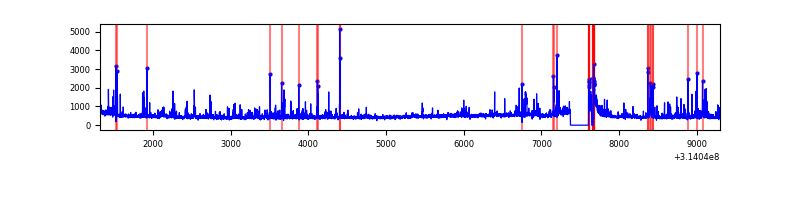 |
Top three noisy pixels from each quadrant. If the there are fewer than three noisy pixels in the level2.evt file, extra rows are filled as -1
| Pixel properties | Quadrant properties | ||||||
|---|---|---|---|---|---|---|---|
| Quadrant | DetID | PixID | Counts | Sigma | Mean | Median | Sigma |
| A | 10 | 17 | 26443 | 135.68 | 925 | 905 | 188.2 |
| A | 13 | 254 | 14420 | 71.8 | 925 | 905 | 188.2 |
| A | 14 | 235 | 10441 | 50.66 | 925 | 905 | 188.2 |
| B | 0 | 230 | 52297 | 294.69 | 921 | 901 | 174.4 |
| B | 12 | 111 | 19589 | 107.15 | 921 | 901 | 174.4 |
| B | 0 | 228 | 18131 | 98.79 | 921 | 901 | 174.4 |
| C | 14 | 238 | 137150 | 672.44 | 874 | 880 | 202.7 |
| C | 10 | 22 | 92031 | 449.79 | 874 | 880 | 202.7 |
| C | 2 | 16 | 14603 | 67.72 | 874 | 880 | 202.7 |
| D | 1 | 52 | 215768 | 995.46 | 886 | 859 | 215.9 |
| D | 2 | 152 | 214406 | 989.15 | 886 | 859 | 215.9 |
| D | 12 | 233 | 86042 | 394.57 | 886 | 859 | 215.9 |
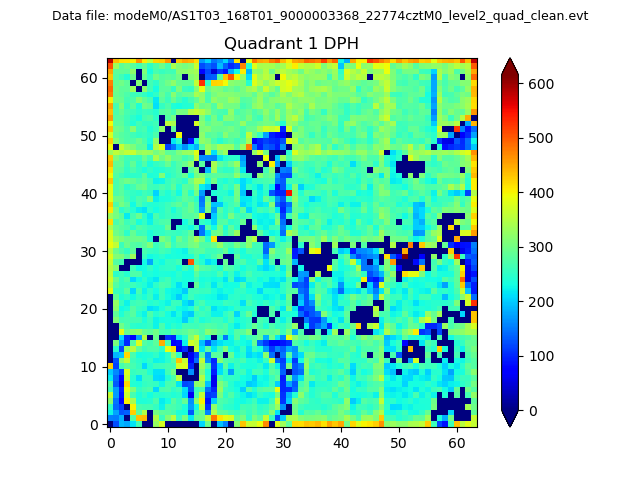
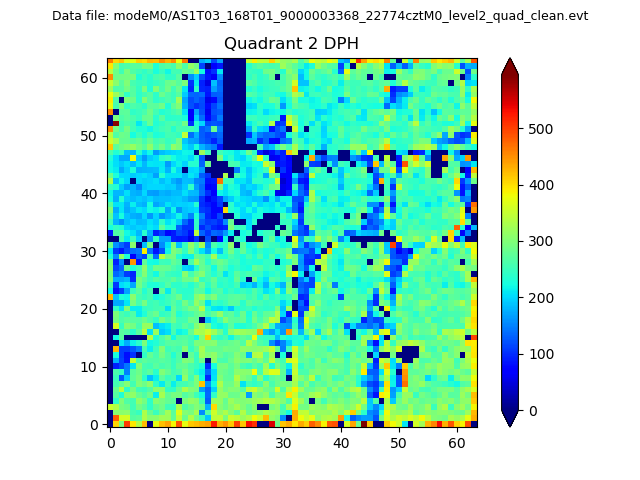
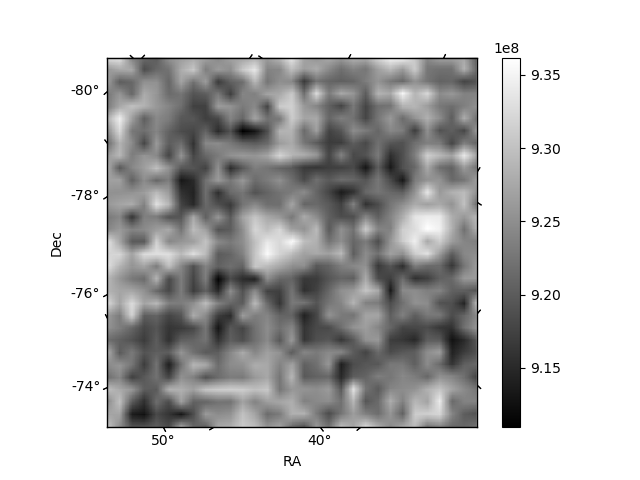
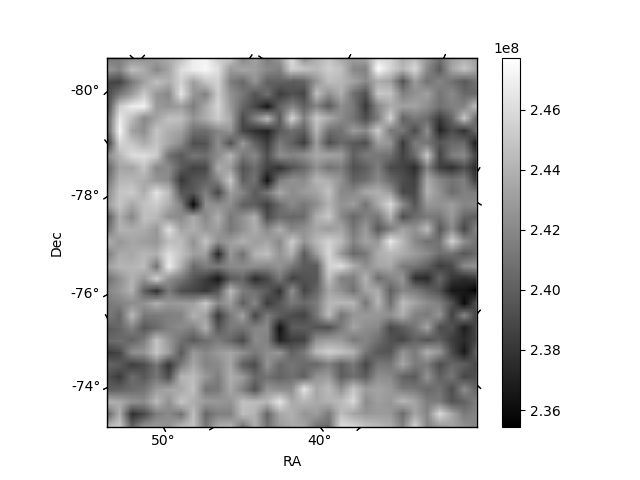
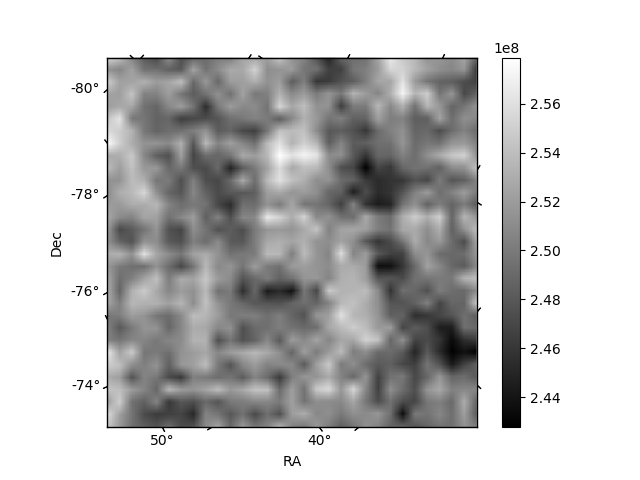
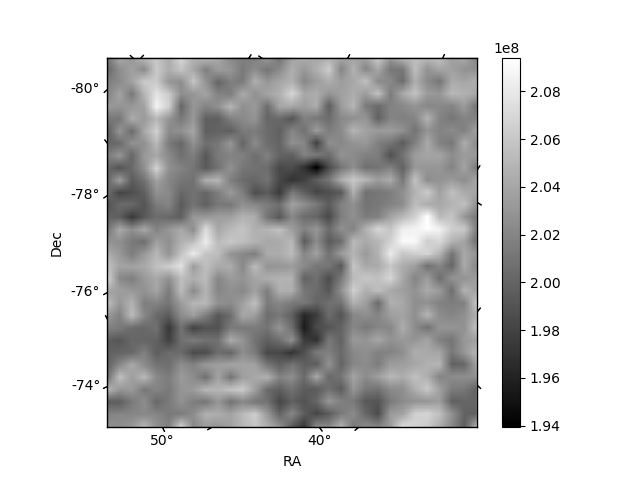
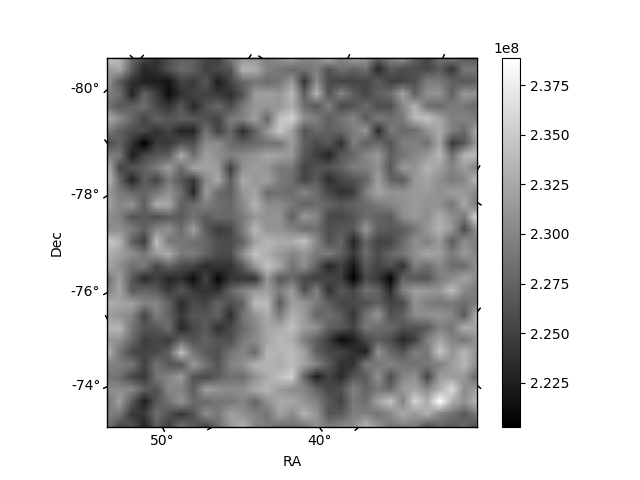
Histogram calculated using DETX and DETY for each event in the final _common_clean file
| Quadrant A | 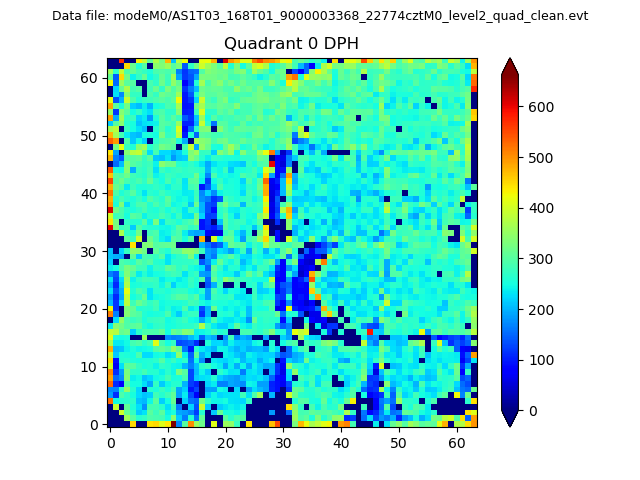 |
 |
Quadrant B |
|---|---|---|---|
| Quadrant D | 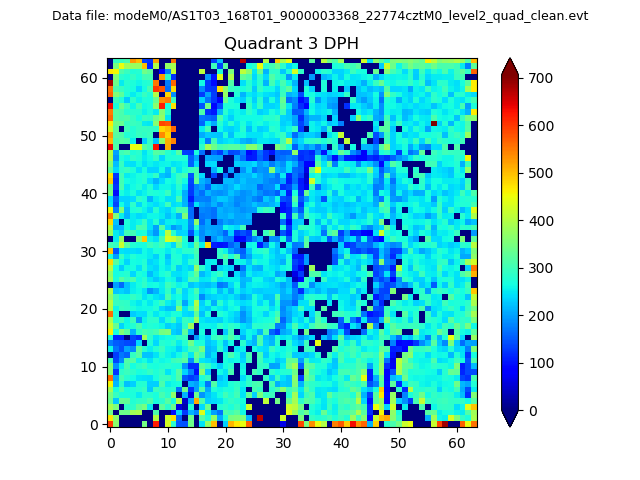 |
 |
Quadrant C |
| Plot type | Count rate plots | Images |
|---|---|---|
| Comparison with Poisson distribution Blue bars denote a histogram of data divided into 1 sec bins. Red curve is a Poisson curve with rate = median count rate of data. |
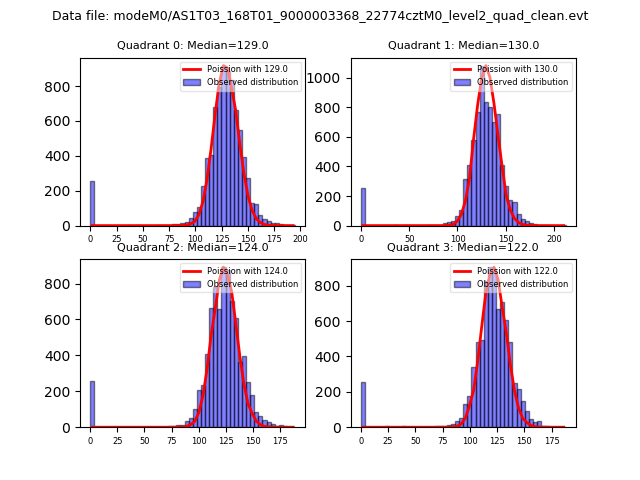 |
 |
| Quadrant-wise count rates Data is divided into 100 sec bins |
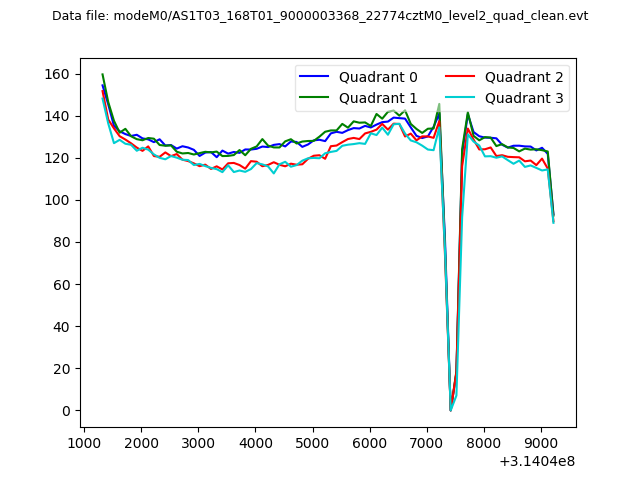 |
|
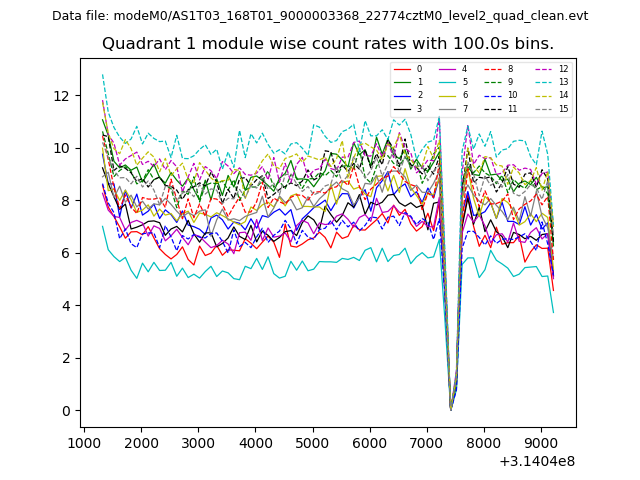
| Module-wise count rates for Quadrant A Data is divided into 100 sec bins |
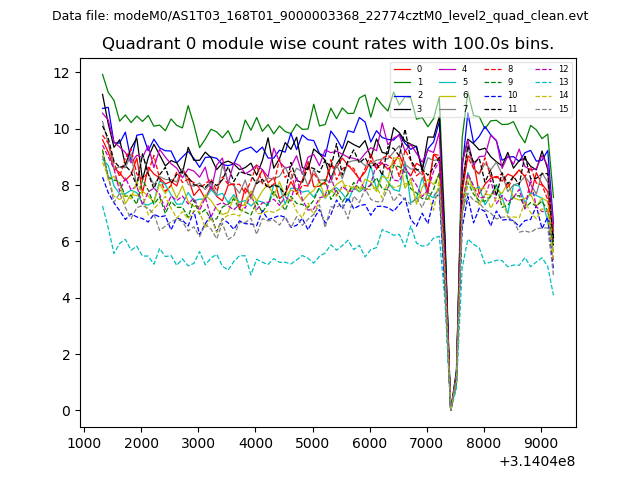 |
 |
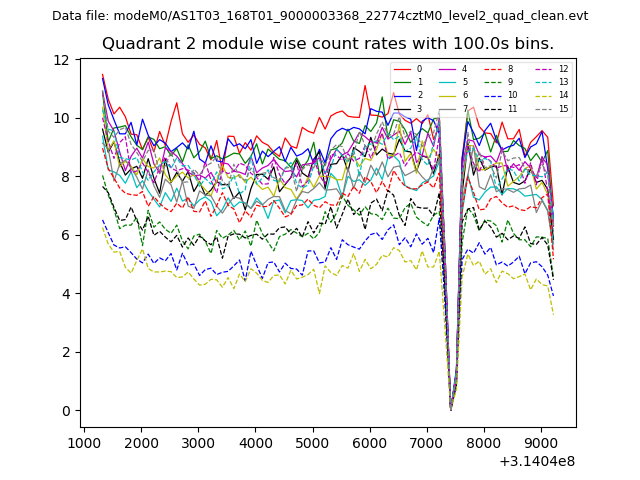
| Module-wise count rates for Quadrant B Data is divided into 100 sec bins |
 |
 |
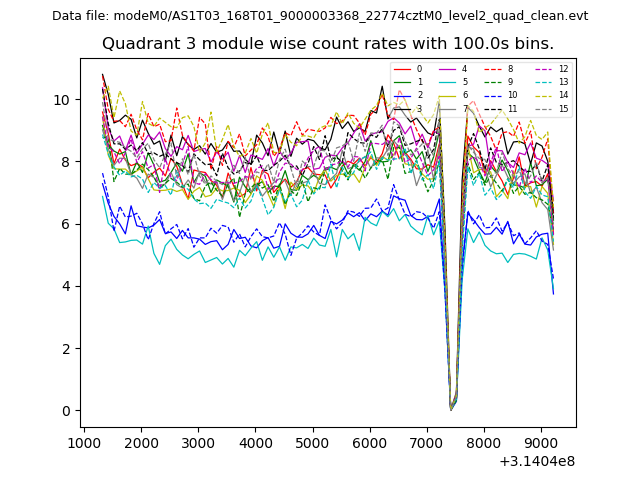
| Module-wise count rates for Quadrant C Data is divided into 100 sec bins |
 |
 |
| Module-wise count rates for Quadrant D Data is divided into 100 sec bins |
 |
 |
| Parameter | Plot |
|---|---|
| CZT HV Monitor | 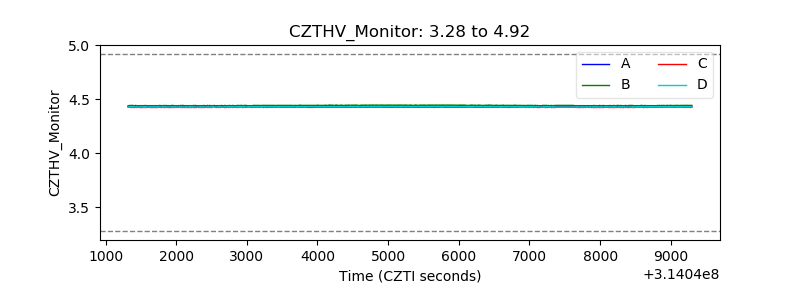 |
| D_VDD |  |
| Temperature 1 |  |
| Veto HV Monitor | 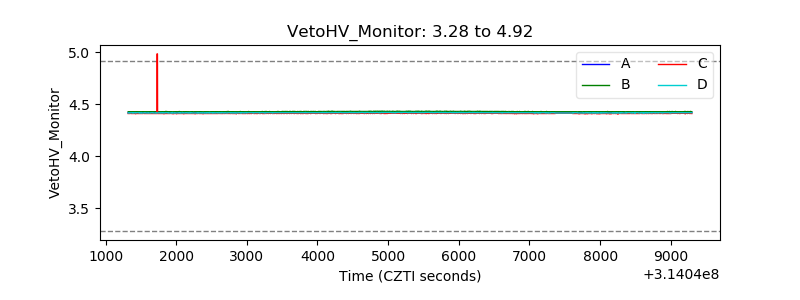 |
| Veto LLD | 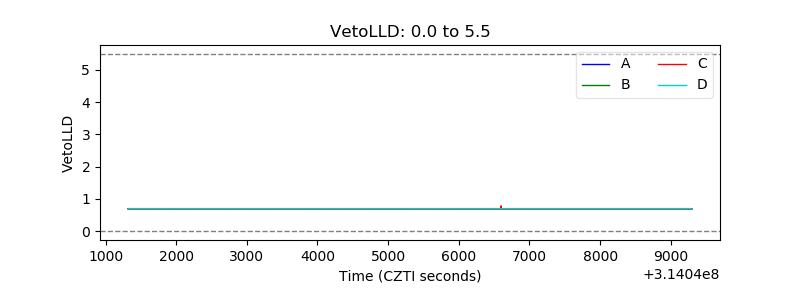 |
| Alpha Counter | 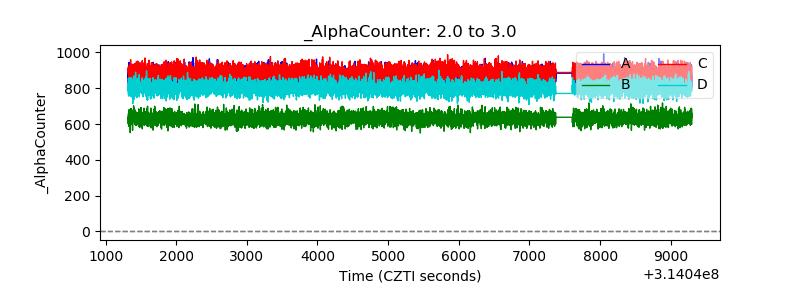 |
| _CPM_Rate | 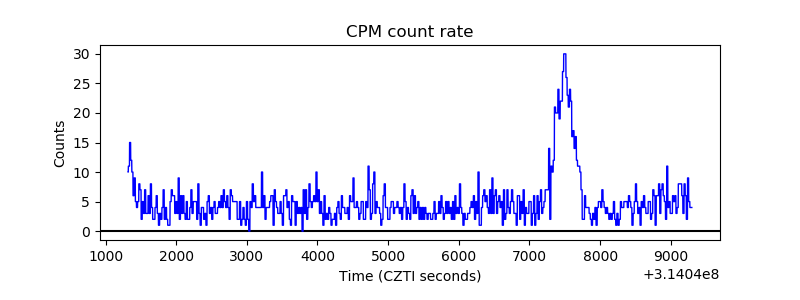 |
| CZT Counter | 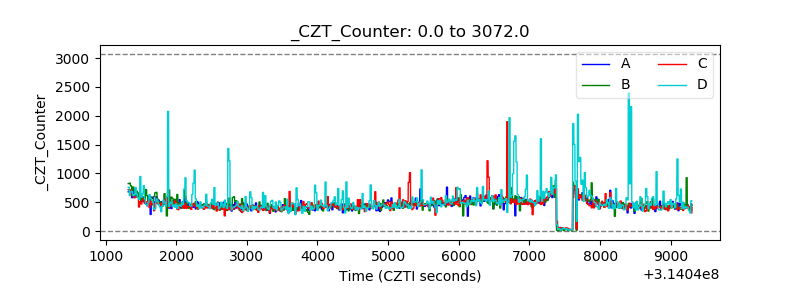 |
| +2.5 Volts monitor |  |
| +5 Volts monitor |  |
| _ROLL_ROT | 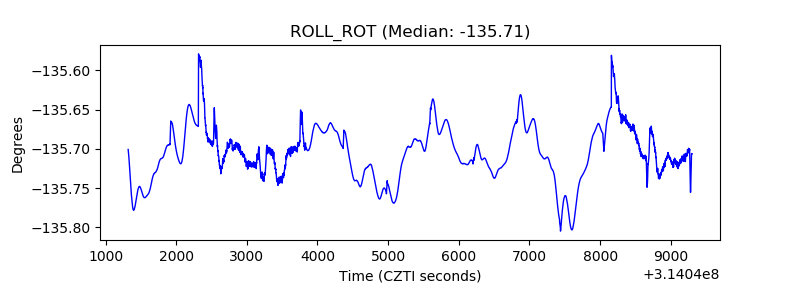 |
| _Roll_DEC |  |
| _Roll_RA | 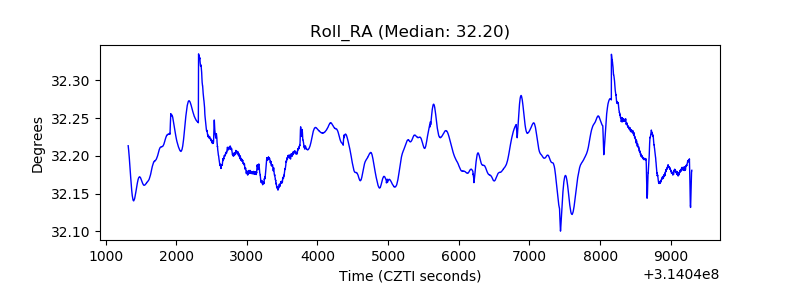 |
| Veto Counter | 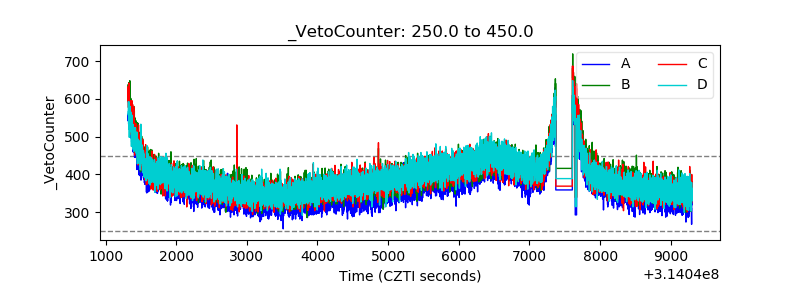 |