| Param | Original file | Final file |
|---|---|---|
| Filename | modeM0/AS1T03_168T01_9000003368_22777cztM0_level2.evt | modeM0/AS1T03_168T01_9000003368_22777cztM0_level2_quad_clean.evt |
| Size (bytes) | 1,327,815,360 | 349,254,720 |
| Size | 1.2 GB | 333.1 MB |
| Events in quadrant A | 8,630,956 | 2,404,223 |
| Events in quadrant B | 8,881,467 | 2,425,280 |
| Events in quadrant C | 8,744,951 | 2,297,657 |
| Events in quadrant D | 12,689,832 | 2,161,976 |
| Mode SS | |||
|---|---|---|---|
| Quadrant | BADHDUFLAG | Total packets | Discarded packets |
| A | 0 | 380 | 0 |
| B | 0 | 380 | 0 |
| C | 0 | 380 | 0 |
| D | 0 | 380 | 0 |
| Mode M9 | |||
|---|---|---|---|
| Quadrant | BADHDUFLAG | Total packets | Discarded packets |
| A | 0 | 24 | 0 |
| B | 0 | 24 | 0 |
| C | 0 | 24 | 0 |
| D | 0 | 24 | 0 |
| Mode M0 | |||
|---|---|---|---|
| Quadrant | BADHDUFLAG | Total packets | Discarded packets |
| A | 0 | 38077 | 4 |
| B | 0 | 38589 | 4 |
| C | 0 | 38285 | 4 |
| D | 0 | 50541 | 4 |
| Quadrant | Total seconds | Saturated seconds | Saturation percentage |
|---|---|---|---|
| A | 18730 | 122 | 0.651361% |
| B | 18731 | 176 | 0.939619% |
| C | 18731 | 224 | 1.195878% |
| D | 18731 | 1173 | 6.262346% |
Noise dominated data is calculated using 1-second bins in cleaned event files. If a bin has >2000 counts, and if more than 50% of those come from <1% of pixels, then it is considered to be noise-dominated and hence unusable.
| Quadrant | # 1 sec bins | Bins with >0 counts | Bins with >2000 counts | High rate bins dominated by noise | Noise dominated (total time) | Noise dominated (detector-on time) | Marked lightcurve |
|---|---|---|---|---|---|---|---|
| A | 20965 | 18735 | 0 | 0 | 0.00% | 0.00% | 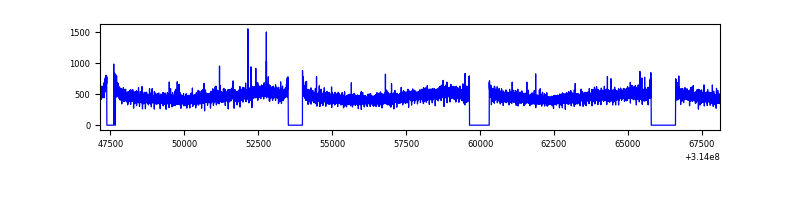 |
| B | 20966 | 18736 | 1 | 1 | 0.00% | 0.01% |  |
| C | 20966 | 18736 | 9 | 9 | 0.04% | 0.05% | 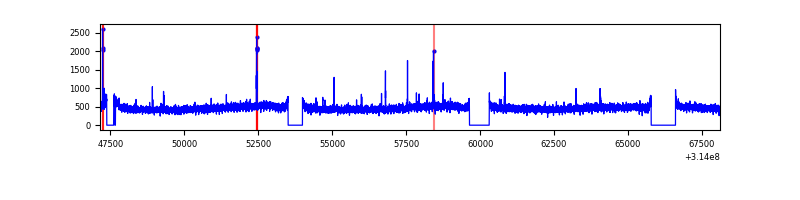 |
| D | 20966 | 18735 | 917 | 917 | 4.37% | 4.89% | 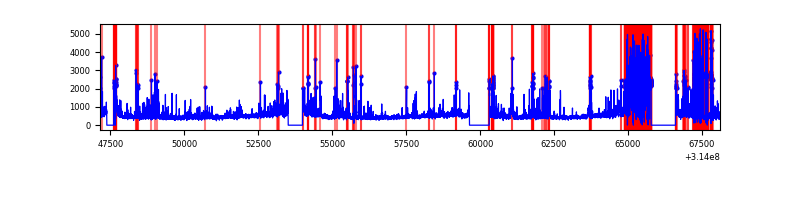 |
Top three noisy pixels from each quadrant. If the there are fewer than three noisy pixels in the level2.evt file, extra rows are filled as -1
| Pixel properties | Quadrant properties | ||||||
|---|---|---|---|---|---|---|---|
| Quadrant | DetID | PixID | Counts | Sigma | Mean | Median | Sigma |
| A | 10 | 17 | 46433 | 99.37 | 2222 | 2177 | 445.4 |
| A | 13 | 254 | 34638 | 72.88 | 2222 | 2177 | 445.4 |
| A | 0 | 226 | 19468 | 38.82 | 2222 | 2177 | 445.4 |
| B | 0 | 230 | 63508 | 147.26 | 2221 | 2172 | 416.5 |
| B | 12 | 111 | 49371 | 113.32 | 2221 | 2172 | 416.5 |
| B | 0 | 228 | 43774 | 99.88 | 2221 | 2172 | 416.5 |
| C | 14 | 238 | 334853 | 673.01 | 2125 | 2138 | 494.4 |
| C | 10 | 22 | 85518 | 168.66 | 2125 | 2138 | 494.4 |
| C | 2 | 16 | 33270 | 62.97 | 2125 | 2138 | 494.4 |
| D | 1 | 52 | 3792880 | 7562.91 | 2068 | 2006 | 501.2 |
| D | 12 | 227 | 342192 | 678.68 | 2068 | 2006 | 501.2 |
| D | 12 | 233 | 155044 | 305.32 | 2068 | 2006 | 501.2 |
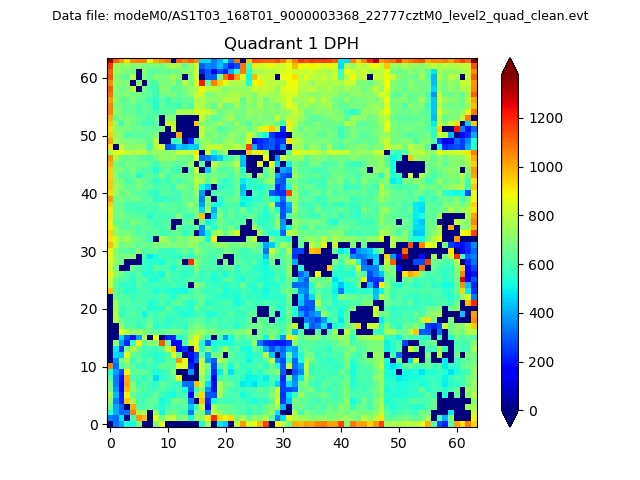
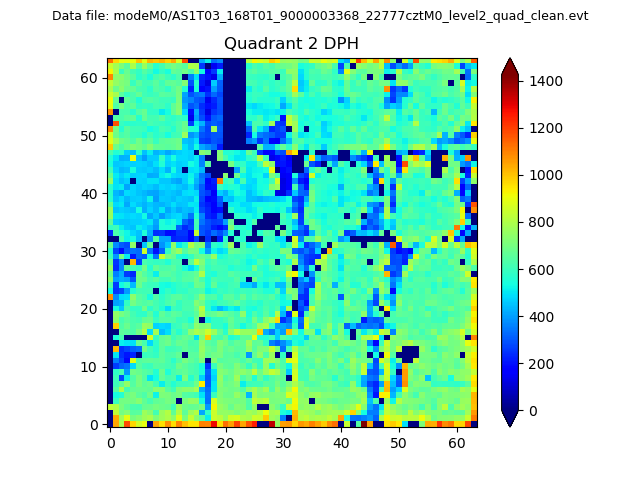
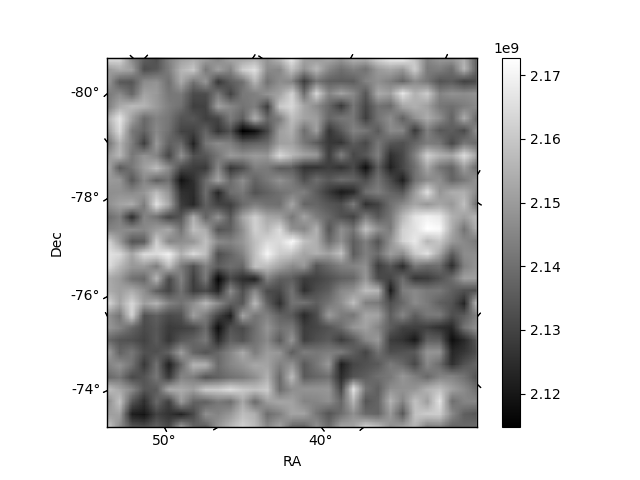
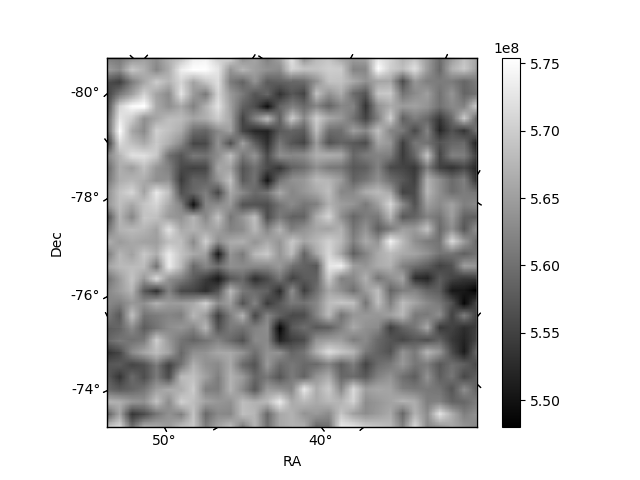
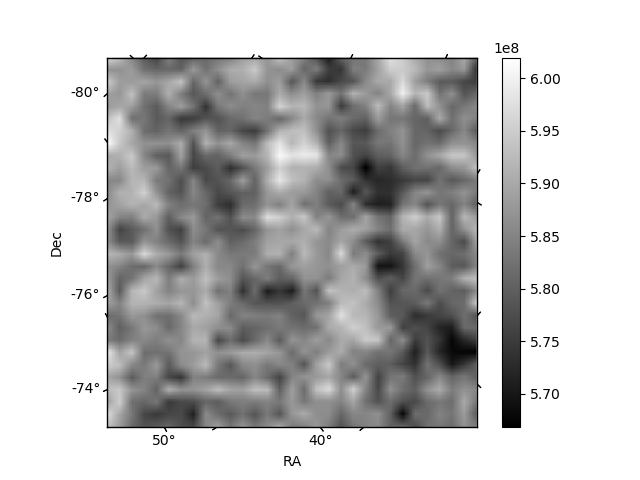
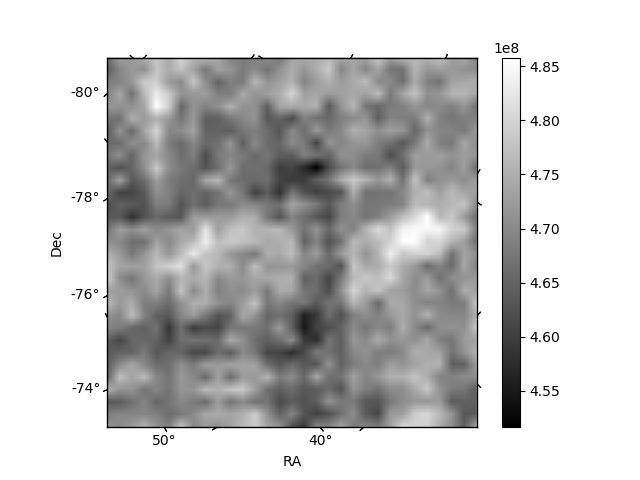
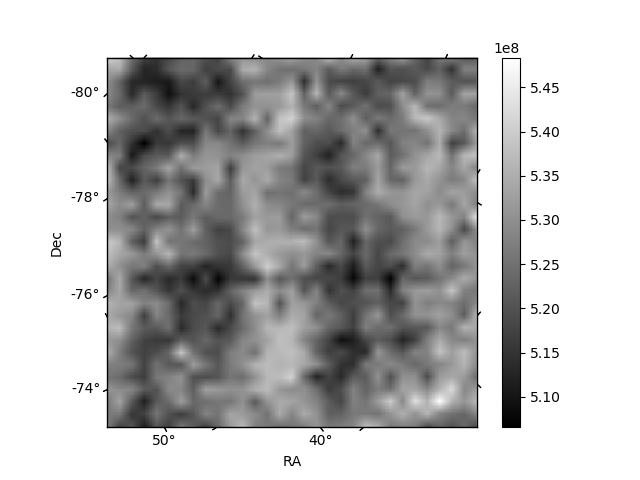
Histogram calculated using DETX and DETY for each event in the final _common_clean file
| Quadrant A | 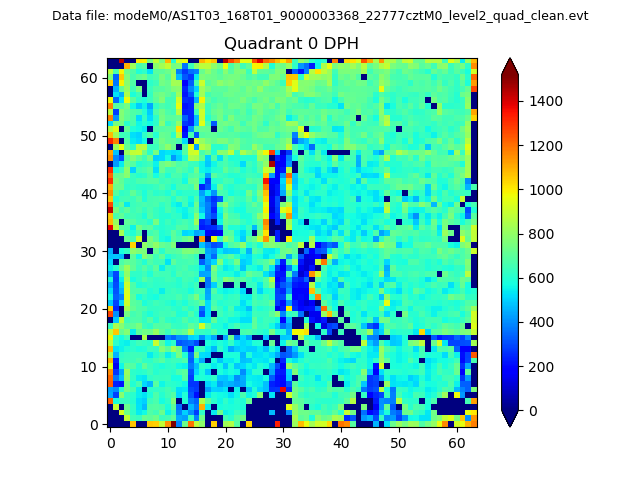 |
 |
Quadrant B |
|---|---|---|---|
| Quadrant D | 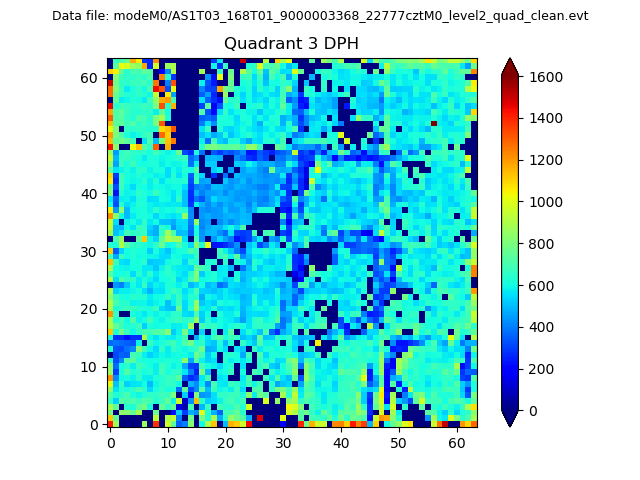 |
 |
Quadrant C |
| Plot type | Count rate plots | Images |
|---|---|---|
| Comparison with Poisson distribution Blue bars denote a histogram of data divided into 1 sec bins. Red curve is a Poisson curve with rate = median count rate of data. |
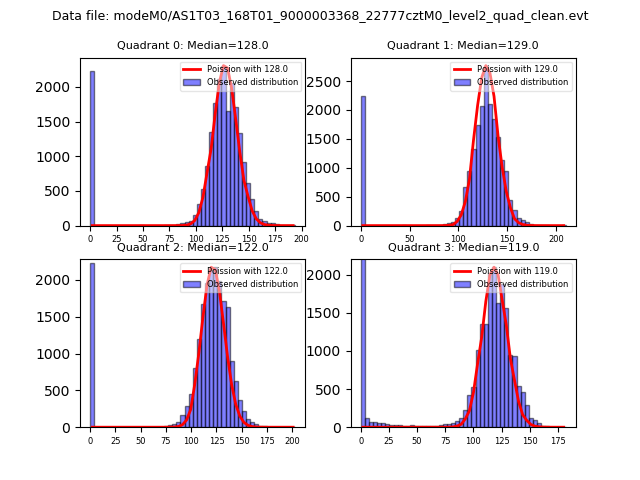 |
 |
| Quadrant-wise count rates Data is divided into 100 sec bins |
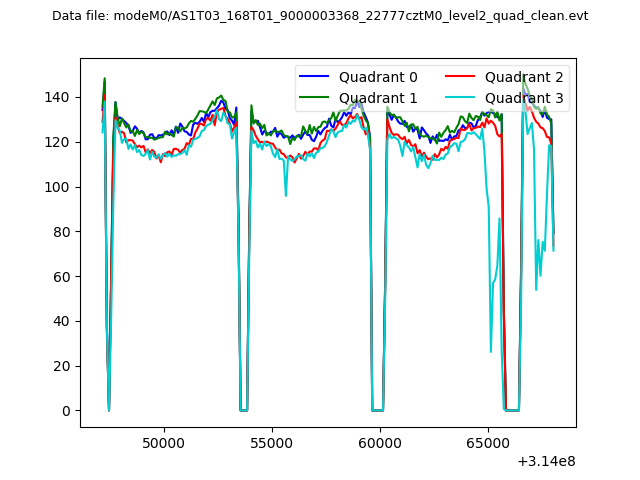 |
|
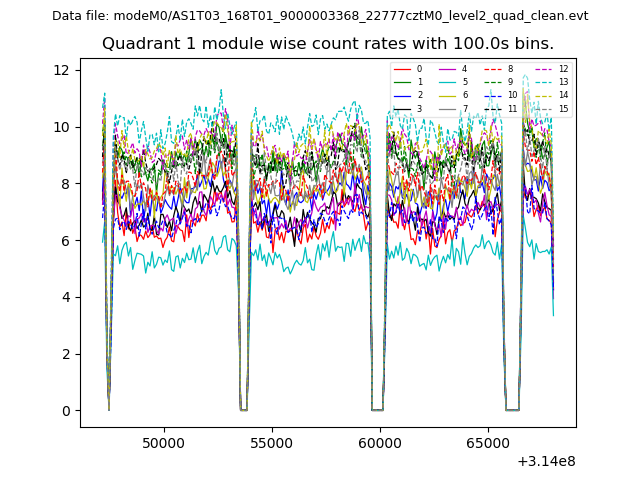
| Module-wise count rates for Quadrant A Data is divided into 100 sec bins |
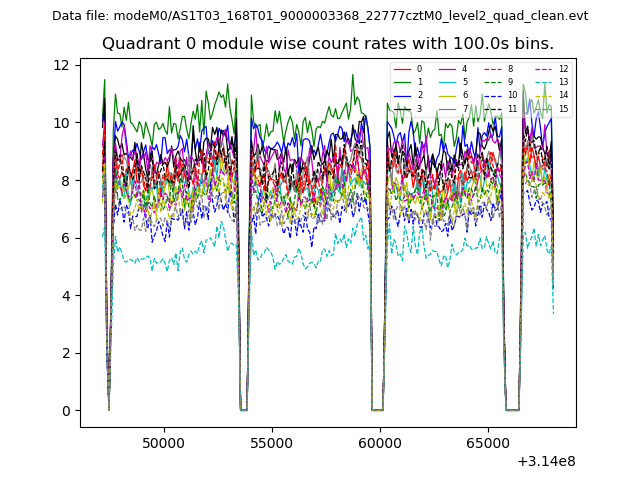 |
 |
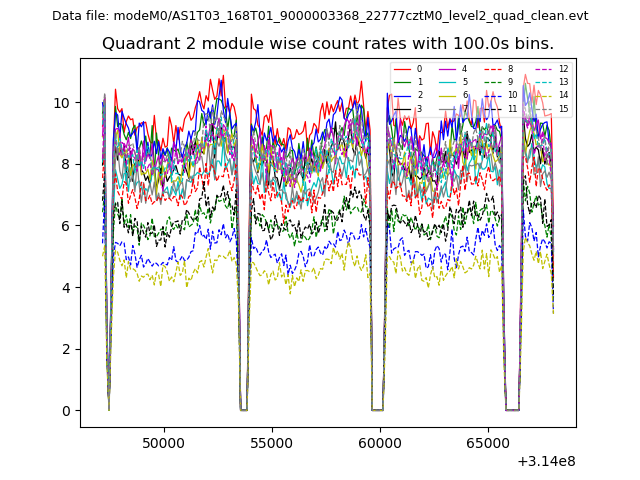
| Module-wise count rates for Quadrant B Data is divided into 100 sec bins |
 |
 |
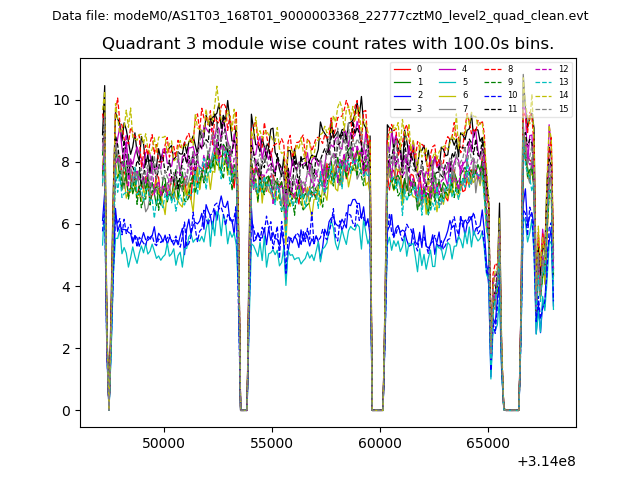
| Module-wise count rates for Quadrant C Data is divided into 100 sec bins |
 |
 |
| Module-wise count rates for Quadrant D Data is divided into 100 sec bins |
 |
 |
| Parameter | Plot |
|---|---|
| CZT HV Monitor | 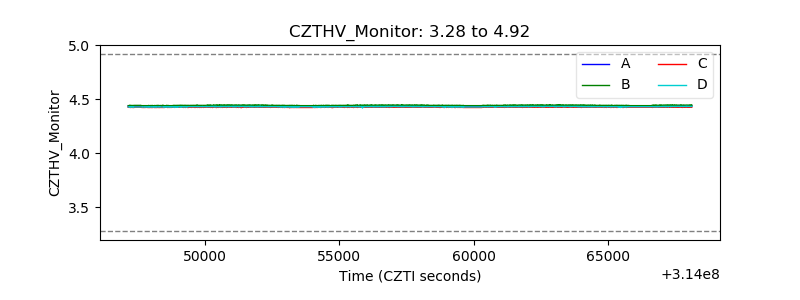 |
| D_VDD | 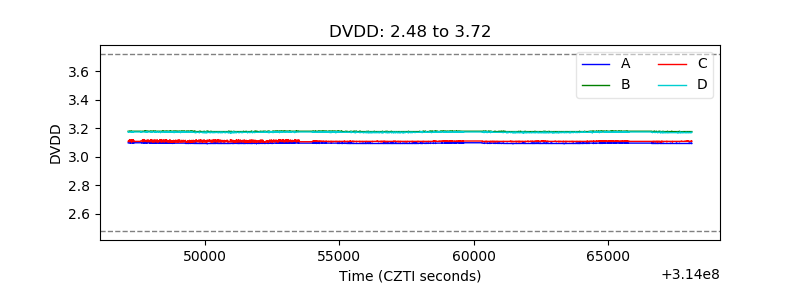 |
| Temperature 1 | 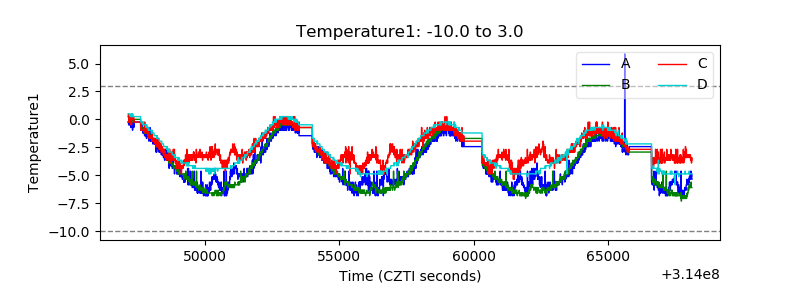 |
| Veto HV Monitor | 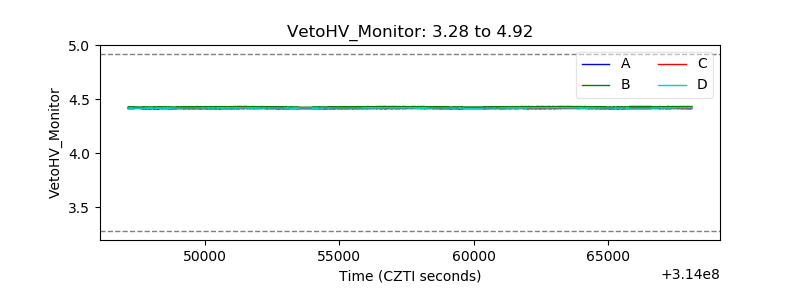 |
| Veto LLD | 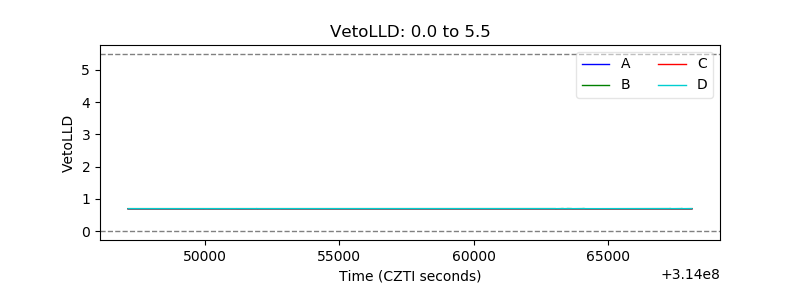 |
| Alpha Counter | 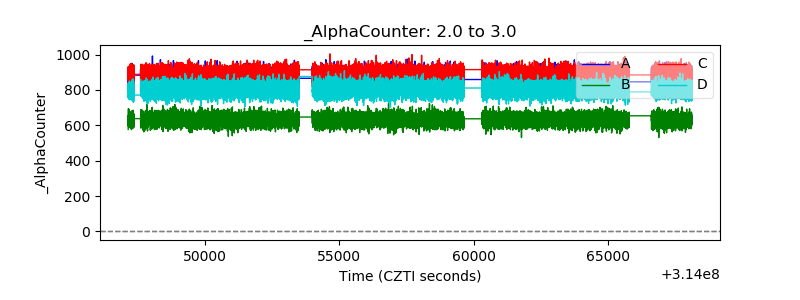 |
| _CPM_Rate | 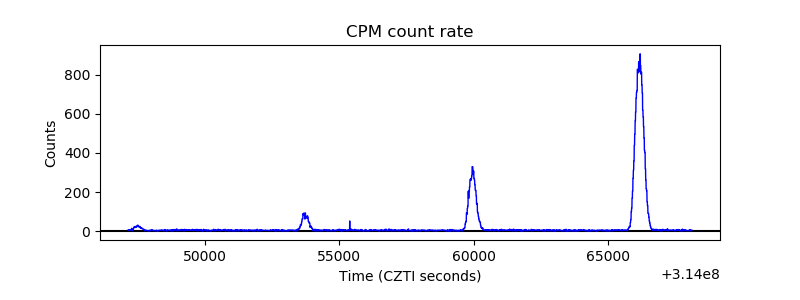 |
| CZT Counter | 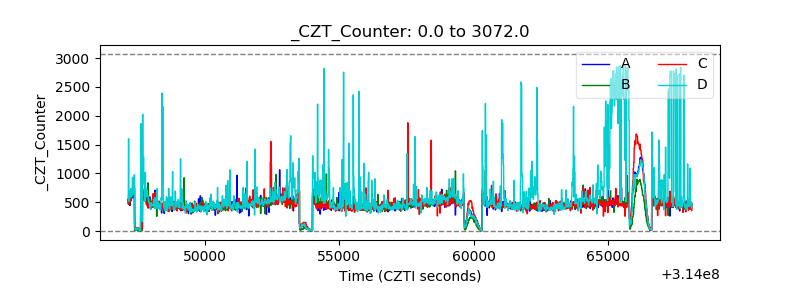 |
| +2.5 Volts monitor |  |
| +5 Volts monitor |  |
| _ROLL_ROT | 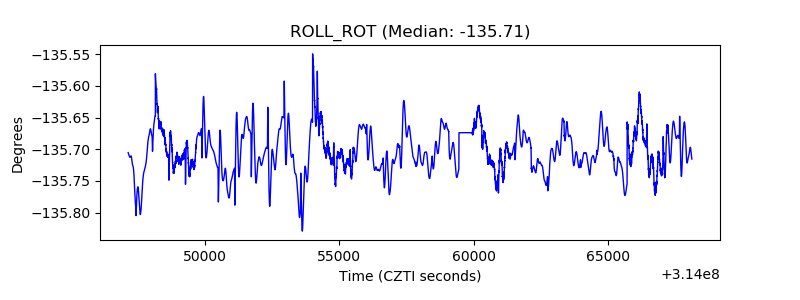 |
| _Roll_DEC | 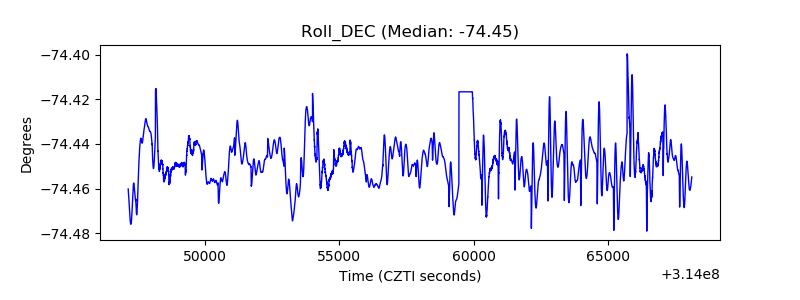 |
| _Roll_RA | 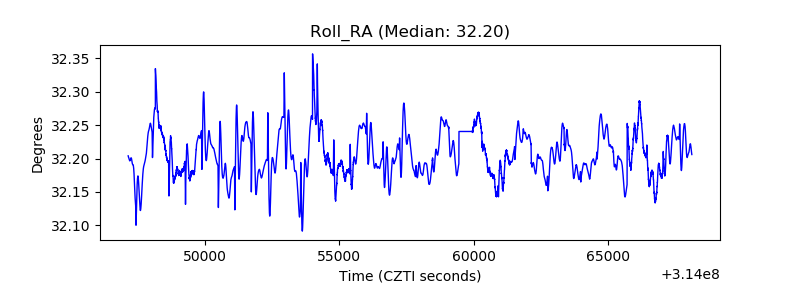 |
| Veto Counter |  |