| Param | Original file | Final file |
|---|---|---|
| Filename | modeM0/AS1T03_168T01_9000003368_22780cztM0_level2.evt | modeM0/AS1T03_168T01_9000003368_22780cztM0_level2_quad_clean.evt |
| Size (bytes) | 457,490,880 | 136,304,640 |
| Size | 436.3 MB | 130.0 MB |
| Events in quadrant A | 3,171,413 | 933,079 |
| Events in quadrant B | 3,306,787 | 951,404 |
| Events in quadrant C | 3,304,499 | 908,015 |
| Events in quadrant D | 3,630,732 | 882,827 |
| Mode SS | |||
|---|---|---|---|
| Quadrant | BADHDUFLAG | Total packets | Discarded packets |
| A | 0 | 130 | 0 |
| B | 0 | 130 | 0 |
| C | 0 | 130 | 0 |
| D | 0 | 130 | 0 |
| Mode M9 | |||
|---|---|---|---|
| Quadrant | BADHDUFLAG | Total packets | Discarded packets |
| A | 0 | 14 | 0 |
| B | 0 | 15 | 0 |
| C | 0 | 15 | 0 |
| D | 0 | 15 | 0 |
| Mode M0 | |||
|---|---|---|---|
| Quadrant | BADHDUFLAG | Total packets | Discarded packets |
| A | 0 | 13523 | 2 |
| B | 0 | 13879 | 2 |
| C | 0 | 13916 | 2 |
| D | 0 | 14761 | 2 |
| Quadrant | Total seconds | Saturated seconds | Saturation percentage |
|---|---|---|---|
| A | 6506 | 31 | 0.476483% |
| B | 6506 | 42 | 0.645558% |
| C | 6506 | 96 | 1.475561% |
| D | 6506 | 107 | 1.644636% |
Noise dominated data is calculated using 1-second bins in cleaned event files. If a bin has >2000 counts, and if more than 50% of those come from <1% of pixels, then it is considered to be noise-dominated and hence unusable.
| Quadrant | # 1 sec bins | Bins with >0 counts | Bins with >2000 counts | High rate bins dominated by noise | Noise dominated (total time) | Noise dominated (detector-on time) | Marked lightcurve |
|---|---|---|---|---|---|---|---|
| A | 7651 | 6507 | 0 | 0 | 0.00% | 0.00% | 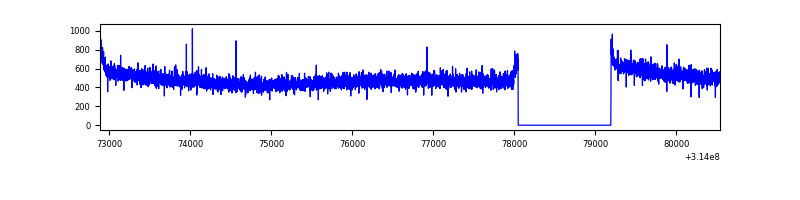 |
| B | 7651 | 6507 | 4 | 4 | 0.05% | 0.06% | 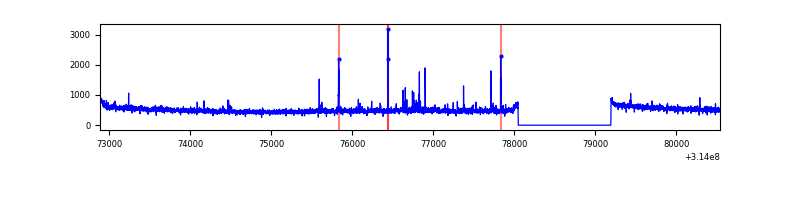 |
| C | 7651 | 6507 | 8 | 8 | 0.10% | 0.12% | 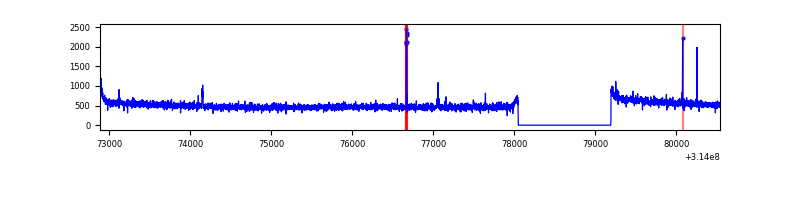 |
| D | 7651 | 6507 | 71 | 71 | 0.93% | 1.09% | 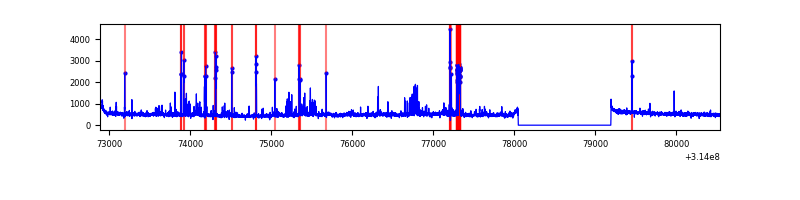 |
Top three noisy pixels from each quadrant. If the there are fewer than three noisy pixels in the level2.evt file, extra rows are filled as -1
| Pixel properties | Quadrant properties | ||||||
|---|---|---|---|---|---|---|---|
| Quadrant | DetID | PixID | Counts | Sigma | Mean | Median | Sigma |
| A | 13 | 254 | 11517 | 65.8 | 822 | 808 | 162.8 |
| A | 0 | 226 | 7001 | 38.05 | 822 | 808 | 162.8 |
| A | 3 | 137 | 6337 | 33.97 | 822 | 808 | 162.8 |
| B | 0 | 230 | 37408 | 239.61 | 824 | 803 | 152.8 |
| B | 0 | 228 | 28565 | 181.73 | 824 | 803 | 152.8 |
| B | 12 | 111 | 17800 | 111.26 | 824 | 803 | 152.8 |
| C | 14 | 238 | 130335 | 704.1 | 801 | 806 | 184.0 |
| C | 10 | 22 | 31664 | 167.74 | 801 | 806 | 184.0 |
| C | 2 | 16 | 16321 | 84.34 | 801 | 806 | 184.0 |
| D | 1 | 52 | 428484 | 2223.53 | 805 | 781 | 192.4 |
| D | 12 | 227 | 60944 | 312.77 | 805 | 781 | 192.4 |
| D | 2 | 153 | 26717 | 134.84 | 805 | 781 | 192.4 |
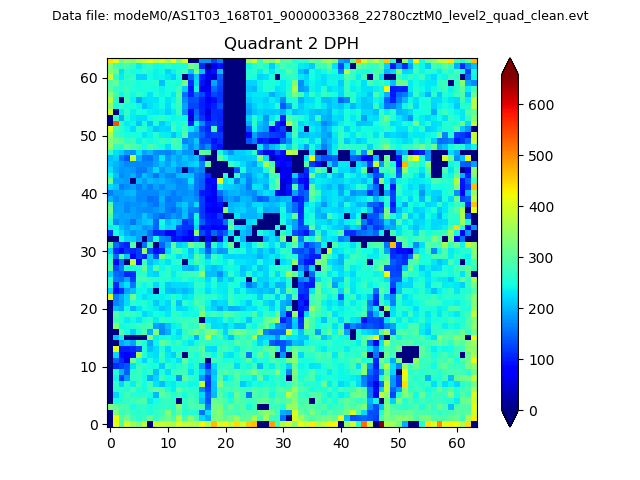
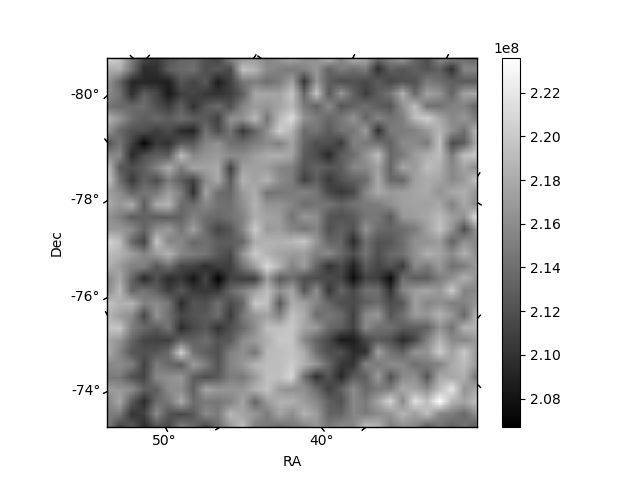
Histogram calculated using DETX and DETY for each event in the final _common_clean file
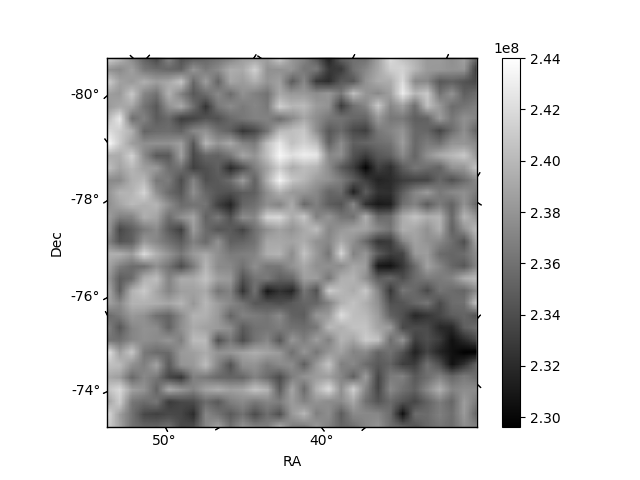
| Quadrant A | 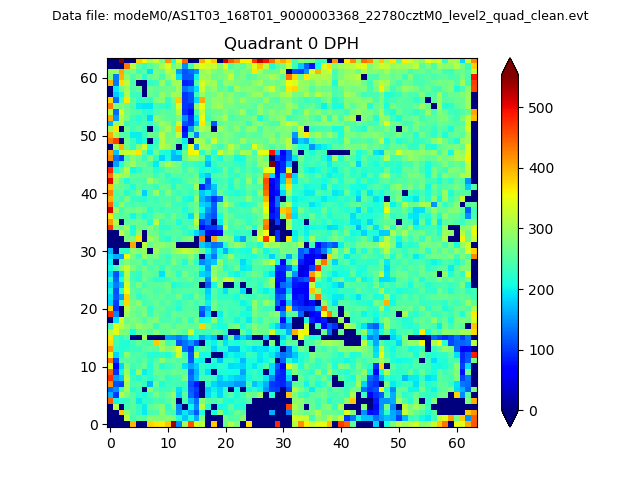 |
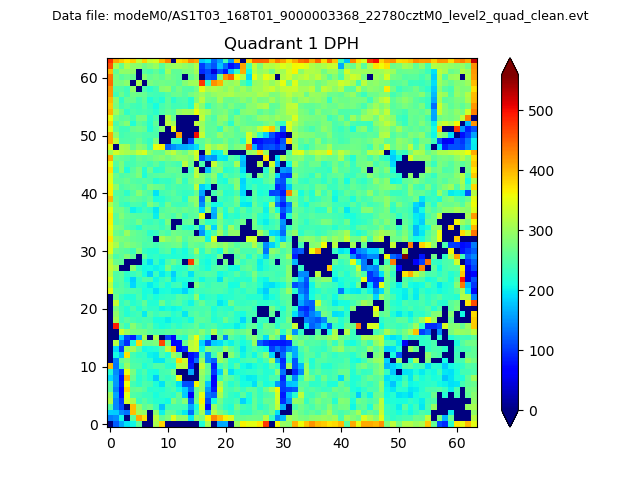 |
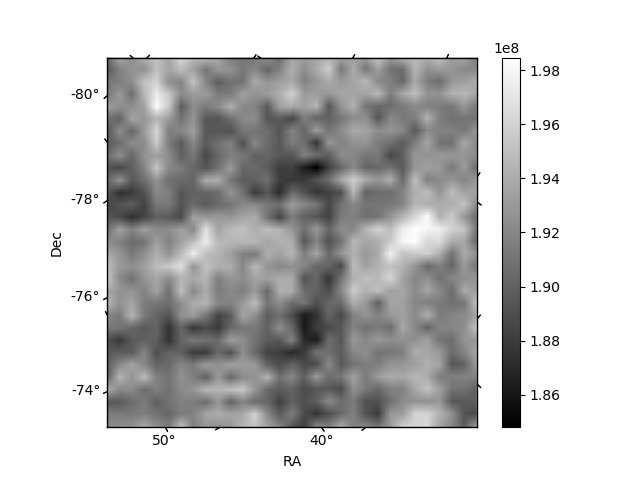
Quadrant B |
|---|---|---|---|
| Quadrant D | 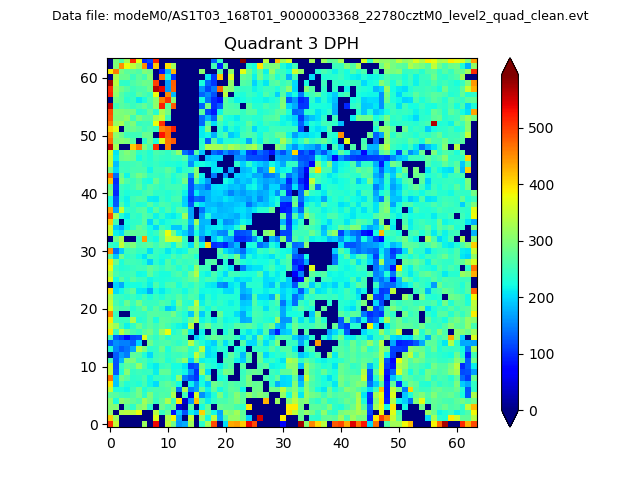 |
 |
Quadrant C |
| Plot type | Count rate plots | Images |
|---|---|---|
| Comparison with Poisson distribution Blue bars denote a histogram of data divided into 1 sec bins. Red curve is a Poisson curve with rate = median count rate of data. |
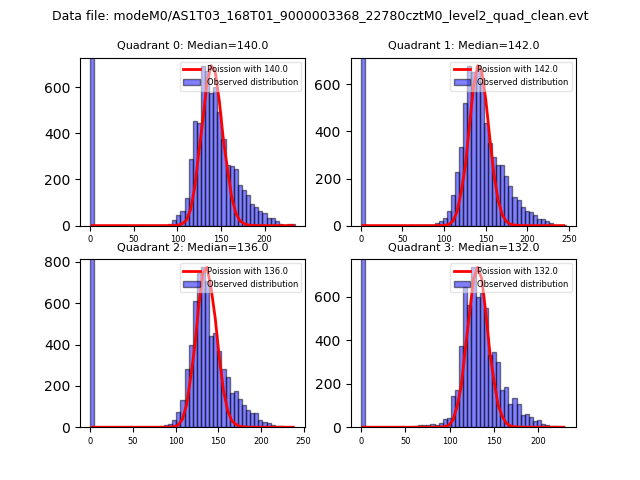 |
 |
| Quadrant-wise count rates Data is divided into 100 sec bins |
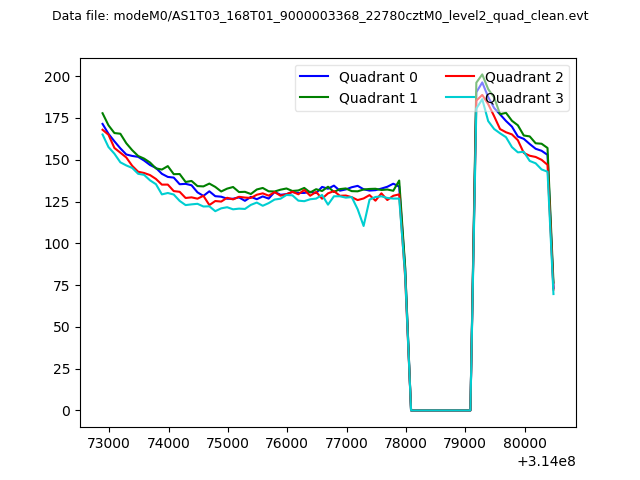 |
|
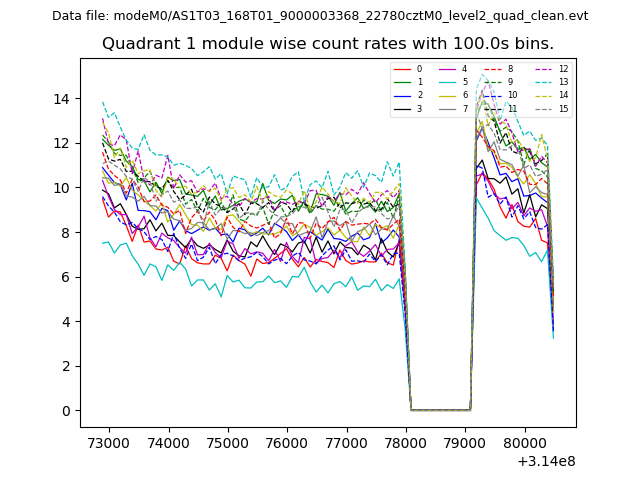
| Module-wise count rates for Quadrant A Data is divided into 100 sec bins |
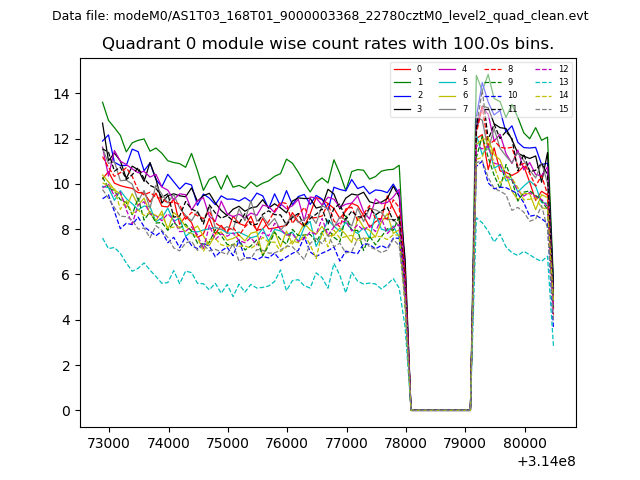 |
 |
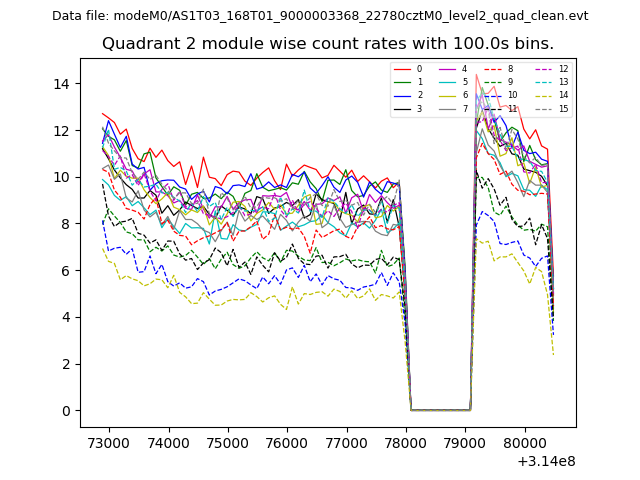
| Module-wise count rates for Quadrant B Data is divided into 100 sec bins |
 |
 |
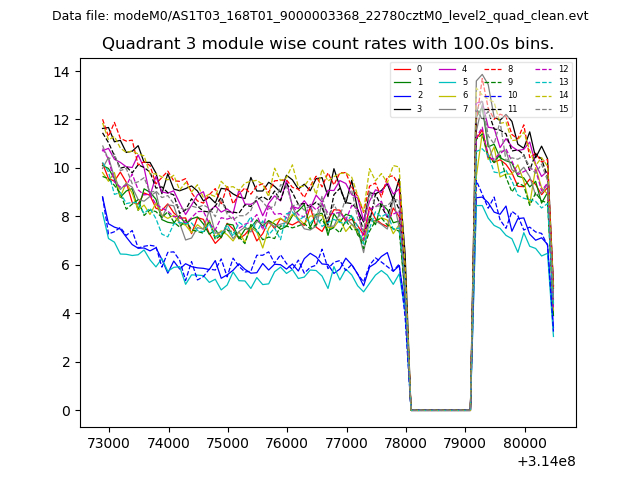
| Module-wise count rates for Quadrant C Data is divided into 100 sec bins |
 |
 |
| Module-wise count rates for Quadrant D Data is divided into 100 sec bins |
 |
 |
| Parameter | Plot |
|---|---|
| CZT HV Monitor | 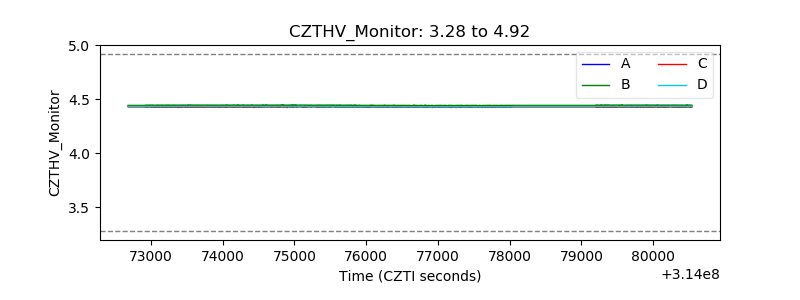 |
| D_VDD | 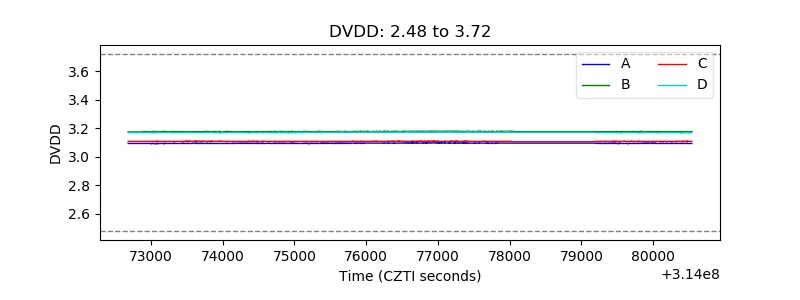 |
| Temperature 1 | 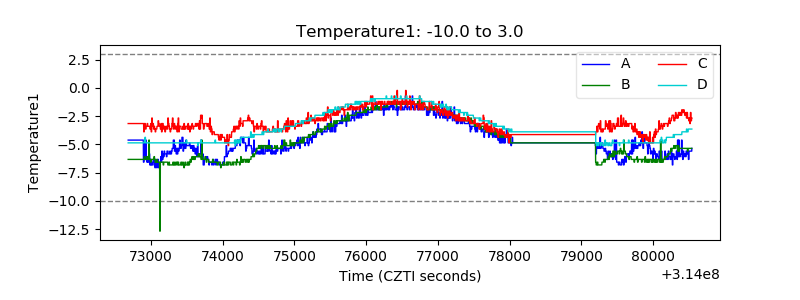 |
| Veto HV Monitor | 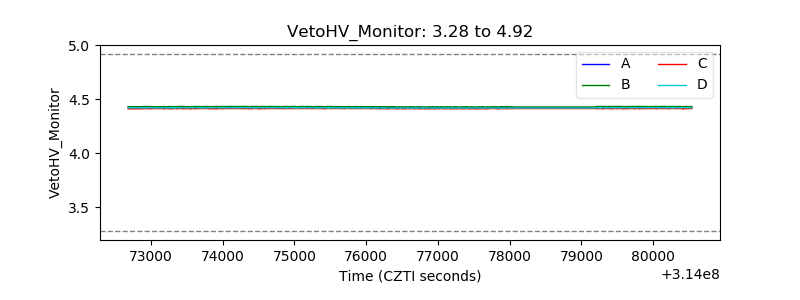 |
| Veto LLD | 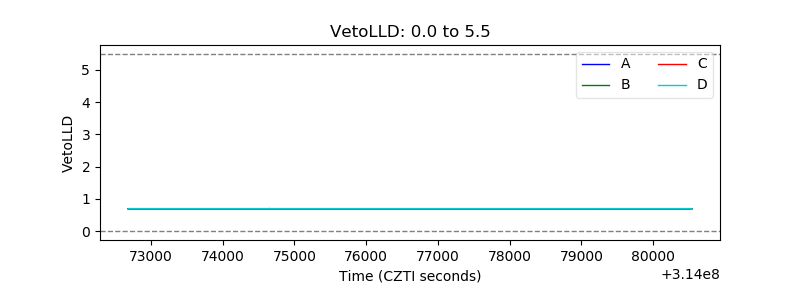 |
| Alpha Counter | 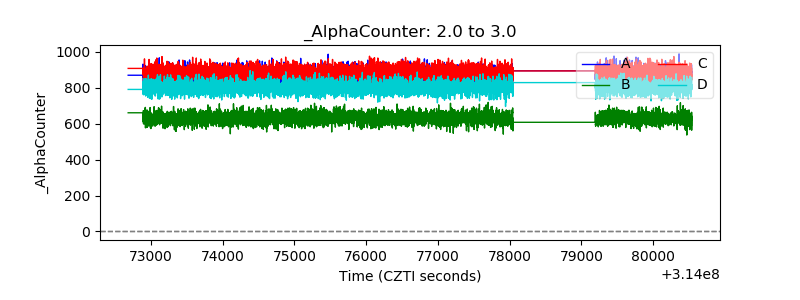 |
| _CPM_Rate | 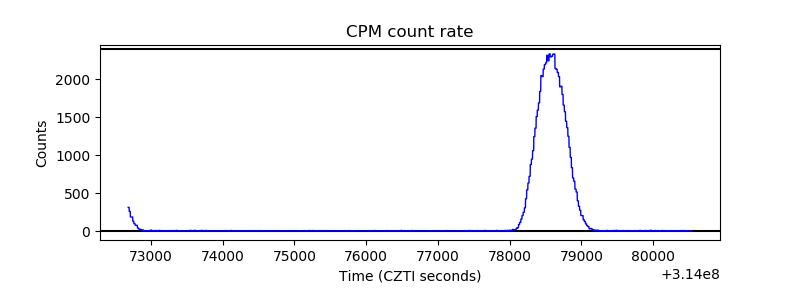 |
| CZT Counter | 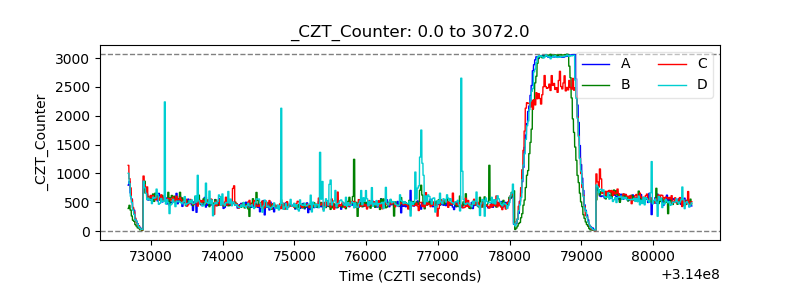 |
| +2.5 Volts monitor |  |
| +5 Volts monitor |  |
| _ROLL_ROT | 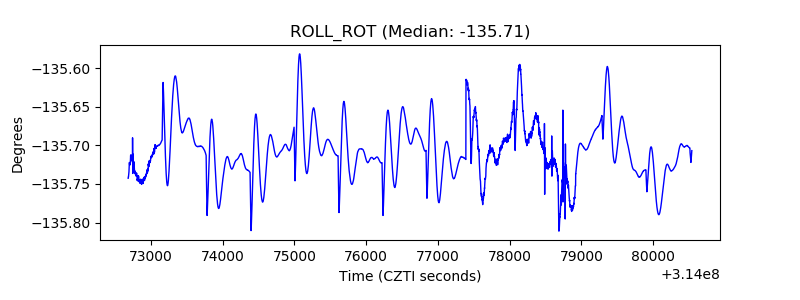 |
| _Roll_DEC | 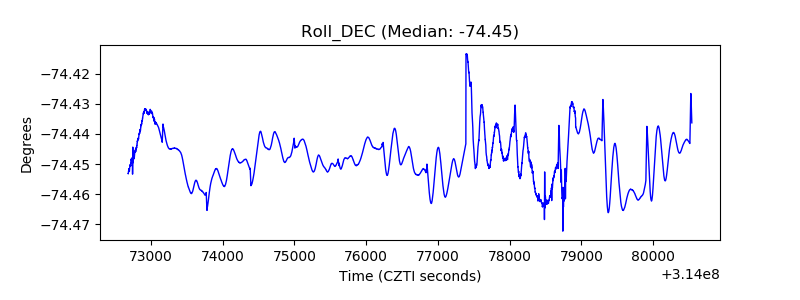 |
| _Roll_RA |  |
| Veto Counter | 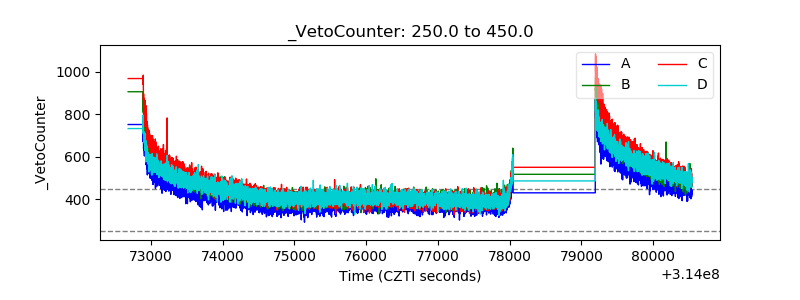 |