| Param | Original file | Final file |
|---|---|---|
| Filename | modeM0/AS1T03_168T01_9000003368_22785cztM0_level2.evt | modeM0/AS1T03_168T01_9000003368_22785cztM0_level2_quad_clean.evt |
| Size (bytes) | 432,120,960 | 132,632,640 |
| Size | 412.1 MB | 126.5 MB |
| Events in quadrant A | 3,082,549 | 916,908 |
| Events in quadrant B | 3,179,960 | 921,181 |
| Events in quadrant C | 3,124,994 | 877,021 |
| Events in quadrant D | 3,273,535 | 865,194 |
| Mode SS | |||
|---|---|---|---|
| Quadrant | BADHDUFLAG | Total packets | Discarded packets |
| A | 0 | 126 | 0 |
| B | 0 | 126 | 0 |
| C | 0 | 126 | 0 |
| D | 0 | 126 | 0 |
| Mode M9 | |||
|---|---|---|---|
| Quadrant | BADHDUFLAG | Total packets | Discarded packets |
| A | 0 | 11 | 0 |
| B | 0 | 11 | 0 |
| C | 0 | 11 | 0 |
| D | 0 | 11 | 0 |
| Mode M0 | |||
|---|---|---|---|
| Quadrant | BADHDUFLAG | Total packets | Discarded packets |
| A | 0 | 12979 | 1 |
| B | 0 | 13184 | 1 |
| C | 0 | 13158 | 1 |
| D | 0 | 13745 | 1 |
| Quadrant | Total seconds | Saturated seconds | Saturation percentage |
|---|---|---|---|
| A | 6265 | 108 | 1.723863% |
| B | 6266 | 90 | 1.436323% |
| C | 6266 | 139 | 2.218321% |
| D | 6266 | 98 | 1.563996% |
Noise dominated data is calculated using 1-second bins in cleaned event files. If a bin has >2000 counts, and if more than 50% of those come from <1% of pixels, then it is considered to be noise-dominated and hence unusable.
| Quadrant | # 1 sec bins | Bins with >0 counts | Bins with >2000 counts | High rate bins dominated by noise | Noise dominated (total time) | Noise dominated (detector-on time) | Marked lightcurve |
|---|---|---|---|---|---|---|---|
| A | 7360 | 6266 | 0 | 0 | 0.00% | 0.00% | 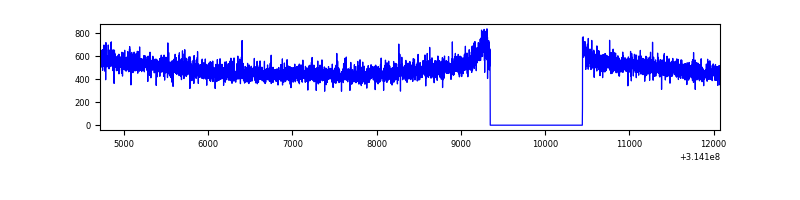 |
| B | 7361 | 6267 | 0 | 0 | 0.00% | 0.00% | 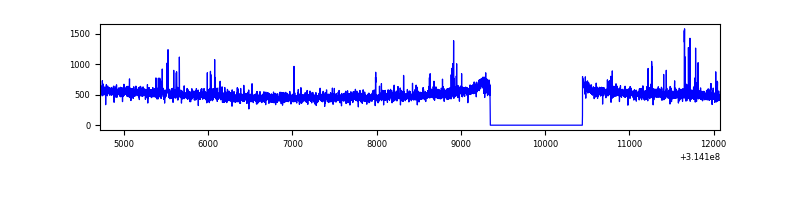 |
| C | 7361 | 6267 | 16 | 16 | 0.22% | 0.26% | 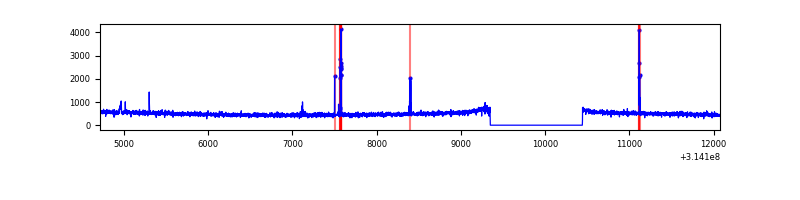 |
| D | 7361 | 6267 | 15 | 15 | 0.20% | 0.24% | 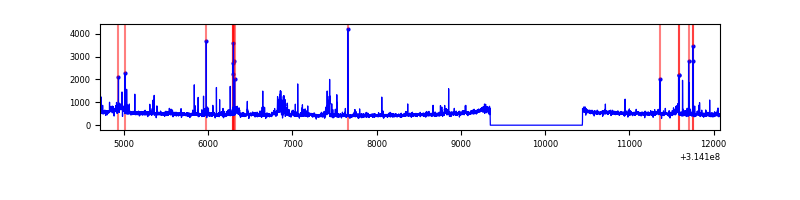 |
Top three noisy pixels from each quadrant. If the there are fewer than three noisy pixels in the level2.evt file, extra rows are filled as -1
| Pixel properties | Quadrant properties | ||||||
|---|---|---|---|---|---|---|---|
| Quadrant | DetID | PixID | Counts | Sigma | Mean | Median | Sigma |
| A | 13 | 254 | 11476 | 67.91 | 798 | 785 | 157.4 |
| A | 0 | 226 | 6931 | 39.04 | 798 | 785 | 157.4 |
| A | 3 | 137 | 6241 | 34.66 | 798 | 785 | 157.4 |
| B | 0 | 228 | 38909 | 263.93 | 789 | 773 | 144.5 |
| B | 0 | 190 | 18380 | 121.85 | 789 | 773 | 144.5 |
| B | 0 | 230 | 16963 | 112.05 | 789 | 773 | 144.5 |
| C | 14 | 238 | 123483 | 715.4 | 751 | 758 | 171.5 |
| C | 10 | 22 | 70628 | 407.29 | 751 | 758 | 171.5 |
| C | 13 | 61 | 5325 | 26.62 | 751 | 758 | 171.5 |
| D | 1 | 52 | 145545 | 790.79 | 769 | 749 | 183.1 |
| D | 7 | 38 | 77421 | 418.74 | 769 | 749 | 183.1 |
| D | 12 | 227 | 29387 | 156.4 | 769 | 749 | 183.1 |
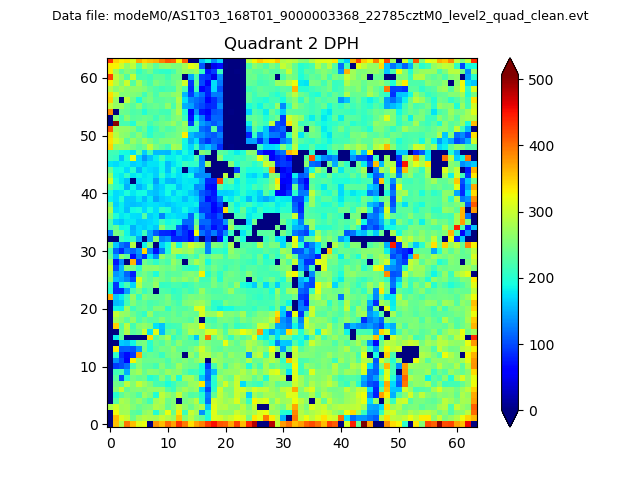
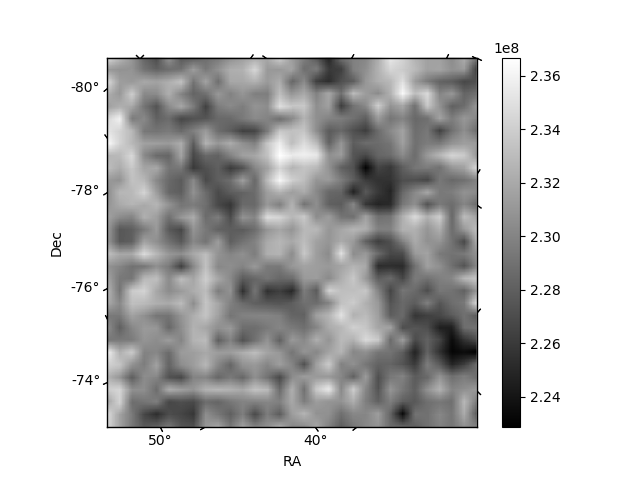
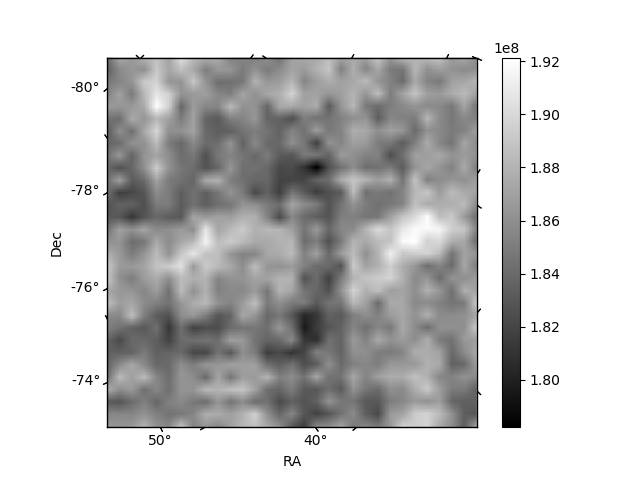
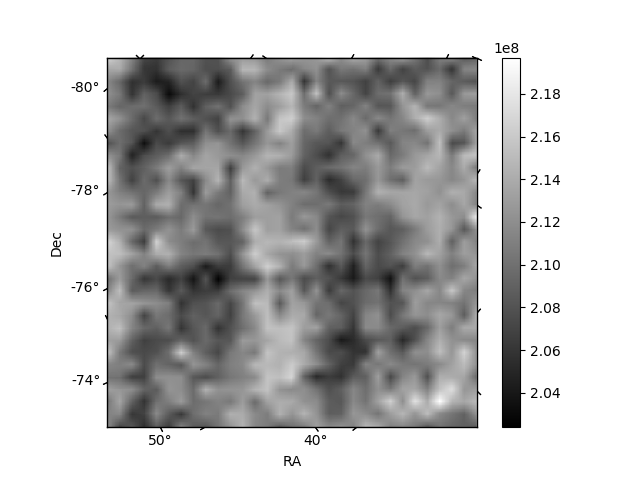
Histogram calculated using DETX and DETY for each event in the final _common_clean file
| Quadrant A | 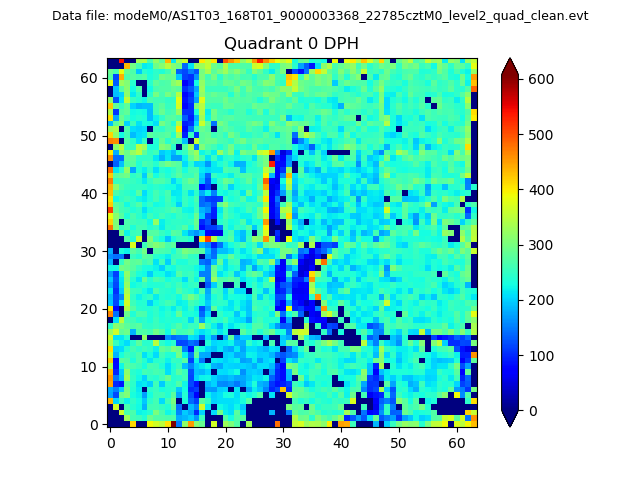 |
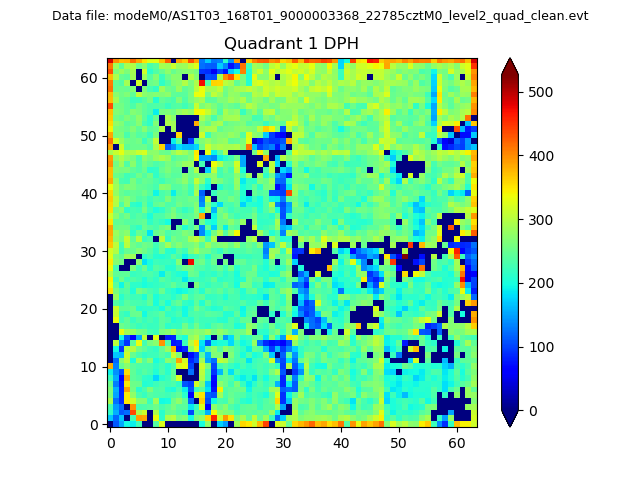 |
Quadrant B |
|---|---|---|---|
| Quadrant D | 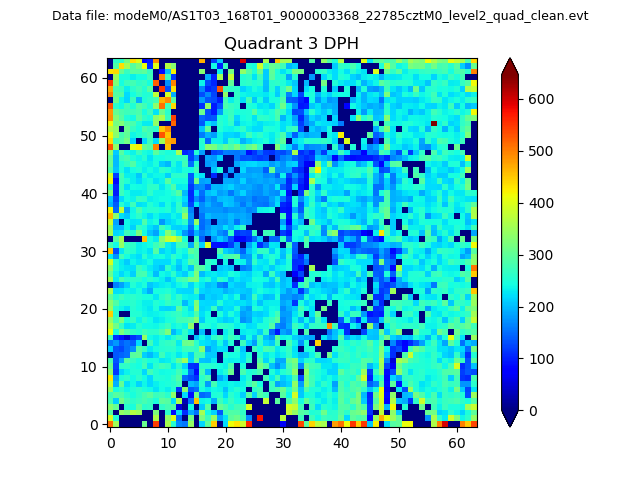 |
 |
Quadrant C |
| Plot type | Count rate plots | Images |
|---|---|---|
| Comparison with Poisson distribution Blue bars denote a histogram of data divided into 1 sec bins. Red curve is a Poisson curve with rate = median count rate of data. |
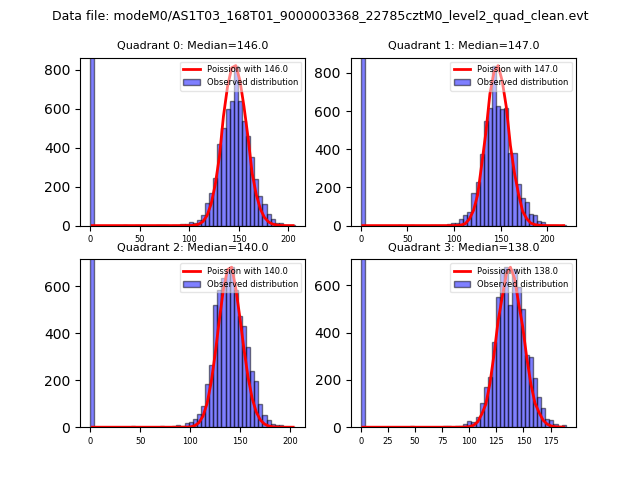 |
 |
| Quadrant-wise count rates Data is divided into 100 sec bins |
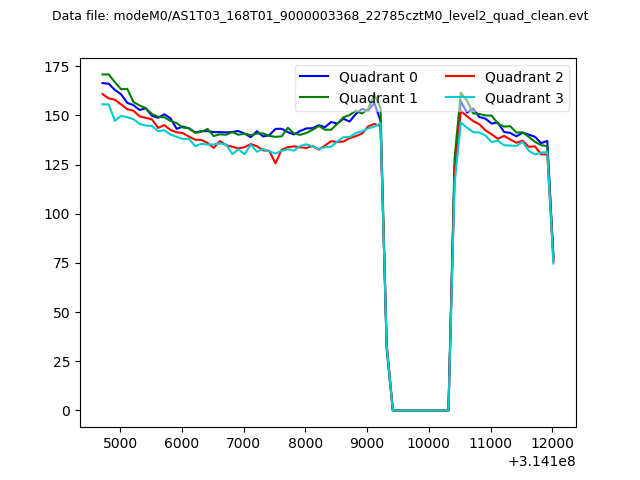 |
|
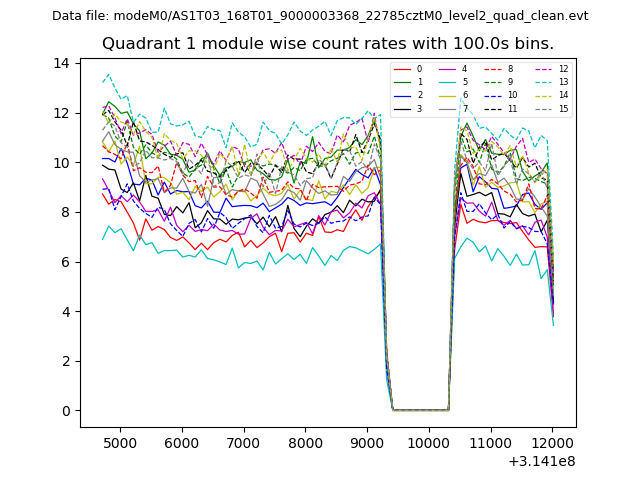
| Module-wise count rates for Quadrant A Data is divided into 100 sec bins |
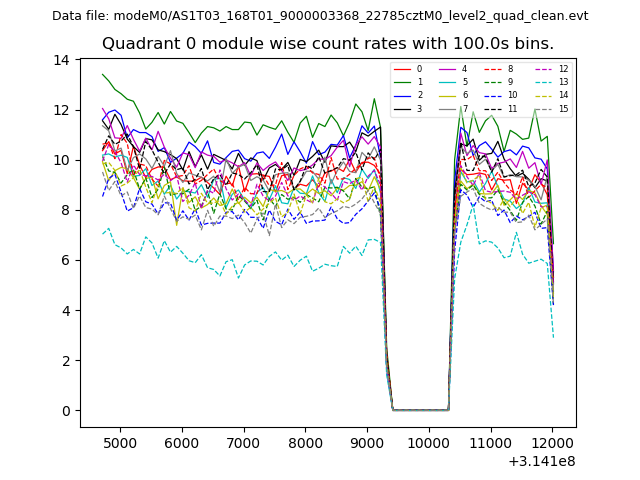 |
 |
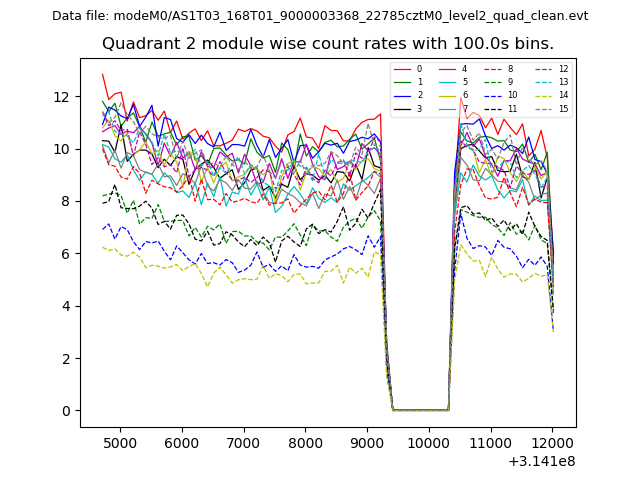
| Module-wise count rates for Quadrant B Data is divided into 100 sec bins |
 |
 |
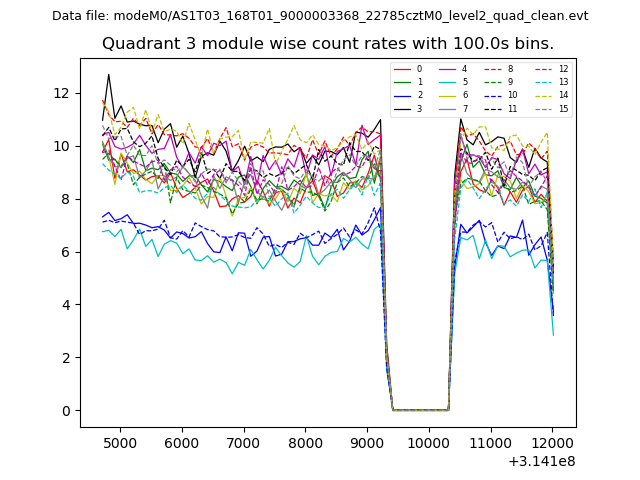
| Module-wise count rates for Quadrant C Data is divided into 100 sec bins |
 |
 |
| Module-wise count rates for Quadrant D Data is divided into 100 sec bins |
 |
 |
| Parameter | Plot |
|---|---|
| CZT HV Monitor | 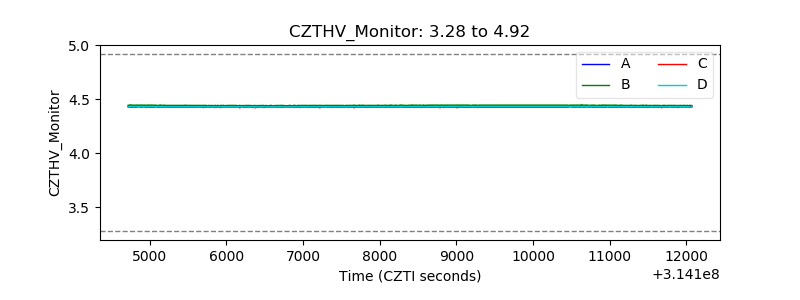 |
| D_VDD |  |
| Temperature 1 | 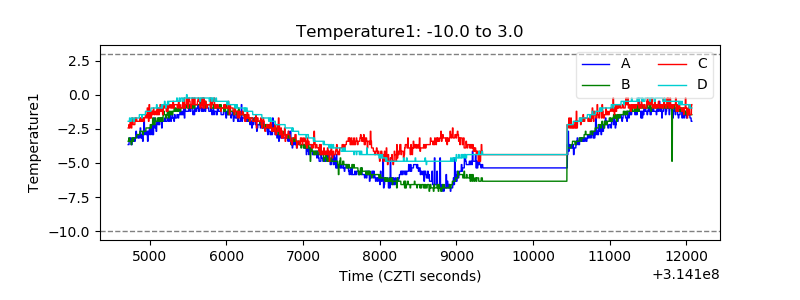 |
| Veto HV Monitor |  |
| Veto LLD | 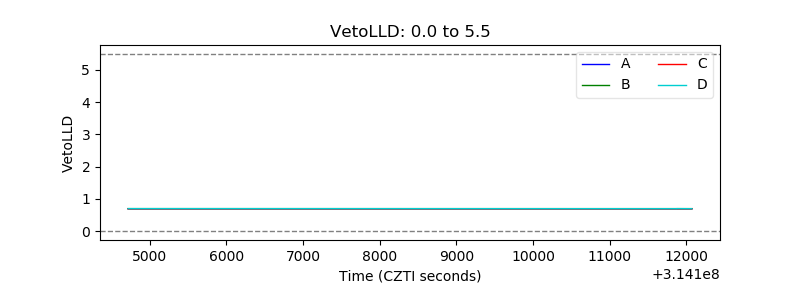 |
| Alpha Counter | 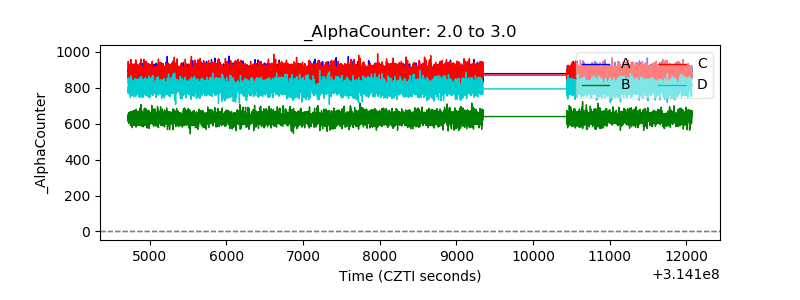 |
| _CPM_Rate | 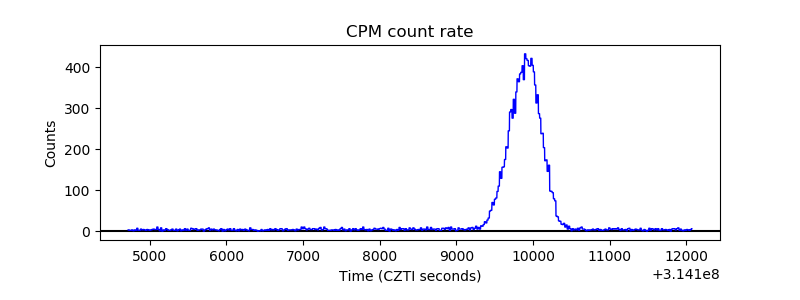 |
| CZT Counter | 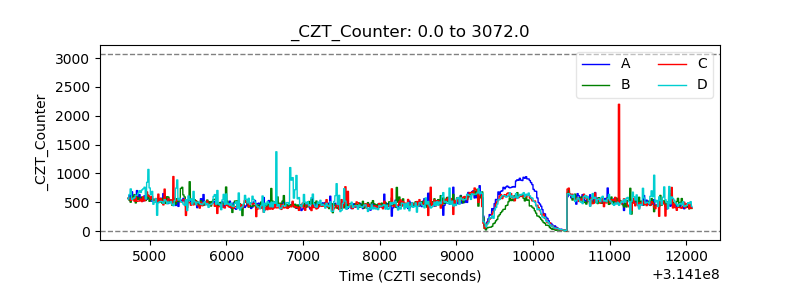 |
| +2.5 Volts monitor |  |
| +5 Volts monitor |  |
| _ROLL_ROT | 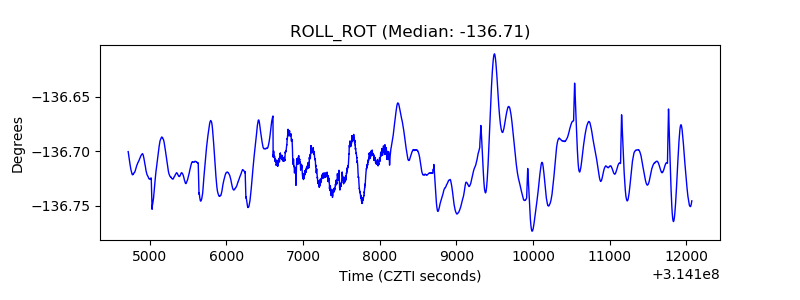 |
| _Roll_DEC | 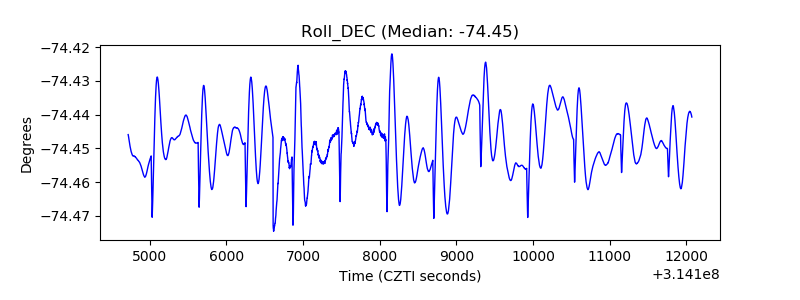 |
| _Roll_RA |  |
| Veto Counter | 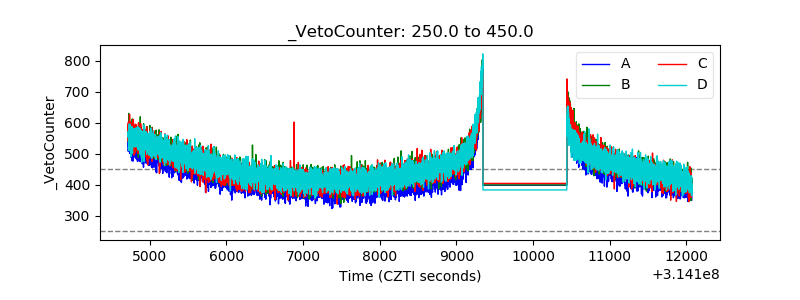 |