| Param | Original file | Final file |
|---|---|---|
| Filename | modeM0/AS1T03_168T01_9000003368_22786cztM0_level2.evt | modeM0/AS1T03_168T01_9000003368_22786cztM0_level2_quad_clean.evt |
| Size (bytes) | 500,016,960 | 130,919,040 |
| Size | 476.9 MB | 124.9 MB |
| Events in quadrant A | 3,178,110 | 915,727 |
| Events in quadrant B | 3,304,220 | 917,559 |
| Events in quadrant C | 3,250,574 | 872,442 |
| Events in quadrant D | 4,956,391 | 793,671 |
| Mode SS | |||
|---|---|---|---|
| Quadrant | BADHDUFLAG | Total packets | Discarded packets |
| A | 0 | 136 | 0 |
| B | 0 | 136 | 0 |
| C | 0 | 136 | 0 |
| D | 0 | 136 | 0 |
| Mode M9 | |||
|---|---|---|---|
| Quadrant | BADHDUFLAG | Total packets | Discarded packets |
| A | 0 | 7 | 0 |
| B | 0 | 7 | 0 |
| C | 0 | 7 | 0 |
| D | 0 | 7 | 0 |
| Mode M0 | |||
|---|---|---|---|
| Quadrant | BADHDUFLAG | Total packets | Discarded packets |
| A | 0 | 13704 | 1 |
| B | 0 | 13954 | 1 |
| C | 0 | 14059 | 2 |
| D | 0 | 19252 | 1 |
| Quadrant | Total seconds | Saturated seconds | Saturation percentage |
|---|---|---|---|
| A | 6678 | 71 | 1.063193% |
| B | 6679 | 73 | 1.092978% |
| C | 6678 | 134 | 2.006589% |
| D | 6678 | 717 | 10.736748% |
Noise dominated data is calculated using 1-second bins in cleaned event files. If a bin has >2000 counts, and if more than 50% of those come from <1% of pixels, then it is considered to be noise-dominated and hence unusable.
| Quadrant | # 1 sec bins | Bins with >0 counts | Bins with >2000 counts | High rate bins dominated by noise | Noise dominated (total time) | Noise dominated (detector-on time) | Marked lightcurve |
|---|---|---|---|---|---|---|---|
| A | 7423 | 6679 | 0 | 0 | 0.00% | 0.00% | 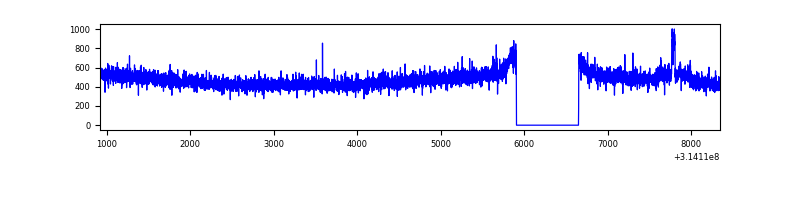 |
| B | 7424 | 6680 | 5 | 5 | 0.07% | 0.07% | 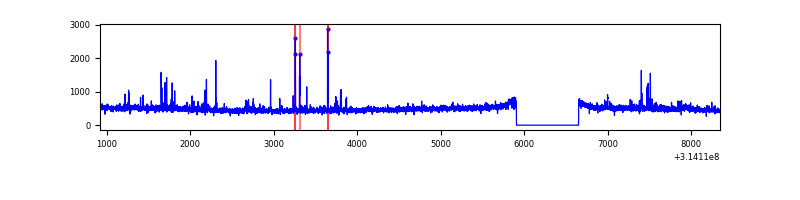 |
| C | 7423 | 6679 | 35 | 35 | 0.47% | 0.52% | 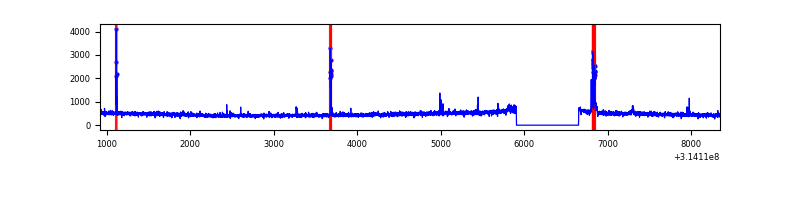 |
| D | 7423 | 6677 | 554 | 554 | 7.46% | 8.30% | 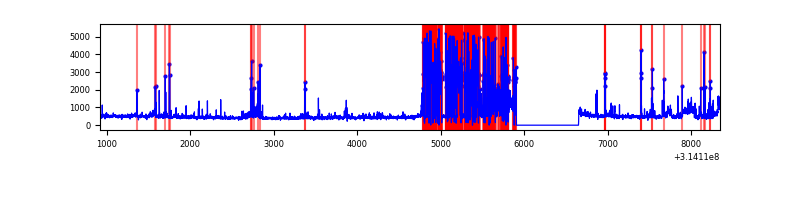 |
Top three noisy pixels from each quadrant. If the there are fewer than three noisy pixels in the level2.evt file, extra rows are filled as -1
| Pixel properties | Quadrant properties | ||||||
|---|---|---|---|---|---|---|---|
| Quadrant | DetID | PixID | Counts | Sigma | Mean | Median | Sigma |
| A | 10 | 17 | 44041 | 266.95 | 812 | 796 | 162.0 |
| A | 13 | 254 | 12247 | 70.69 | 812 | 796 | 162.0 |
| A | 0 | 226 | 7081 | 38.8 | 812 | 796 | 162.0 |
| B | 0 | 228 | 52486 | 343.56 | 805 | 787 | 150.5 |
| B | 0 | 197 | 34579 | 224.56 | 805 | 787 | 150.5 |
| B | 0 | 230 | 32785 | 212.64 | 805 | 787 | 150.5 |
| C | 10 | 22 | 135952 | 764.39 | 766 | 769 | 176.9 |
| C | 14 | 238 | 124009 | 696.86 | 766 | 769 | 176.9 |
| C | 13 | 61 | 5406 | 26.22 | 766 | 769 | 176.9 |
| D | 1 | 52 | 1968309 | 11301.78 | 721 | 699 | 174.1 |
| D | 2 | 152 | 171816 | 982.88 | 721 | 699 | 174.1 |
| D | 12 | 227 | 32098 | 180.35 | 721 | 699 | 174.1 |
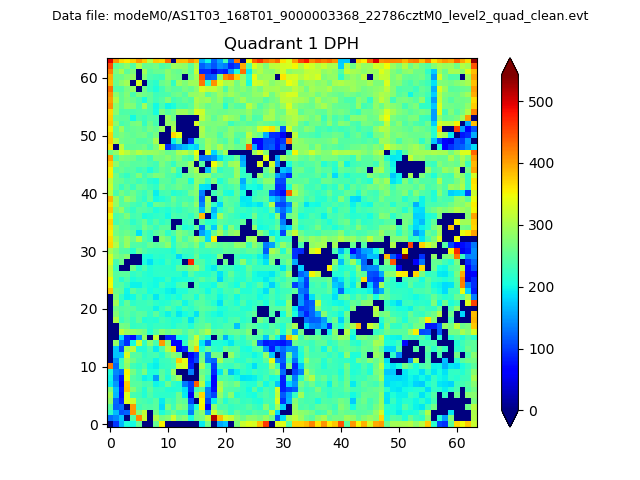
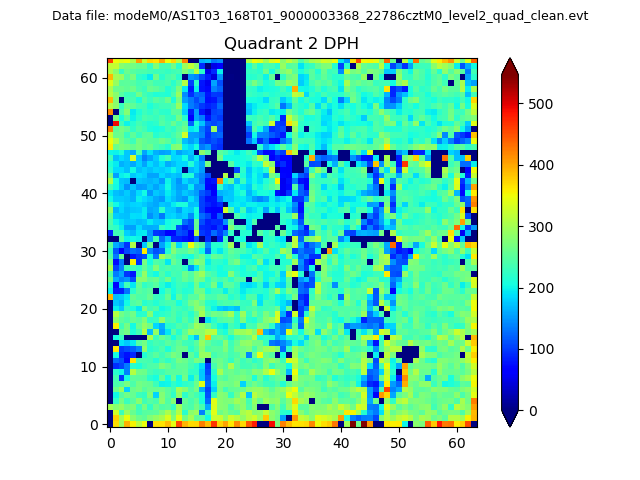
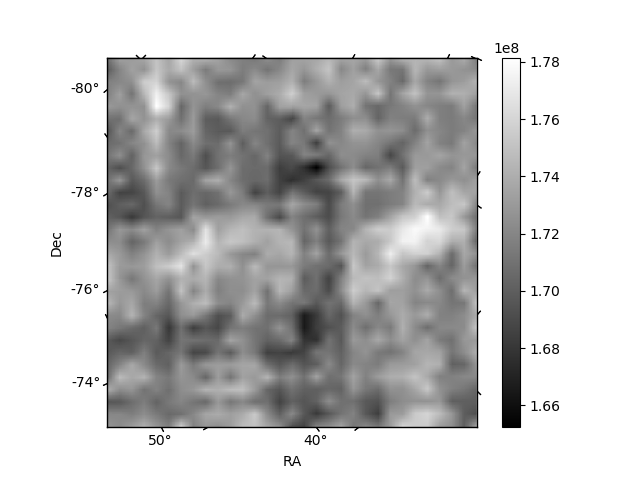
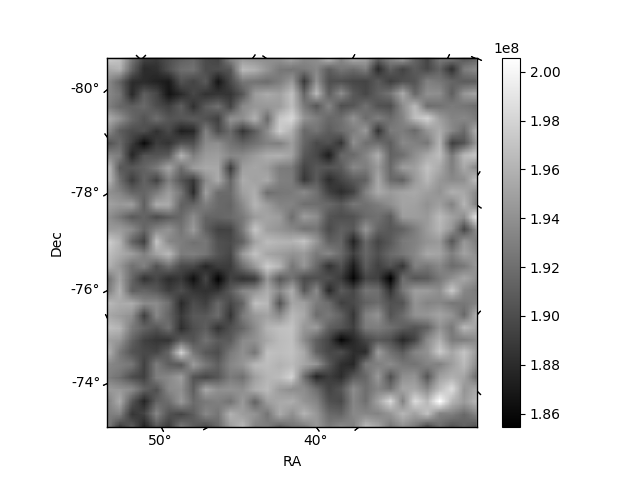
Histogram calculated using DETX and DETY for each event in the final _common_clean file
| Quadrant A |  |
 |
Quadrant B |
|---|---|---|---|
| Quadrant D |  |
 |
Quadrant C |
| Plot type | Count rate plots | Images |
|---|---|---|
| Comparison with Poisson distribution Blue bars denote a histogram of data divided into 1 sec bins. Red curve is a Poisson curve with rate = median count rate of data. |
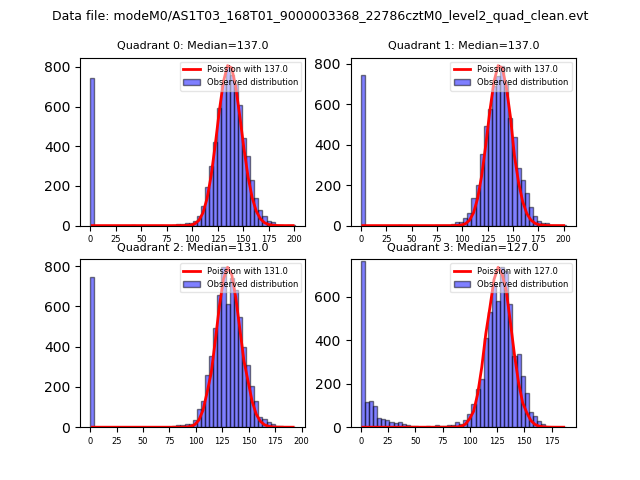 |
 |
| Quadrant-wise count rates Data is divided into 100 sec bins |
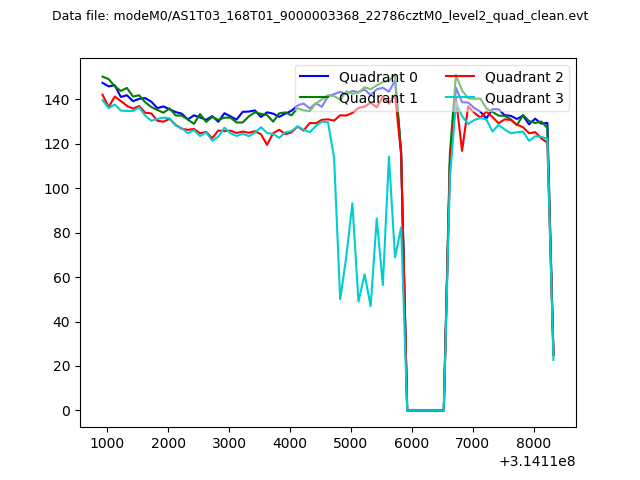 |
|
| Module-wise count rates for Quadrant A Data is divided into 100 sec bins |
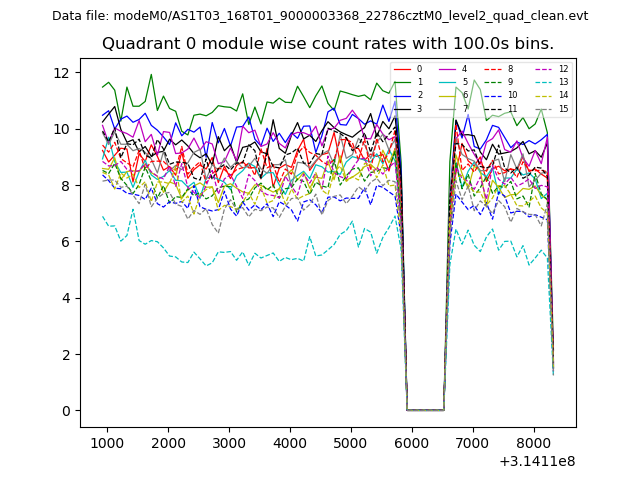 |
 |
| Module-wise count rates for Quadrant B Data is divided into 100 sec bins |
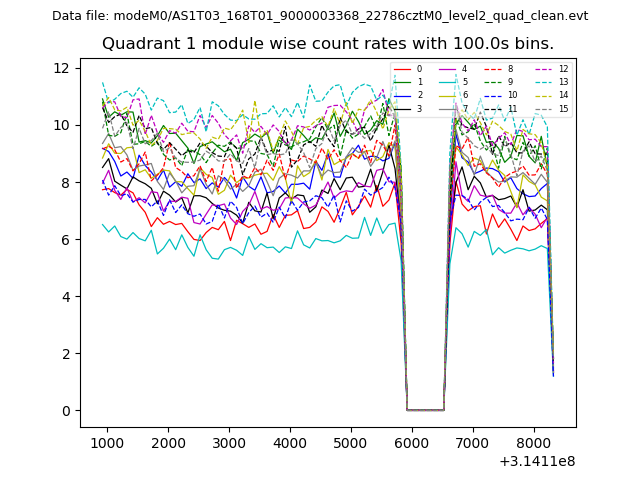 |
 |
| Module-wise count rates for Quadrant C Data is divided into 100 sec bins |
 |
 |
| Module-wise count rates for Quadrant D Data is divided into 100 sec bins |
 |
 |
| Parameter | Plot |
|---|---|
| CZT HV Monitor | 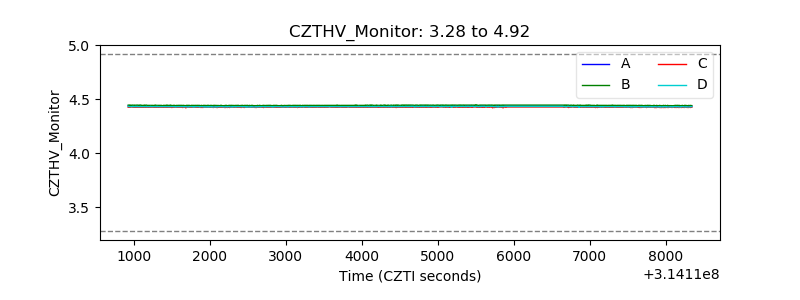 |
| D_VDD | 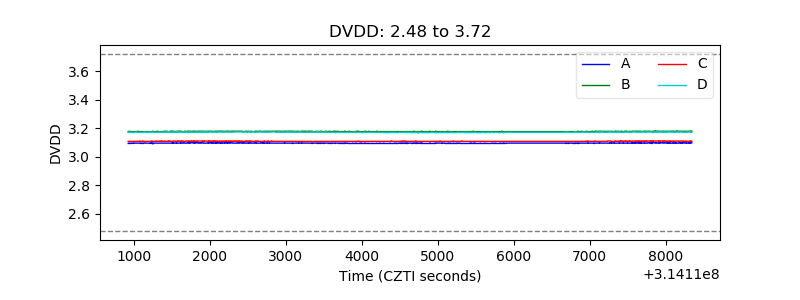 |
| Temperature 1 | 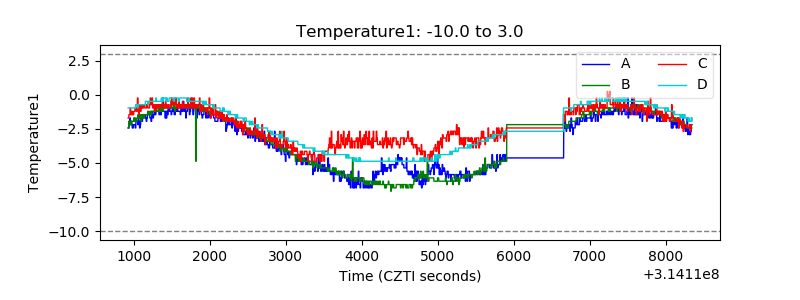 |
| Veto HV Monitor | 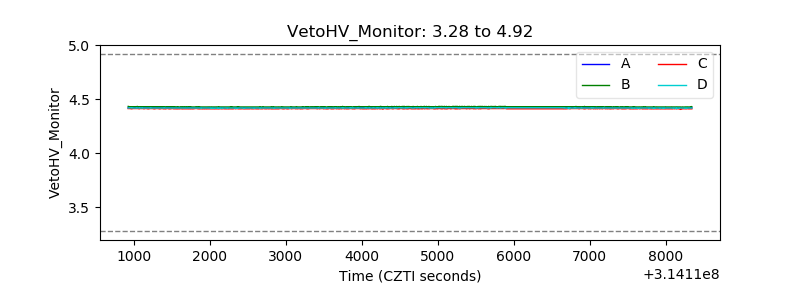 |
| Veto LLD | 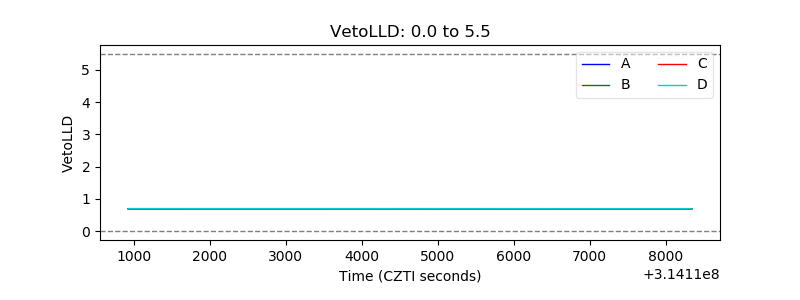 |
| Alpha Counter | 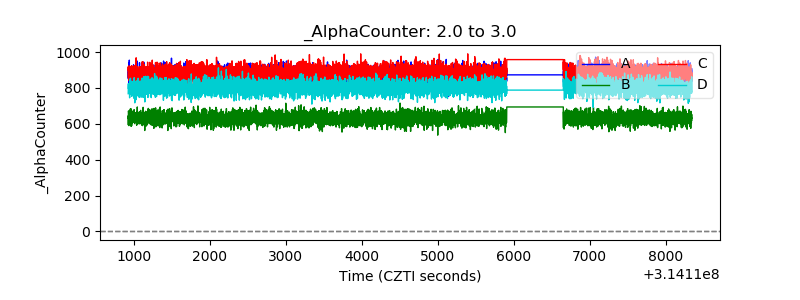 |
| _CPM_Rate | 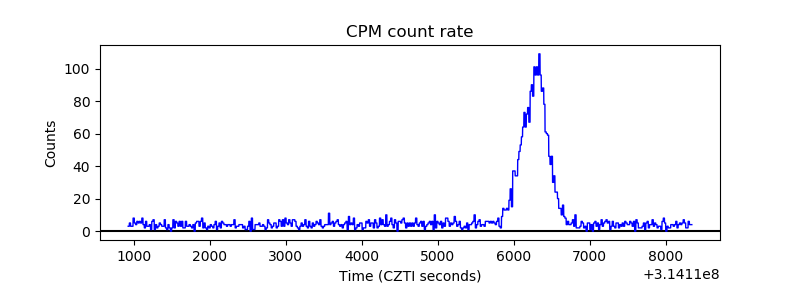 |
| CZT Counter | 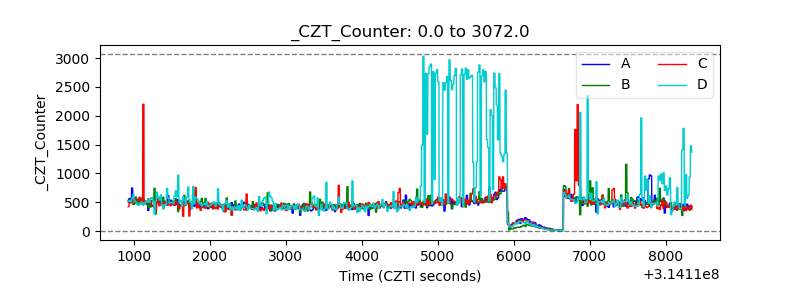 |
| +2.5 Volts monitor | 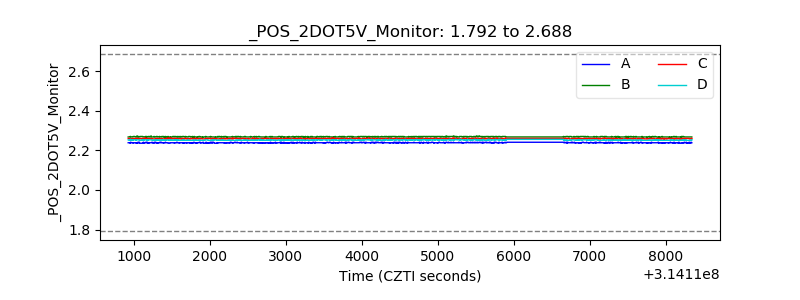 |
| +5 Volts monitor | 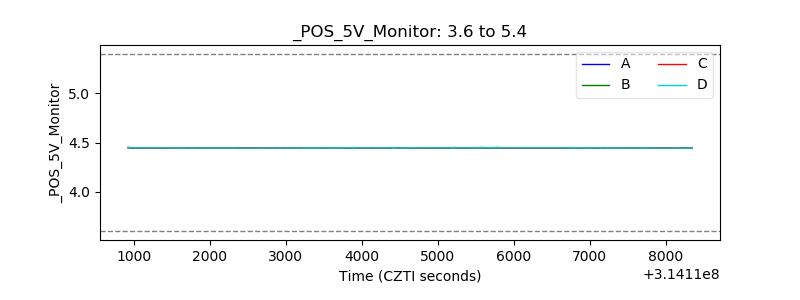 |
| _ROLL_ROT | 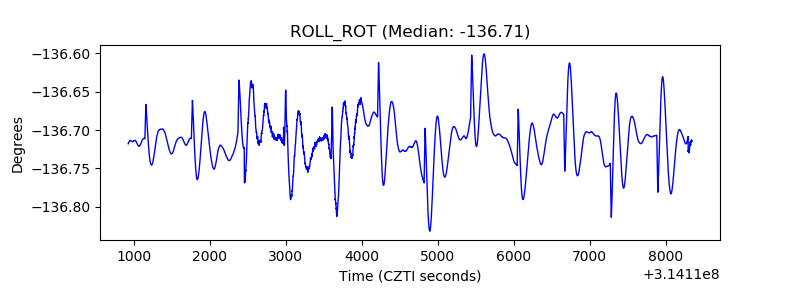 |
| _Roll_DEC | 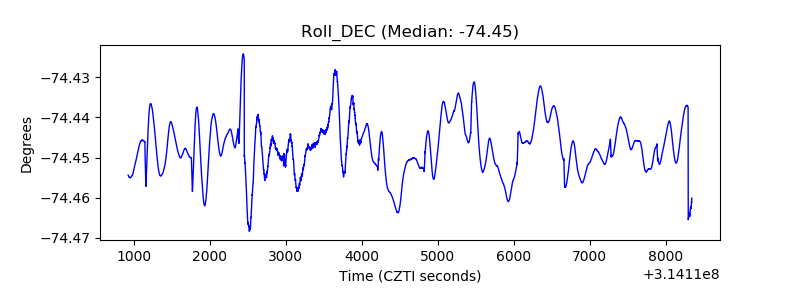 |
| _Roll_RA | 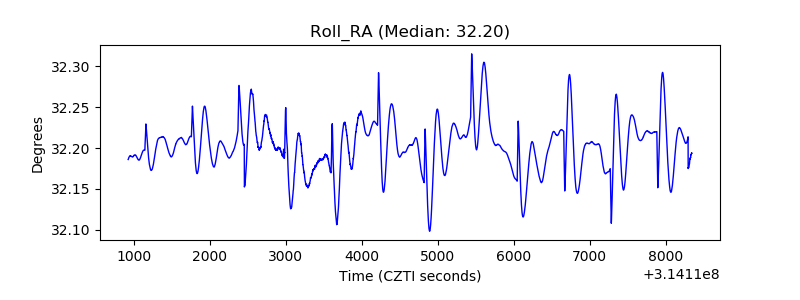 |
| Veto Counter | 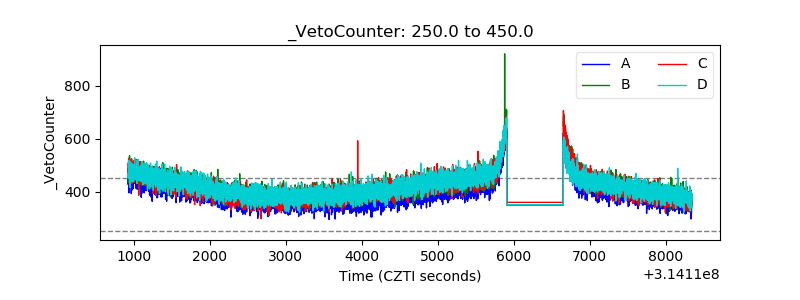 |