| Param | Original file | Final file |
|---|---|---|
| Filename | modeM0/AS1T03_168T01_9000003368_22787cztM0_level2.evt | modeM0/AS1T03_168T01_9000003368_22787cztM0_level2_quad_clean.evt |
| Size (bytes) | 494,280,000 | 140,261,760 |
| Size | 471.4 MB | 133.8 MB |
| Events in quadrant A | 3,398,376 | 960,531 |
| Events in quadrant B | 3,530,918 | 962,798 |
| Events in quadrant C | 3,439,456 | 916,916 |
| Events in quadrant D | 4,109,004 | 904,284 |
| Mode SS | |||
|---|---|---|---|
| Quadrant | BADHDUFLAG | Total packets | Discarded packets |
| A | 0 | 148 | 0 |
| B | 0 | 148 | 0 |
| C | 0 | 148 | 0 |
| D | 0 | 148 | 0 |
| Mode M9 | |||
|---|---|---|---|
| Quadrant | BADHDUFLAG | Total packets | Discarded packets |
| A | 0 | 3 | 0 |
| B | 0 | 3 | 0 |
| C | 0 | 3 | 0 |
| D | 0 | 3 | 0 |
| Mode M0 | |||
|---|---|---|---|
| Quadrant | BADHDUFLAG | Total packets | Discarded packets |
| A | 0 | 14822 | 1 |
| B | 0 | 15111 | 1 |
| C | 0 | 15036 | 1 |
| D | 0 | 16970 | 1 |
| Quadrant | Total seconds | Saturated seconds | Saturation percentage |
|---|---|---|---|
| A | 7232 | 32 | 0.442478% |
| B | 7233 | 47 | 0.649800% |
| C | 7233 | 100 | 1.382552% |
| D | 7233 | 62 | 0.857182% |
Noise dominated data is calculated using 1-second bins in cleaned event files. If a bin has >2000 counts, and if more than 50% of those come from <1% of pixels, then it is considered to be noise-dominated and hence unusable.
| Quadrant | # 1 sec bins | Bins with >0 counts | Bins with >2000 counts | High rate bins dominated by noise | Noise dominated (total time) | Noise dominated (detector-on time) | Marked lightcurve |
|---|---|---|---|---|---|---|---|
| A | 7597 | 7233 | 0 | 0 | 0.00% | 0.00% | 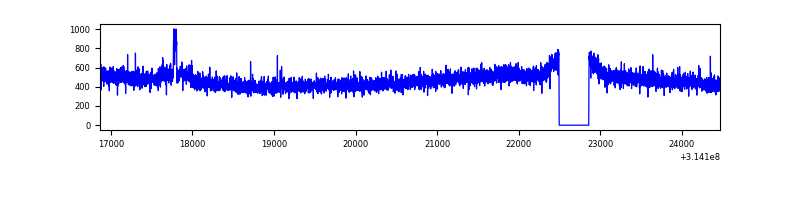 |
| B | 7598 | 7234 | 2 | 2 | 0.03% | 0.03% | 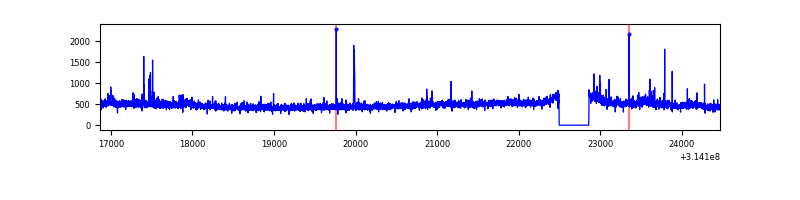 |
| C | 7598 | 7234 | 17 | 17 | 0.22% | 0.24% | 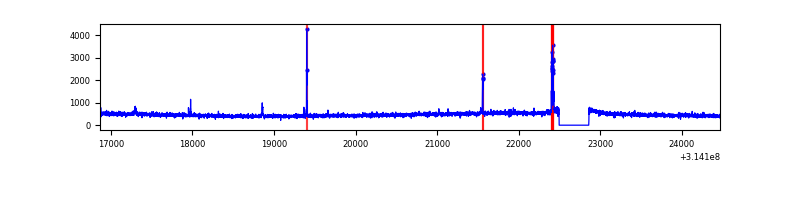 |
| D | 7598 | 7234 | 41 | 41 | 0.54% | 0.57% | 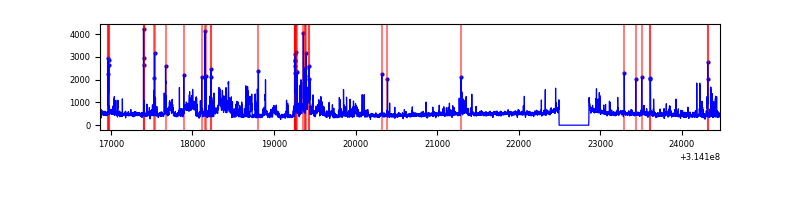 |
Top three noisy pixels from each quadrant. If the there are fewer than three noisy pixels in the level2.evt file, extra rows are filled as -1
| Pixel properties | Quadrant properties | ||||||
|---|---|---|---|---|---|---|---|
| Quadrant | DetID | PixID | Counts | Sigma | Mean | Median | Sigma |
| A | 10 | 17 | 44128 | 249.01 | 869 | 853 | 173.8 |
| A | 13 | 254 | 14258 | 77.13 | 869 | 853 | 173.8 |
| A | 0 | 226 | 7691 | 39.35 | 869 | 853 | 173.8 |
| B | 0 | 230 | 48354 | 295.12 | 863 | 841 | 161.0 |
| B | 0 | 228 | 36973 | 224.43 | 863 | 841 | 161.0 |
| B | 12 | 111 | 18525 | 109.84 | 863 | 841 | 161.0 |
| C | 14 | 238 | 132848 | 686.41 | 823 | 829 | 192.3 |
| C | 10 | 22 | 91716 | 472.55 | 823 | 829 | 192.3 |
| C | 2 | 16 | 7031 | 32.25 | 823 | 829 | 192.3 |
| D | 2 | 152 | 433253 | 2120.59 | 839 | 811 | 203.9 |
| D | 1 | 52 | 327018 | 1599.64 | 839 | 811 | 203.9 |
| D | 2 | 120 | 46203 | 222.59 | 839 | 811 | 203.9 |
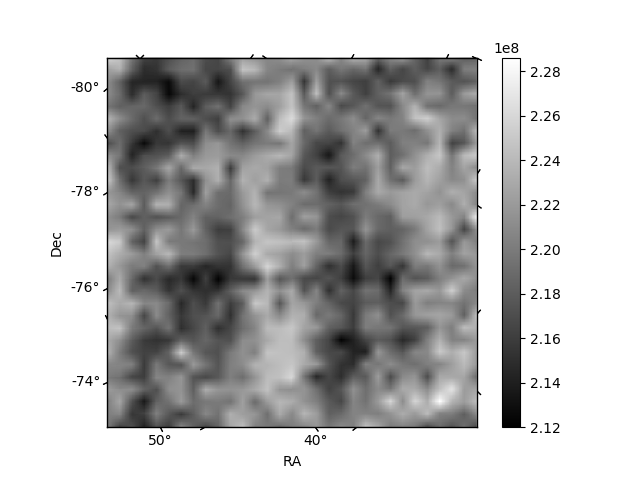
Histogram calculated using DETX and DETY for each event in the final _common_clean file
| Quadrant A |  |
 |
Quadrant B |
|---|---|---|---|
| Quadrant D |  |
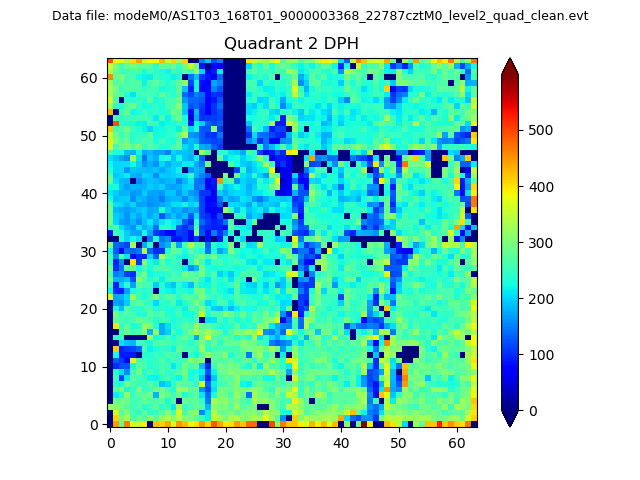 |
Quadrant C |
| Plot type | Count rate plots | Images |
|---|---|---|
| Comparison with Poisson distribution Blue bars denote a histogram of data divided into 1 sec bins. Red curve is a Poisson curve with rate = median count rate of data. |
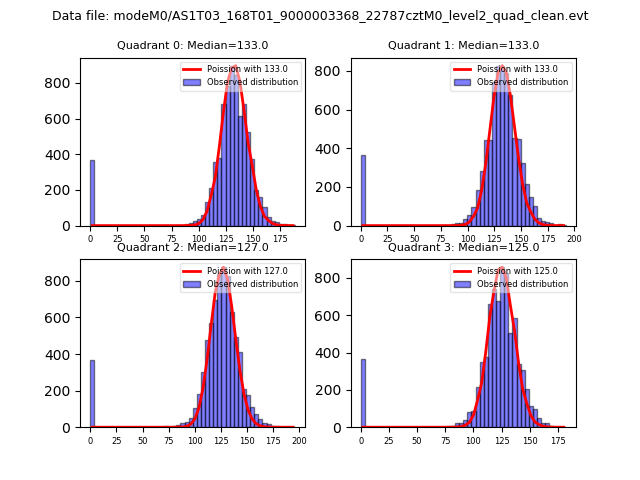 |
 |
| Quadrant-wise count rates Data is divided into 100 sec bins |
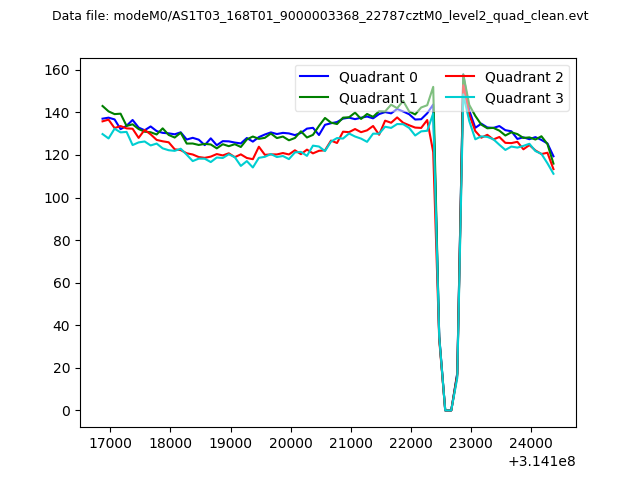 |
|
| Module-wise count rates for Quadrant A Data is divided into 100 sec bins |
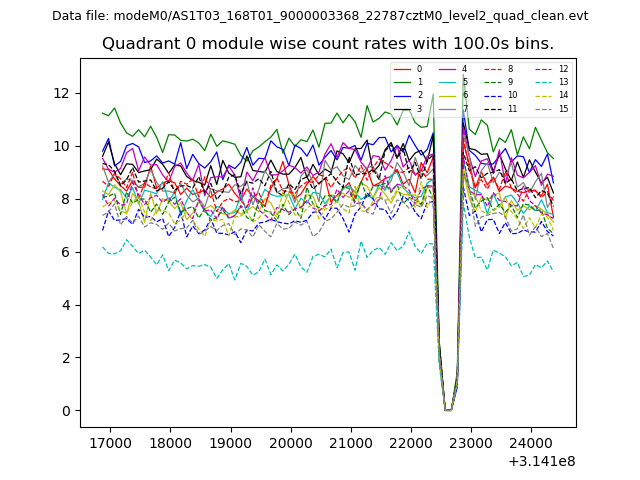 |
 |
| Module-wise count rates for Quadrant B Data is divided into 100 sec bins |
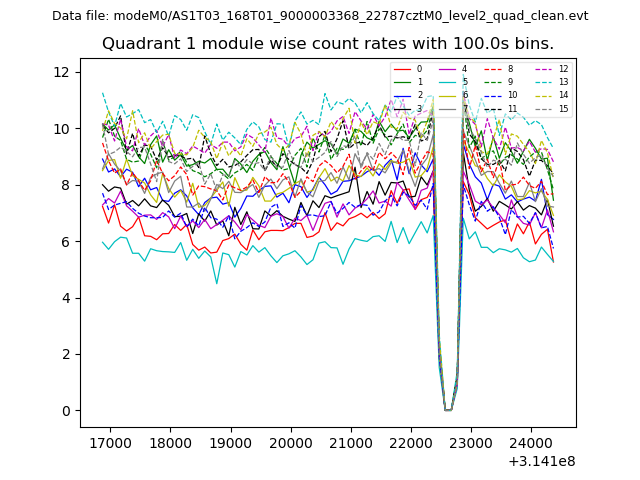 |
 |
| Module-wise count rates for Quadrant C Data is divided into 100 sec bins |
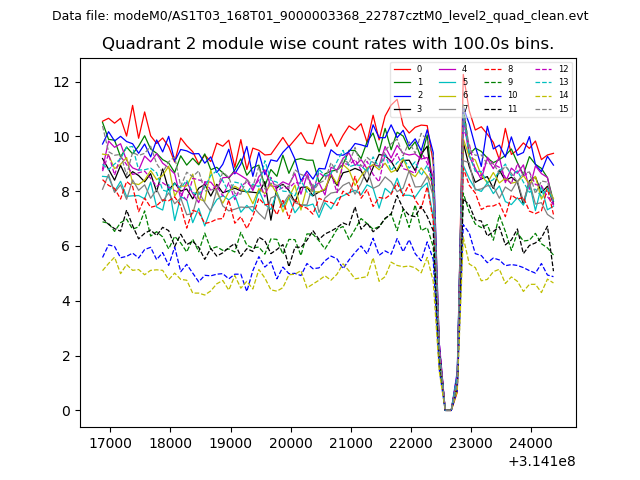 |
 |
| Module-wise count rates for Quadrant D Data is divided into 100 sec bins |
 |
 |
| Parameter | Plot |
|---|---|
| CZT HV Monitor | 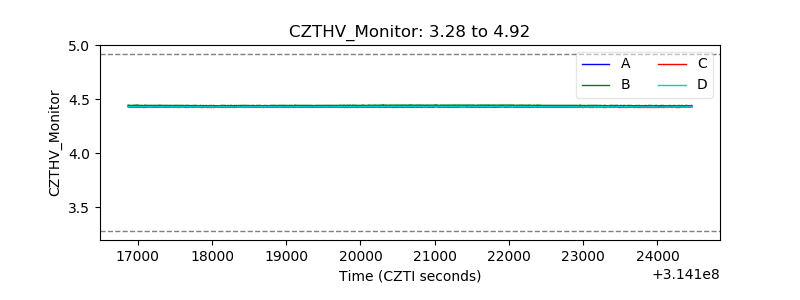 |
| D_VDD | 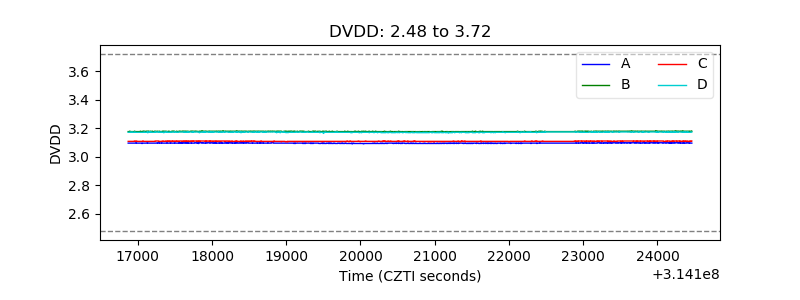 |
| Temperature 1 | 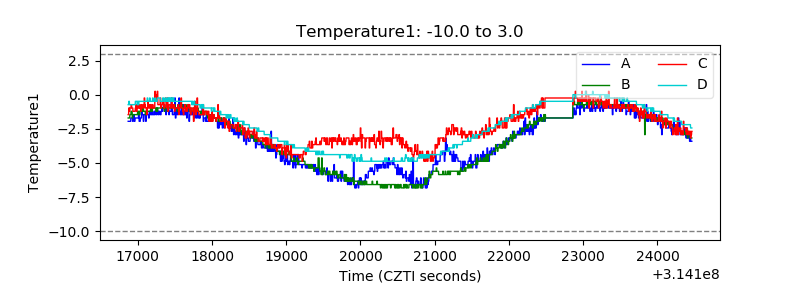 |
| Veto HV Monitor | 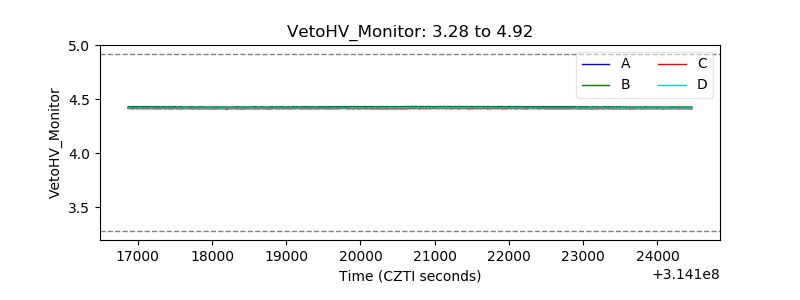 |
| Veto LLD | 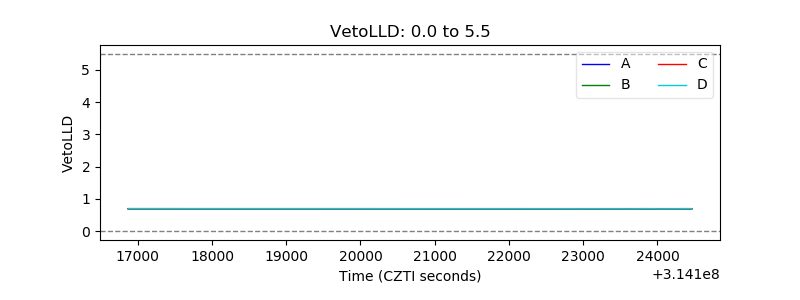 |
| Alpha Counter | 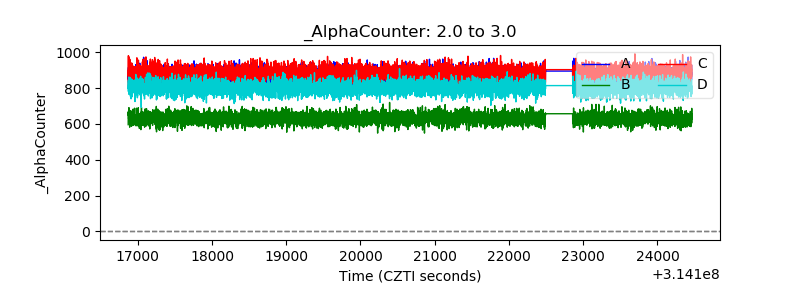 |
| _CPM_Rate | 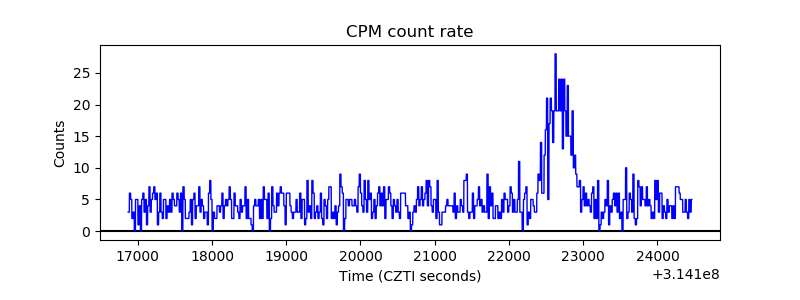 |
| CZT Counter | 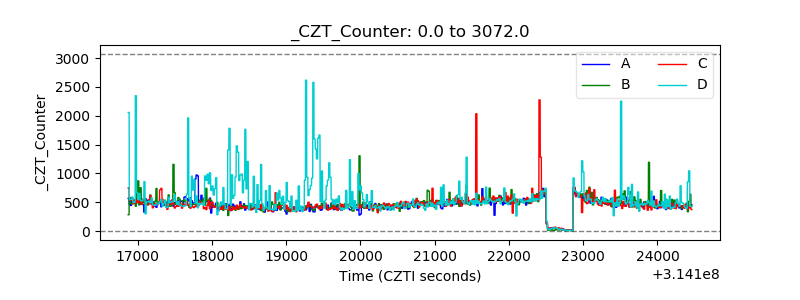 |
| +2.5 Volts monitor |  |
| +5 Volts monitor |  |
| _ROLL_ROT | 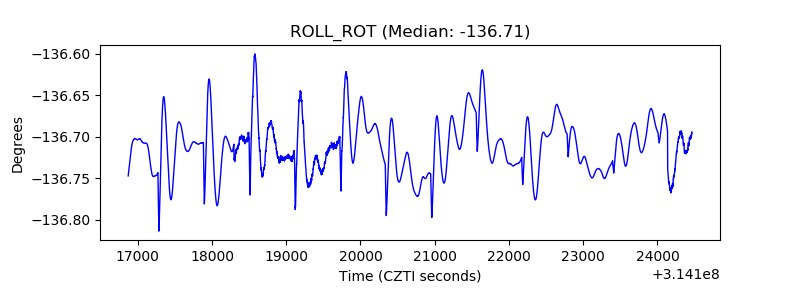 |
| _Roll_DEC | 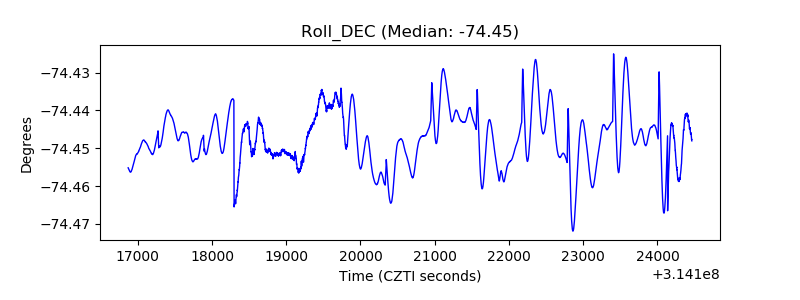 |
| _Roll_RA | 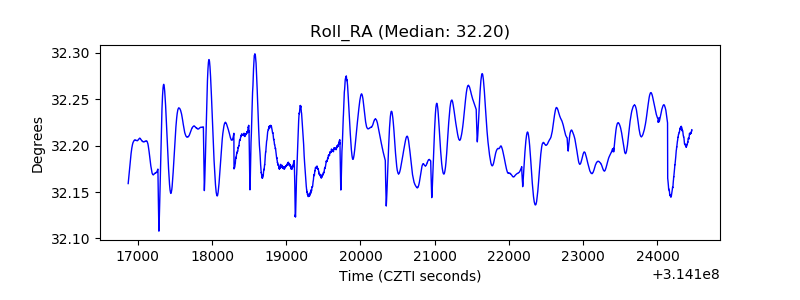 |
| Veto Counter | 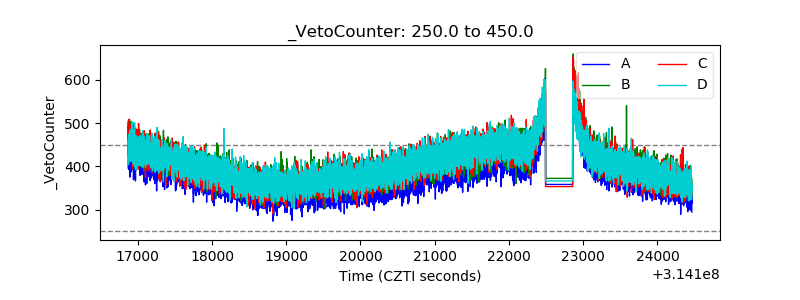 |