| Param | Original file | Final file |
|---|---|---|
| Filename | modeM0/AS1T03_168T01_9000003368_22788cztM0_level2.evt | modeM0/AS1T03_168T01_9000003368_22788cztM0_level2_quad_clean.evt |
| Size (bytes) | 554,607,360 | 146,399,040 |
| Size | 528.9 MB | 139.6 MB |
| Events in quadrant A | 3,569,784 | 1,003,519 |
| Events in quadrant B | 3,767,518 | 1,006,749 |
| Events in quadrant C | 3,618,087 | 962,591 |
| Events in quadrant D | 5,321,089 | 928,513 |
| Mode SS | |||
|---|---|---|---|
| Quadrant | BADHDUFLAG | Total packets | Discarded packets |
| A | 0 | 154 | 0 |
| B | 0 | 154 | 0 |
| C | 0 | 154 | 0 |
| D | 0 | 154 | 0 |
| Mode M9 | |||
|---|---|---|---|
| Quadrant | BADHDUFLAG | Total packets | Discarded packets |
| A | 0 | 3 | 0 |
| B | 0 | 4 | 0 |
| C | 0 | 4 | 0 |
| D | 0 | 4 | 0 |
| Mode M0 | |||
|---|---|---|---|
| Quadrant | BADHDUFLAG | Total packets | Discarded packets |
| A | 0 | 15751 | 2 |
| B | 0 | 16162 | 2 |
| C | 0 | 15917 | 2 |
| D | 0 | 21060 | 3 |
| Quadrant | Total seconds | Saturated seconds | Saturation percentage |
|---|---|---|---|
| A | 7665 | 54 | 0.704501% |
| B | 7665 | 87 | 1.135029% |
| C | 7665 | 109 | 1.422048% |
| D | 7664 | 365 | 4.762526% |
Noise dominated data is calculated using 1-second bins in cleaned event files. If a bin has >2000 counts, and if more than 50% of those come from <1% of pixels, then it is considered to be noise-dominated and hence unusable.
| Quadrant | # 1 sec bins | Bins with >0 counts | Bins with >2000 counts | High rate bins dominated by noise | Noise dominated (total time) | Noise dominated (detector-on time) | Marked lightcurve |
|---|---|---|---|---|---|---|---|
| A | 7885 | 7666 | 0 | 0 | 0.00% | 0.00% | 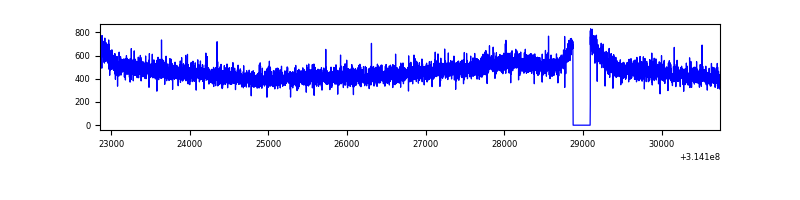 |
| B | 7885 | 7666 | 5 | 5 | 0.06% | 0.07% | 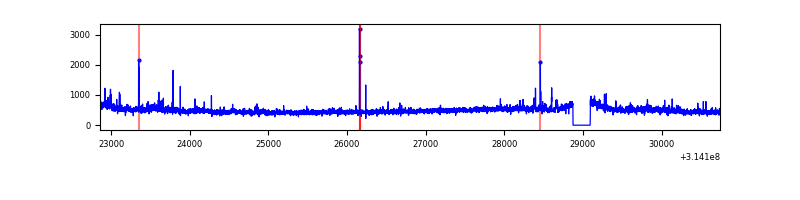 |
| C | 7885 | 7666 | 10 | 10 | 0.13% | 0.13% |  |
| D | 7884 | 7665 | 260 | 260 | 3.30% | 3.39% | 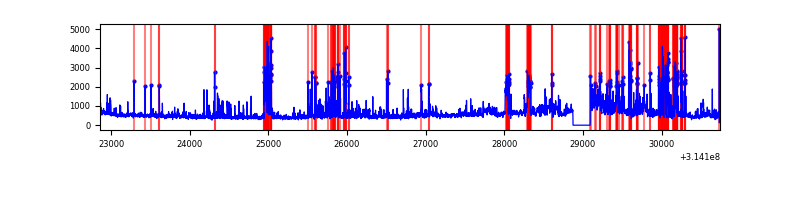 |
Top three noisy pixels from each quadrant. If the there are fewer than three noisy pixels in the level2.evt file, extra rows are filled as -1
| Pixel properties | Quadrant properties | ||||||
|---|---|---|---|---|---|---|---|
| Quadrant | DetID | PixID | Counts | Sigma | Mean | Median | Sigma |
| A | 13 | 254 | 14959 | 74.97 | 925 | 906 | 187.4 |
| A | 0 | 226 | 8113 | 38.45 | 925 | 906 | 187.4 |
| A | 3 | 137 | 7608 | 35.75 | 925 | 906 | 187.4 |
| B | 0 | 230 | 66865 | 381.17 | 919 | 897 | 173.1 |
| B | 0 | 245 | 32115 | 180.38 | 919 | 897 | 173.1 |
| B | 0 | 228 | 20980 | 116.04 | 919 | 897 | 173.1 |
| C | 14 | 238 | 139974 | 677.16 | 875 | 879 | 205.4 |
| C | 10 | 22 | 60671 | 291.09 | 875 | 879 | 205.4 |
| C | 2 | 16 | 8549 | 37.34 | 875 | 879 | 205.4 |
| D | 1 | 52 | 1628896 | 7492.95 | 878 | 848 | 217.3 |
| D | 2 | 152 | 229955 | 1054.45 | 878 | 848 | 217.3 |
| D | 14 | 50 | 54484 | 246.86 | 878 | 848 | 217.3 |
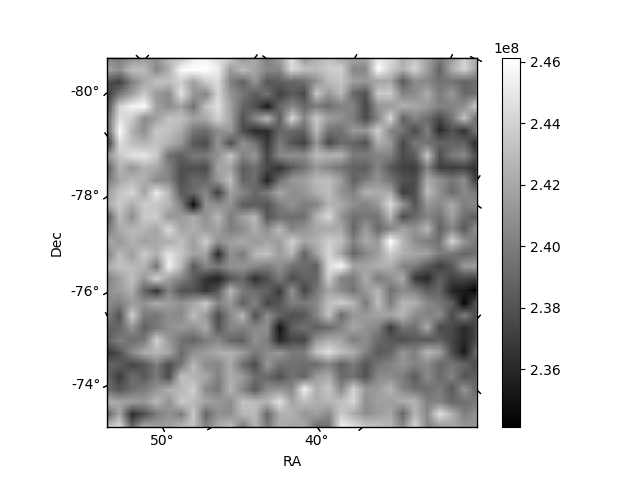
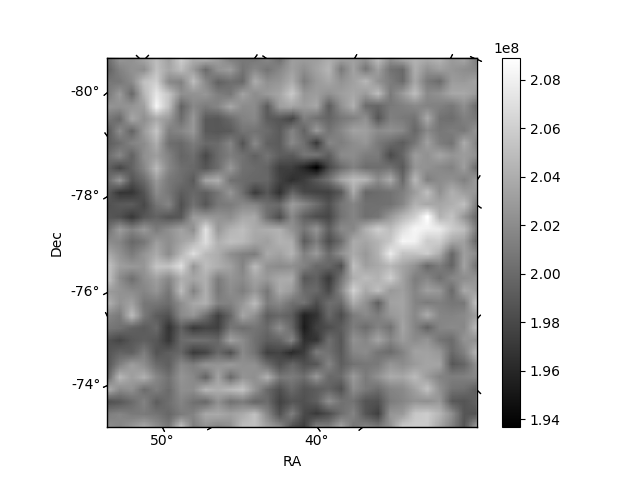
Histogram calculated using DETX and DETY for each event in the final _common_clean file
| Quadrant A |  |
 |
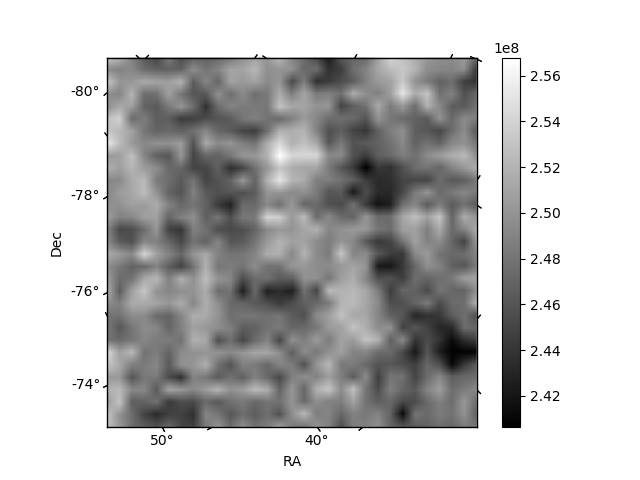
Quadrant B |
|---|---|---|---|
| Quadrant D | 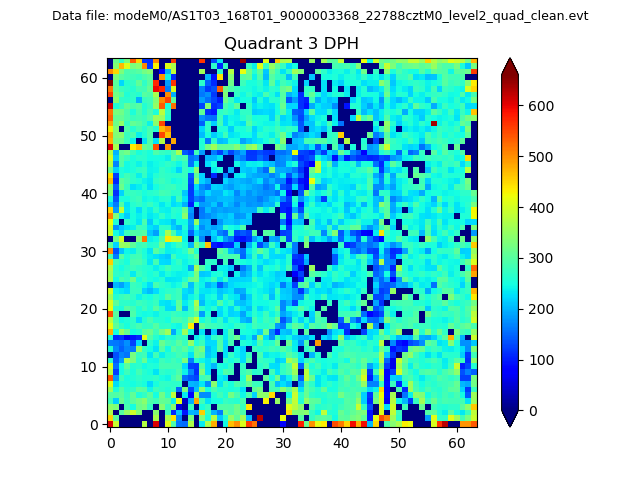 |
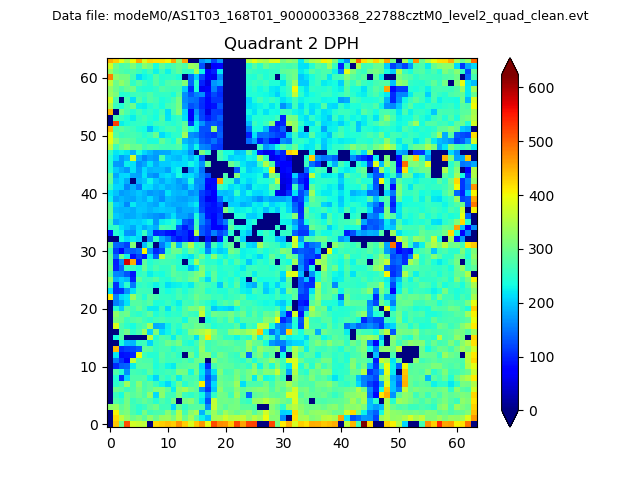 |
Quadrant C |
| Plot type | Count rate plots | Images |
|---|---|---|
| Comparison with Poisson distribution Blue bars denote a histogram of data divided into 1 sec bins. Red curve is a Poisson curve with rate = median count rate of data. |
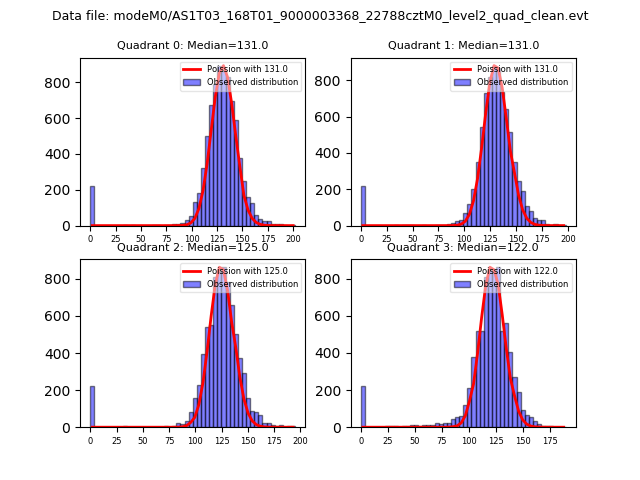 |
 |
| Quadrant-wise count rates Data is divided into 100 sec bins |
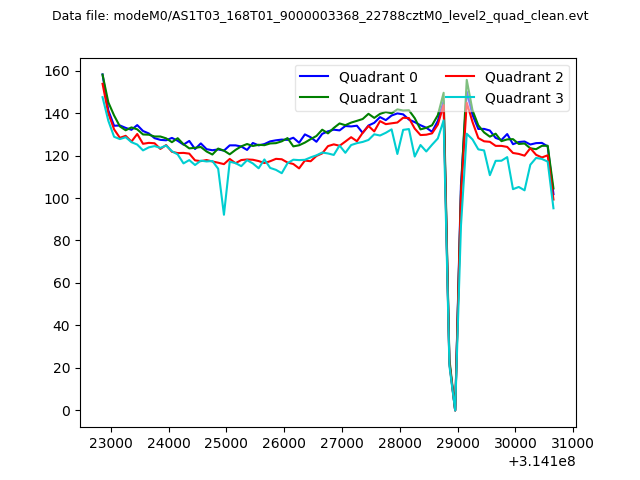 |
|
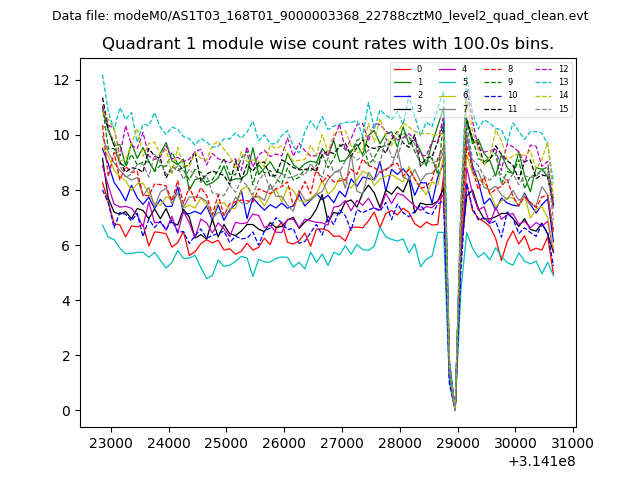
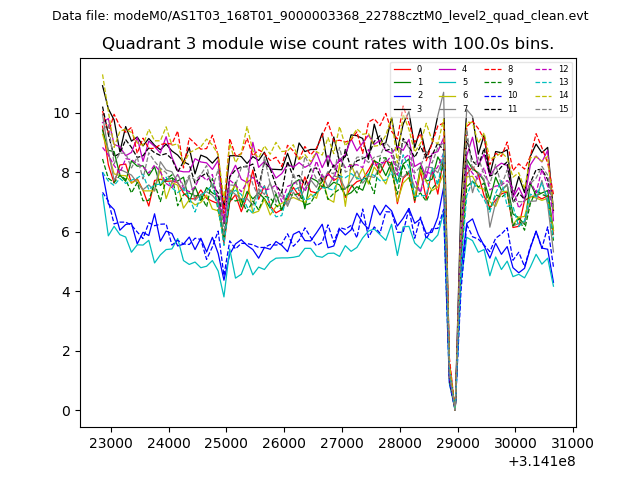
| Module-wise count rates for Quadrant A Data is divided into 100 sec bins |
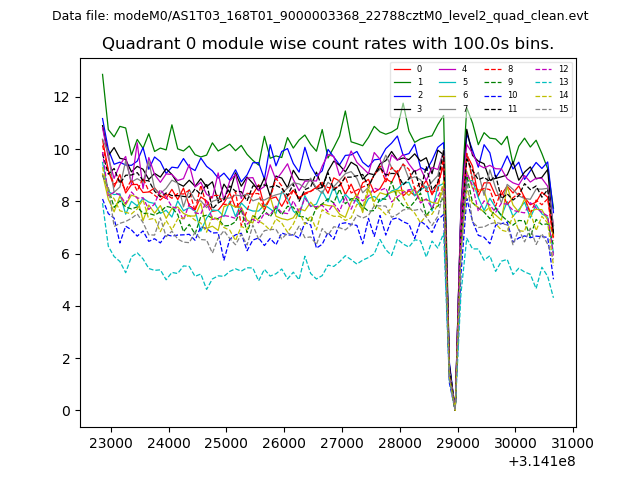 |
 |
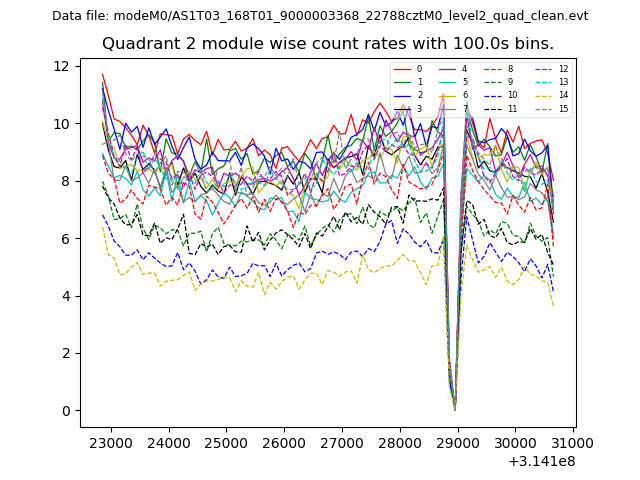
| Module-wise count rates for Quadrant B Data is divided into 100 sec bins |
 |
 |
| Module-wise count rates for Quadrant C Data is divided into 100 sec bins |
 |
 |
| Module-wise count rates for Quadrant D Data is divided into 100 sec bins |
 |
 |
| Parameter | Plot |
|---|---|
| CZT HV Monitor | 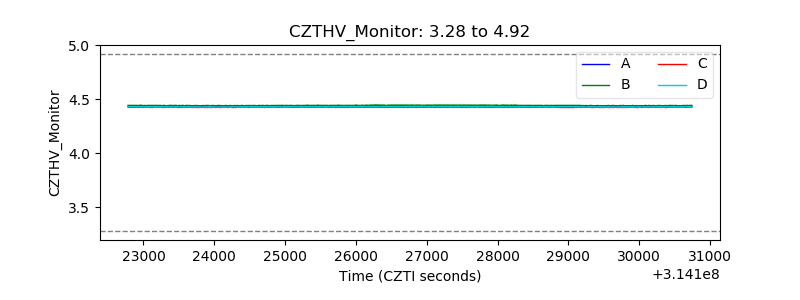 |
| D_VDD | 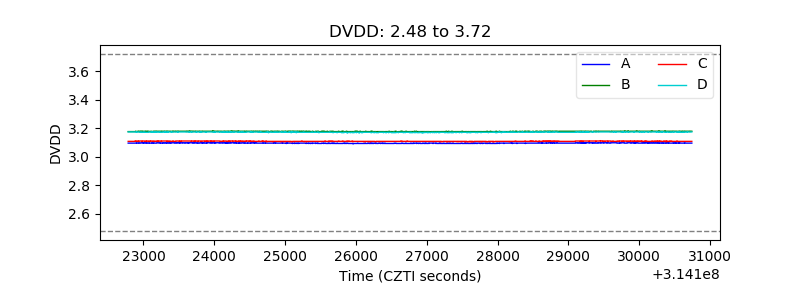 |
| Temperature 1 | 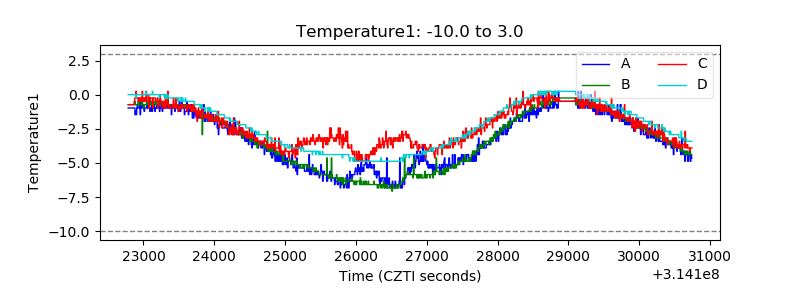 |
| Veto HV Monitor | 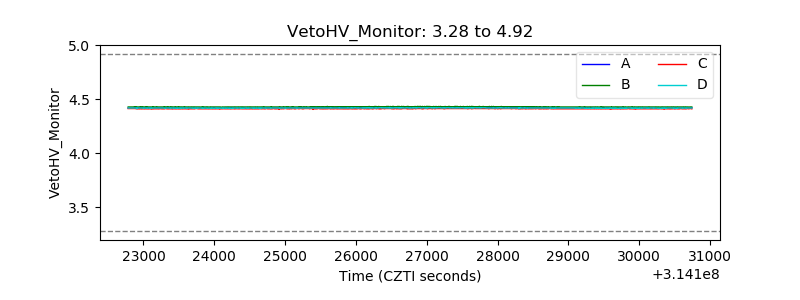 |
| Veto LLD | 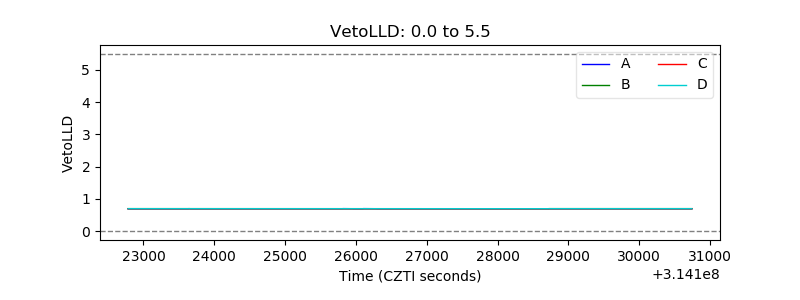 |
| Alpha Counter | 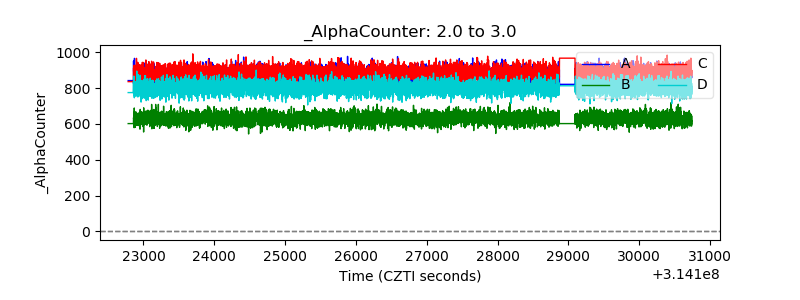 |
| _CPM_Rate | 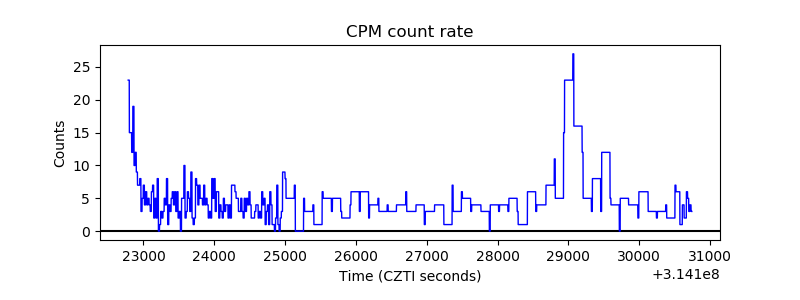 |
| CZT Counter | 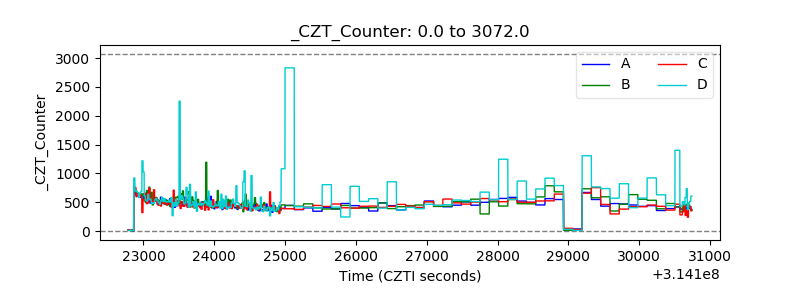 |
| +2.5 Volts monitor |  |
| +5 Volts monitor |  |
| _ROLL_ROT | 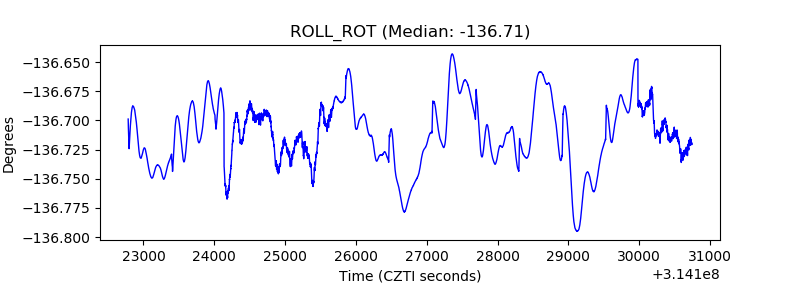 |
| _Roll_DEC | 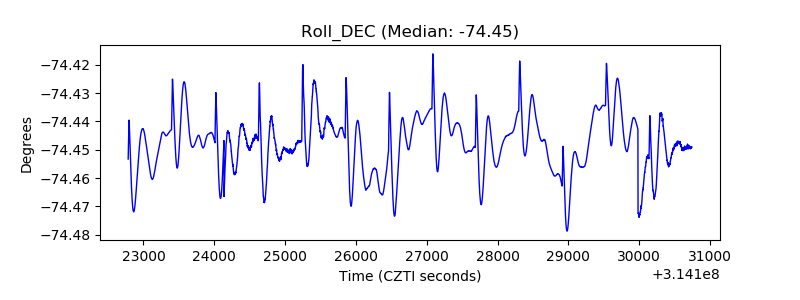 |
| _Roll_RA | 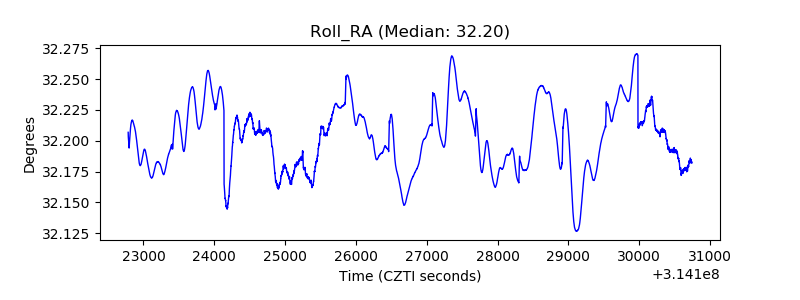 |
| Veto Counter | 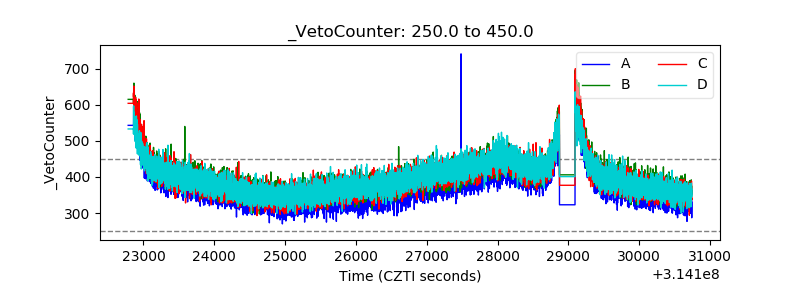 |