| Param | Original file | Final file |
|---|---|---|
| Filename | modeM0/AS1T03_168T01_9000003368_22791cztM0_level2.evt | modeM0/AS1T03_168T01_9000003368_22791cztM0_level2_quad_clean.evt |
| Size (bytes) | 866,871,360 | 241,796,160 |
| Size | 826.7 MB | 230.6 MB |
| Events in quadrant A | 5,904,988 | 1,651,097 |
| Events in quadrant B | 6,179,536 | 1,663,141 |
| Events in quadrant C | 6,122,419 | 1,575,351 |
| Events in quadrant D | 7,172,323 | 1,542,973 |
| Mode SS | |||
|---|---|---|---|
| Quadrant | BADHDUFLAG | Total packets | Discarded packets |
| A | 0 | 260 | 0 |
| B | 0 | 260 | 0 |
| C | 0 | 260 | 0 |
| D | 0 | 260 | 0 |
| Mode M9 | |||
|---|---|---|---|
| Quadrant | BADHDUFLAG | Total packets | Discarded packets |
| A | 0 | 14 | 0 |
| B | 0 | 14 | 0 |
| C | 0 | 14 | 0 |
| D | 0 | 14 | 0 |
| Mode M0 | |||
|---|---|---|---|
| Quadrant | BADHDUFLAG | Total packets | Discarded packets |
| A | 0 | 26223 | 2 |
| B | 0 | 26808 | 2 |
| C | 0 | 26664 | 2 |
| D | 0 | 30435 | 2 |
| Quadrant | Total seconds | Saturated seconds | Saturation percentage |
|---|---|---|---|
| A | 12910 | 68 | 0.526723% |
| B | 12911 | 92 | 0.712571% |
| C | 12911 | 142 | 1.099837% |
| D | 12911 | 255 | 1.975060% |
Noise dominated data is calculated using 1-second bins in cleaned event files. If a bin has >2000 counts, and if more than 50% of those come from <1% of pixels, then it is considered to be noise-dominated and hence unusable.
| Quadrant | # 1 sec bins | Bins with >0 counts | Bins with >2000 counts | High rate bins dominated by noise | Noise dominated (total time) | Noise dominated (detector-on time) | Marked lightcurve |
|---|---|---|---|---|---|---|---|
| A | 14200 | 12912 | 3 | 3 | 0.02% | 0.02% | 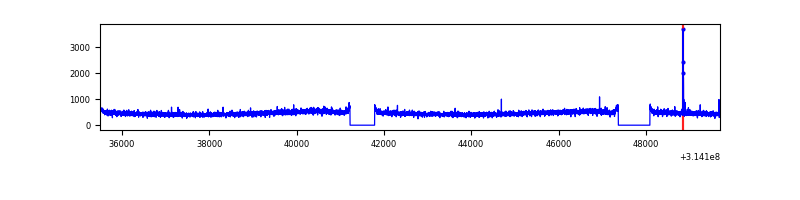 |
| B | 14201 | 12913 | 11 | 11 | 0.08% | 0.09% | 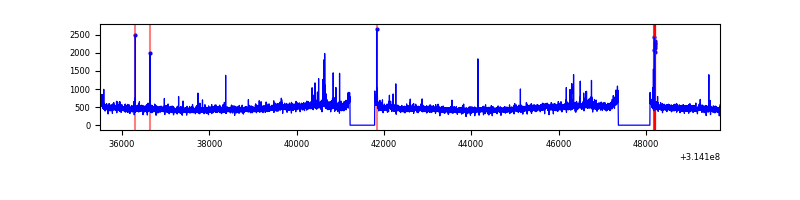 |
| C | 14201 | 12913 | 37 | 37 | 0.26% | 0.29% | 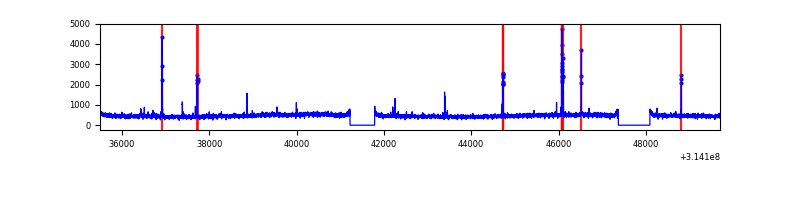 |
| D | 14201 | 12913 | 166 | 166 | 1.17% | 1.29% | 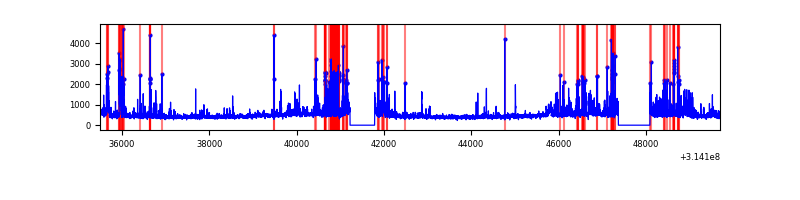 |
Top three noisy pixels from each quadrant. If the there are fewer than three noisy pixels in the level2.evt file, extra rows are filled as -1
| Pixel properties | Quadrant properties | ||||||
|---|---|---|---|---|---|---|---|
| Quadrant | DetID | PixID | Counts | Sigma | Mean | Median | Sigma |
| A | 13 | 254 | 25157 | 76.86 | 1525 | 1491 | 307.9 |
| A | 15 | 174 | 23583 | 71.75 | 1525 | 1491 | 307.9 |
| A | 0 | 226 | 13095 | 37.69 | 1525 | 1491 | 307.9 |
| B | 0 | 228 | 67340 | 230.5 | 1522 | 1485 | 285.7 |
| B | 0 | 230 | 66995 | 229.29 | 1522 | 1485 | 285.7 |
| B | 0 | 190 | 36803 | 123.62 | 1522 | 1485 | 285.7 |
| C | 14 | 238 | 228993 | 675.15 | 1451 | 1460 | 337.0 |
| C | 10 | 22 | 185730 | 546.78 | 1451 | 1460 | 337.0 |
| C | 8 | 222 | 25308 | 70.76 | 1451 | 1460 | 337.0 |
| D | 1 | 52 | 1074450 | 3007.62 | 1466 | 1421 | 356.8 |
| D | 5 | 222 | 156277 | 434.05 | 1466 | 1421 | 356.8 |
| D | 1 | 239 | 153189 | 425.39 | 1466 | 1421 | 356.8 |
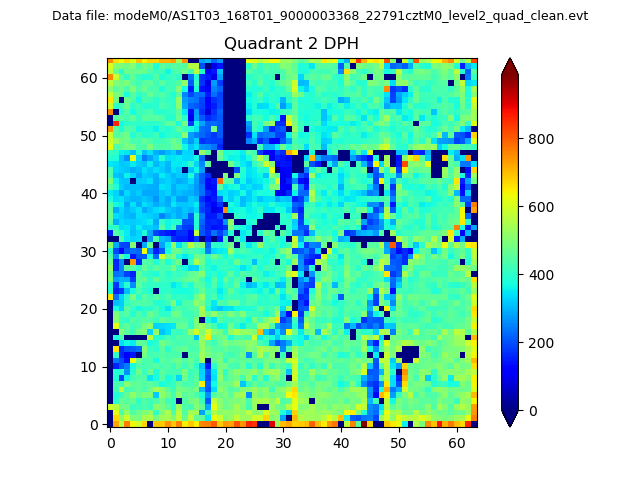
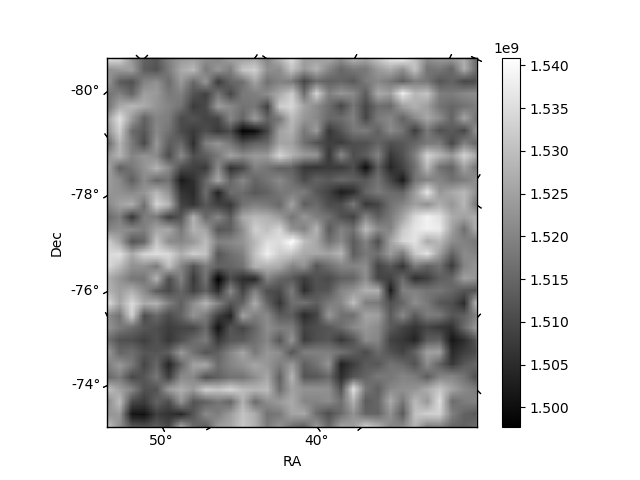
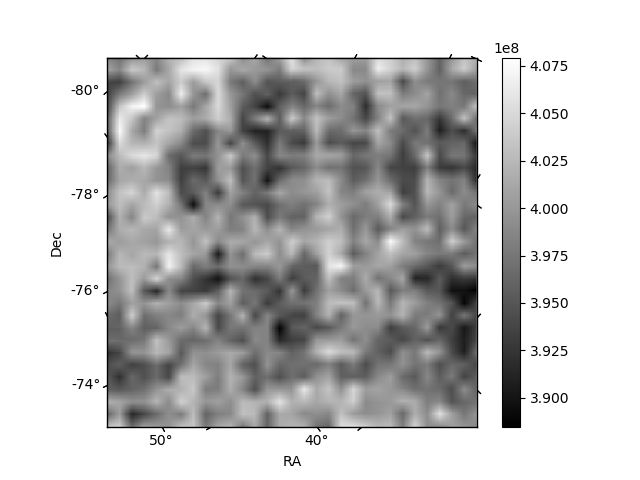
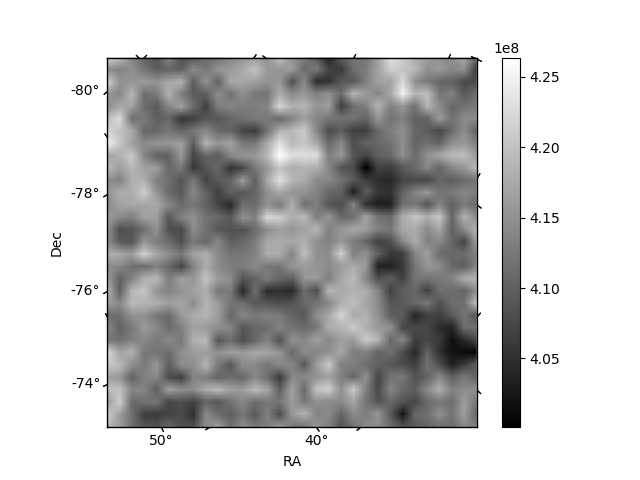
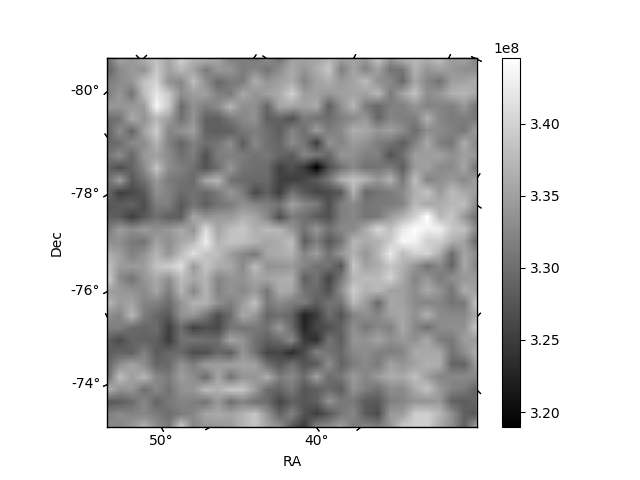
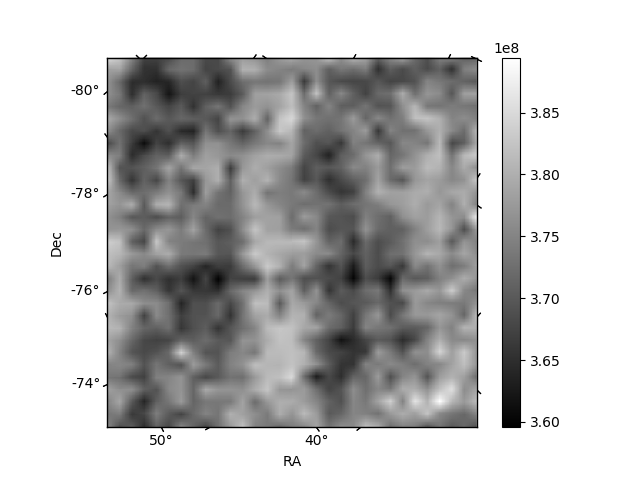
Histogram calculated using DETX and DETY for each event in the final _common_clean file
| Quadrant A | 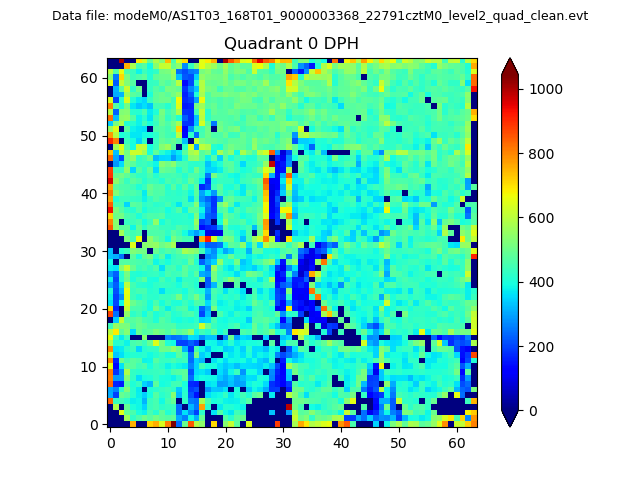 |
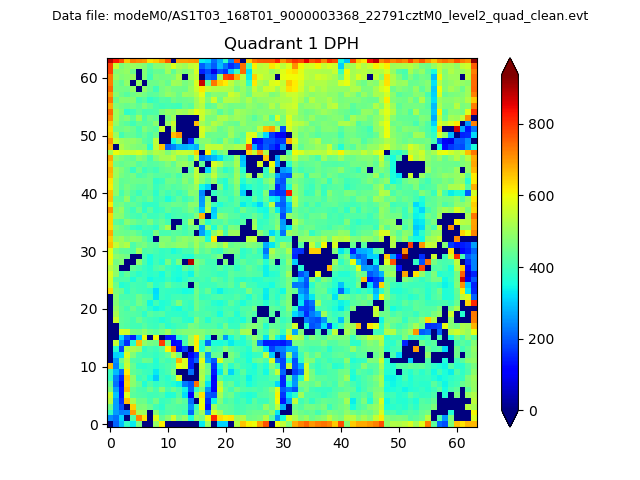 |
Quadrant B |
|---|---|---|---|
| Quadrant D | 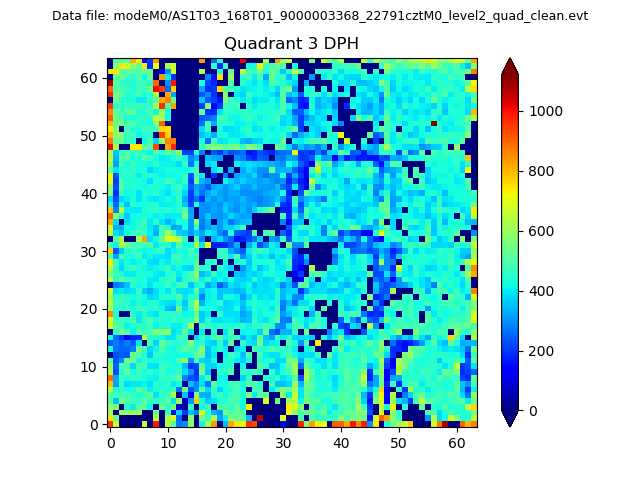 |
 |
Quadrant C |
| Plot type | Count rate plots | Images |
|---|---|---|
| Comparison with Poisson distribution Blue bars denote a histogram of data divided into 1 sec bins. Red curve is a Poisson curve with rate = median count rate of data. |
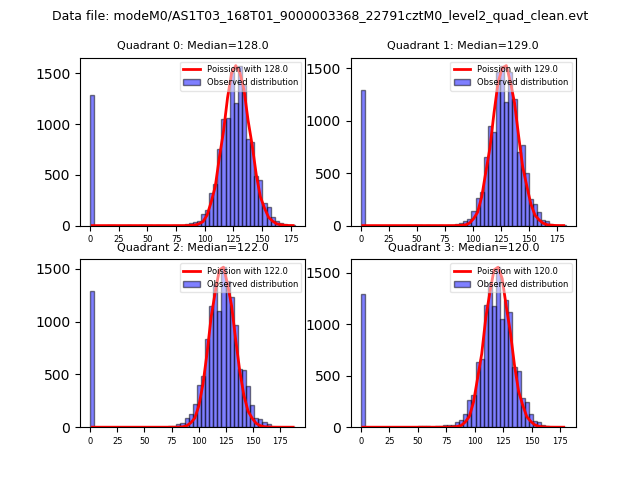 |
 |
| Quadrant-wise count rates Data is divided into 100 sec bins |
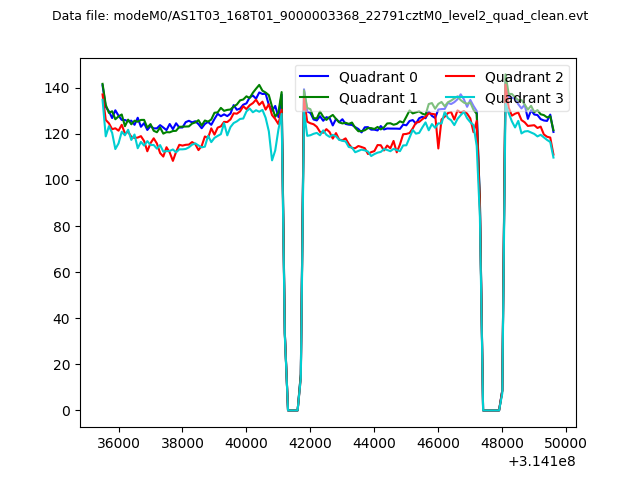 |
|
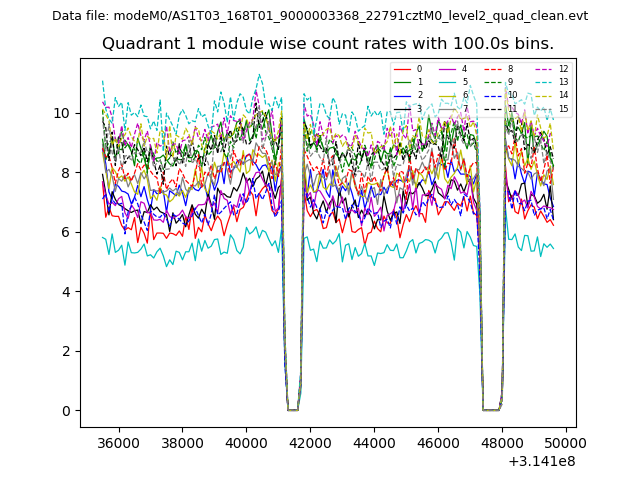
| Module-wise count rates for Quadrant A Data is divided into 100 sec bins |
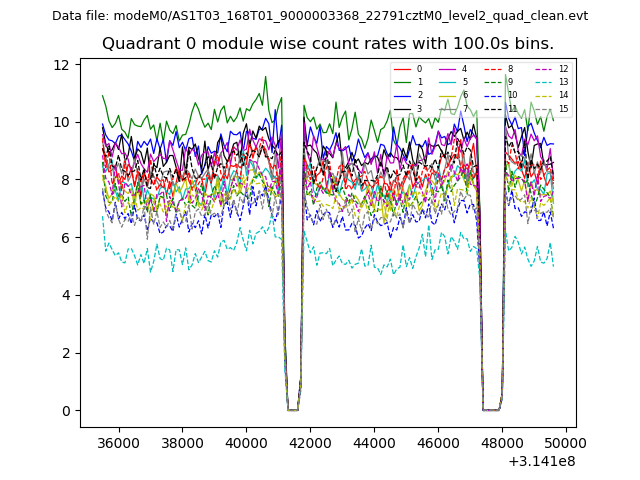 |
 |
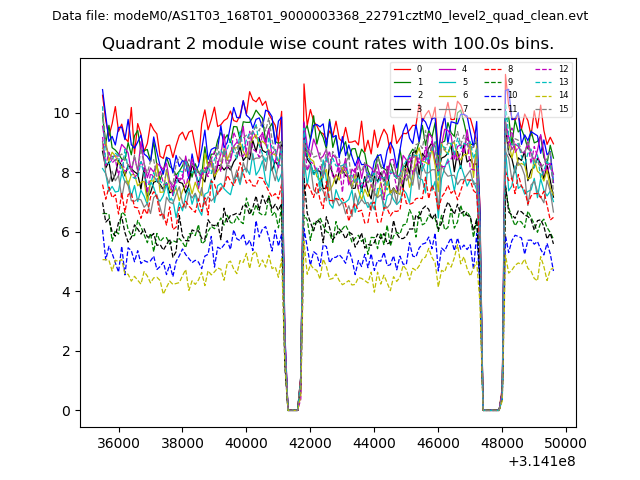
| Module-wise count rates for Quadrant B Data is divided into 100 sec bins |
 |
 |
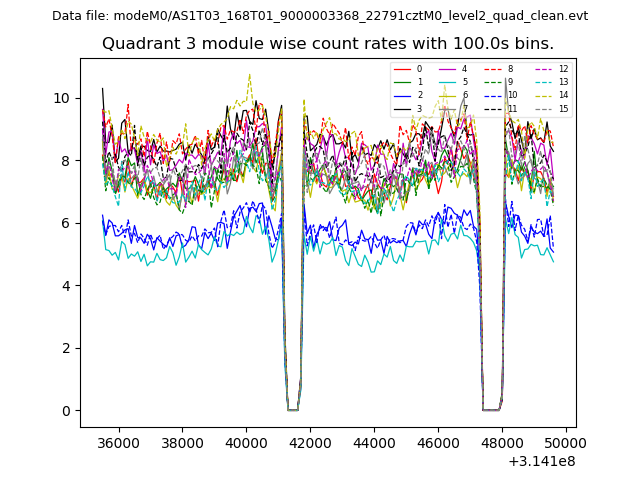
| Module-wise count rates for Quadrant C Data is divided into 100 sec bins |
 |
 |
| Module-wise count rates for Quadrant D Data is divided into 100 sec bins |
 |
 |
| Parameter | Plot |
|---|---|
| CZT HV Monitor | 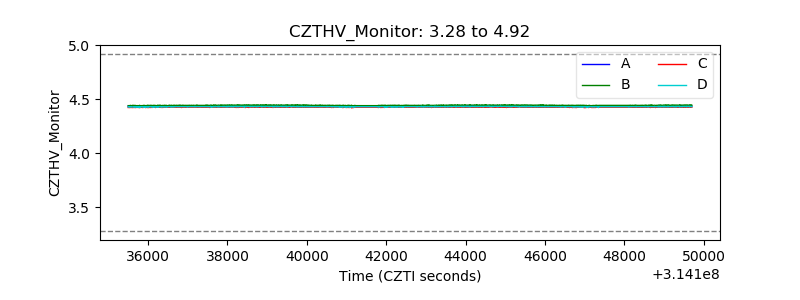 |
| D_VDD | 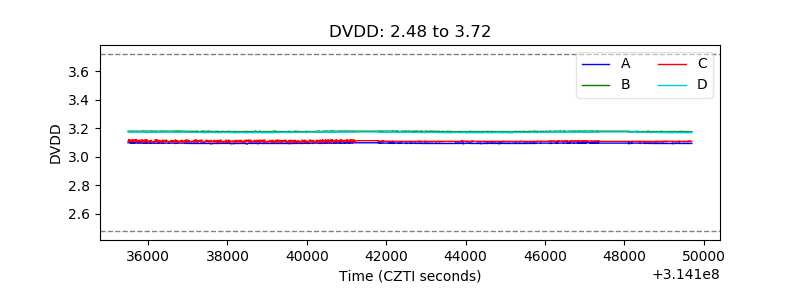 |
| Temperature 1 | 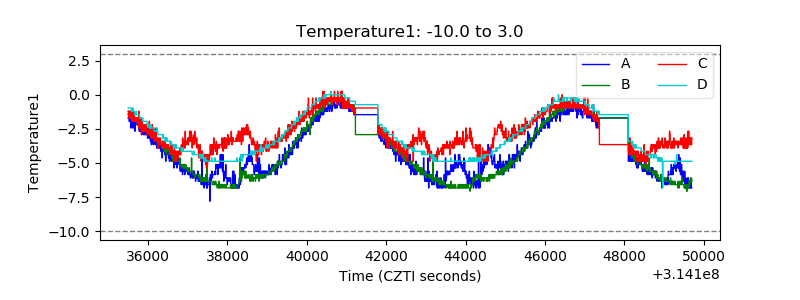 |
| Veto HV Monitor | 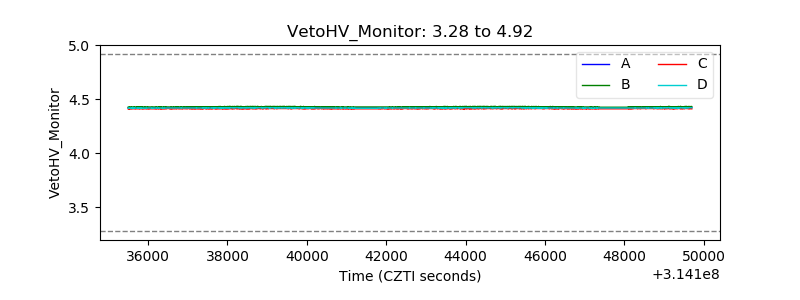 |
| Veto LLD | 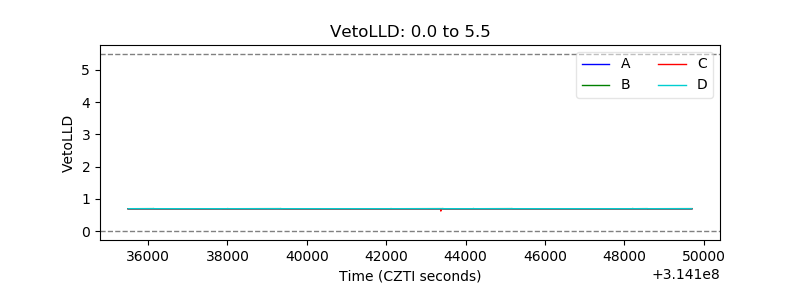 |
| Alpha Counter | 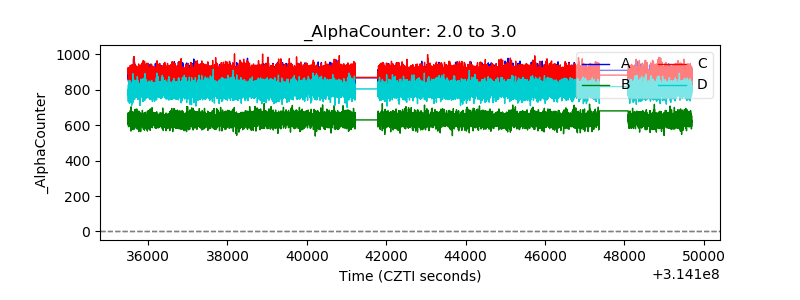 |
| _CPM_Rate | 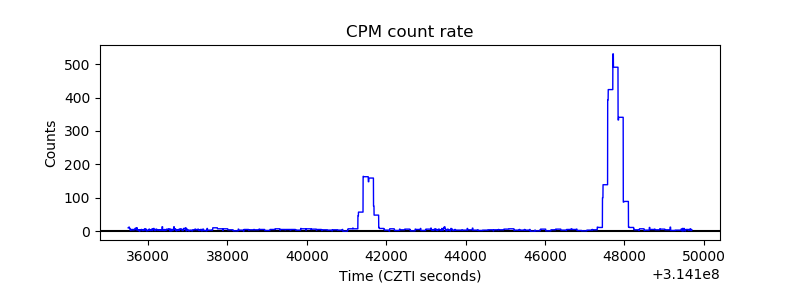 |
| CZT Counter | 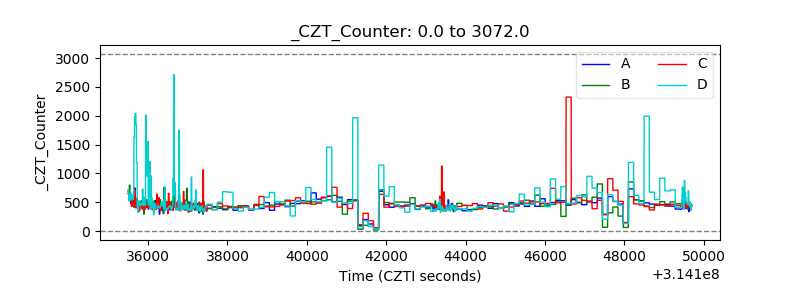 |
| +2.5 Volts monitor |  |
| +5 Volts monitor |  |
| _ROLL_ROT | 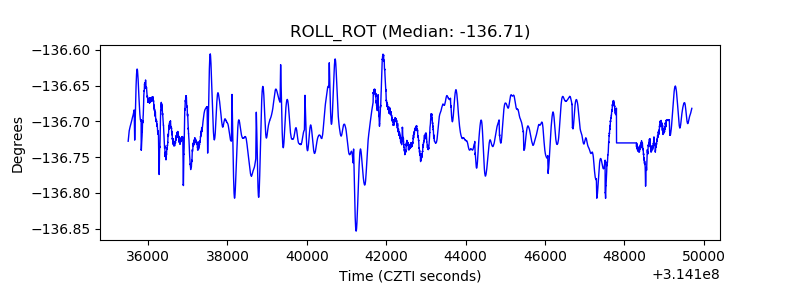 |
| _Roll_DEC | 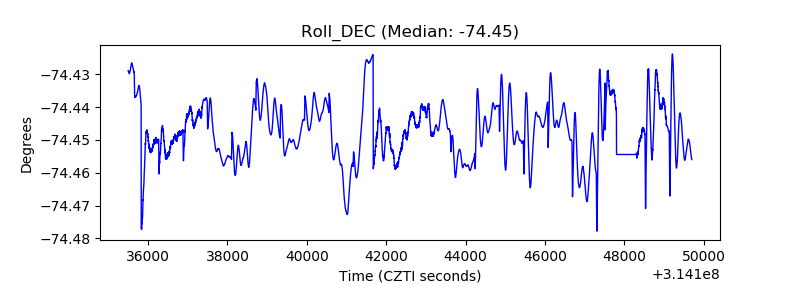 |
| _Roll_RA | 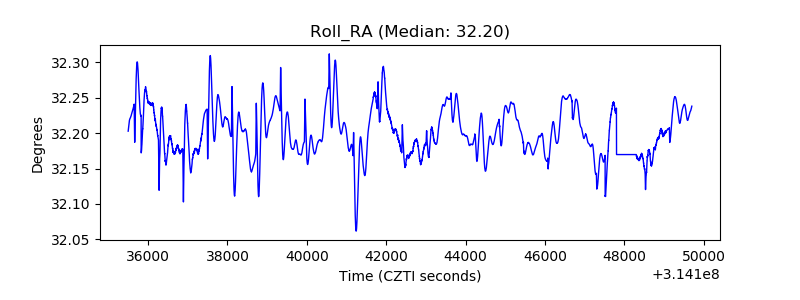 |
| Veto Counter | 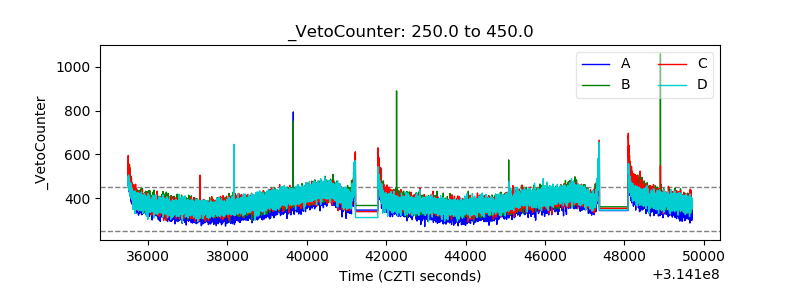 |