| Param | Original file | Final file |
|---|---|---|
| Filename | modeM0/AS1T03_168T01_9000003368_22792cztM0_level2.evt | modeM0/AS1T03_168T01_9000003368_22792cztM0_level2_quad_clean.evt |
| Size (bytes) | 463,559,040 | 131,999,040 |
| Size | 442.1 MB | 125.9 MB |
| Events in quadrant A | 3,191,546 | 897,639 |
| Events in quadrant B | 3,324,103 | 911,260 |
| Events in quadrant C | 3,245,355 | 865,623 |
| Events in quadrant D | 3,811,930 | 845,763 |
| Mode SS | |||
|---|---|---|---|
| Quadrant | BADHDUFLAG | Total packets | Discarded packets |
| A | 0 | 138 | 0 |
| B | 0 | 138 | 0 |
| C | 0 | 138 | 0 |
| D | 0 | 138 | 0 |
| Mode M9 | |||
|---|---|---|---|
| Quadrant | BADHDUFLAG | Total packets | Discarded packets |
| A | 0 | 17 | 0 |
| B | 0 | 18 | 0 |
| C | 0 | 18 | 0 |
| D | 0 | 18 | 0 |
| Mode M0 | |||
|---|---|---|---|
| Quadrant | BADHDUFLAG | Total packets | Discarded packets |
| A | 0 | 13970 | 3 |
| B | 0 | 14203 | 2 |
| C | 0 | 14003 | 2 |
| D | 0 | 15933 | 2 |
| Quadrant | Total seconds | Saturated seconds | Saturation percentage |
|---|---|---|---|
| A | 6868 | 34 | 0.495050% |
| B | 6868 | 44 | 0.640652% |
| C | 6868 | 71 | 1.033780% |
| D | 6868 | 80 | 1.164822% |
Noise dominated data is calculated using 1-second bins in cleaned event files. If a bin has >2000 counts, and if more than 50% of those come from <1% of pixels, then it is considered to be noise-dominated and hence unusable.
| Quadrant | # 1 sec bins | Bins with >0 counts | Bins with >2000 counts | High rate bins dominated by noise | Noise dominated (total time) | Noise dominated (detector-on time) | Marked lightcurve |
|---|---|---|---|---|---|---|---|
| A | 7778 | 6869 | 3 | 3 | 0.04% | 0.04% | 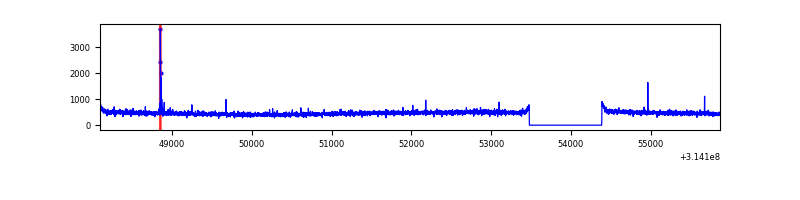 |
| B | 7778 | 6869 | 10 | 10 | 0.13% | 0.15% | 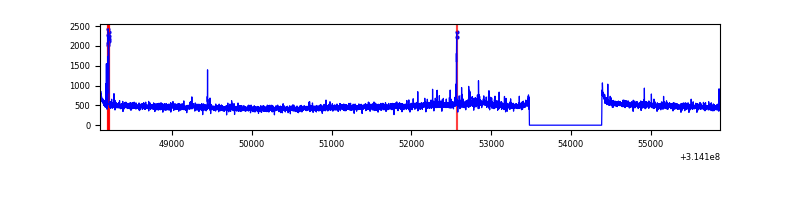 |
| C | 7778 | 6869 | 5 | 5 | 0.06% | 0.07% | 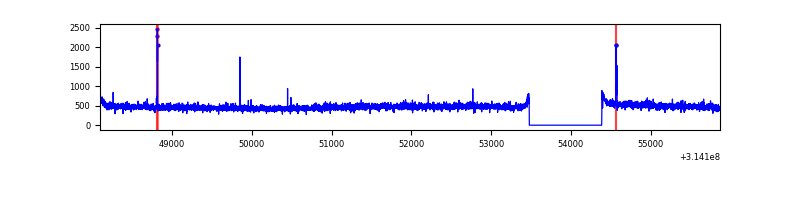 |
| D | 7778 | 6869 | 49 | 49 | 0.63% | 0.71% | 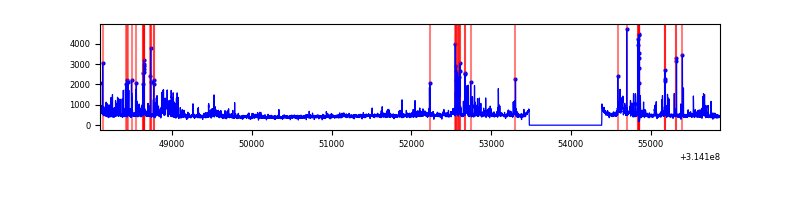 |
Top three noisy pixels from each quadrant. If the there are fewer than three noisy pixels in the level2.evt file, extra rows are filled as -1
| Pixel properties | Quadrant properties | ||||||
|---|---|---|---|---|---|---|---|
| Quadrant | DetID | PixID | Counts | Sigma | Mean | Median | Sigma |
| A | 15 | 174 | 22777 | 133.92 | 820 | 805 | 164.1 |
| A | 13 | 254 | 12471 | 71.1 | 820 | 805 | 164.1 |
| A | 0 | 226 | 7058 | 38.11 | 820 | 805 | 164.1 |
| B | 0 | 228 | 53012 | 335.56 | 823 | 805 | 155.6 |
| B | 12 | 16 | 22259 | 137.89 | 823 | 805 | 155.6 |
| B | 12 | 111 | 18430 | 113.28 | 823 | 805 | 155.6 |
| C | 14 | 238 | 127691 | 693.12 | 790 | 795 | 183.1 |
| C | 10 | 22 | 27782 | 147.41 | 790 | 795 | 183.1 |
| C | 13 | 61 | 5530 | 25.86 | 790 | 795 | 183.1 |
| D | 1 | 52 | 581295 | 3044.36 | 793 | 770 | 190.7 |
| D | 1 | 239 | 75675 | 392.81 | 793 | 770 | 190.7 |
| D | 2 | 152 | 35584 | 182.57 | 793 | 770 | 190.7 |
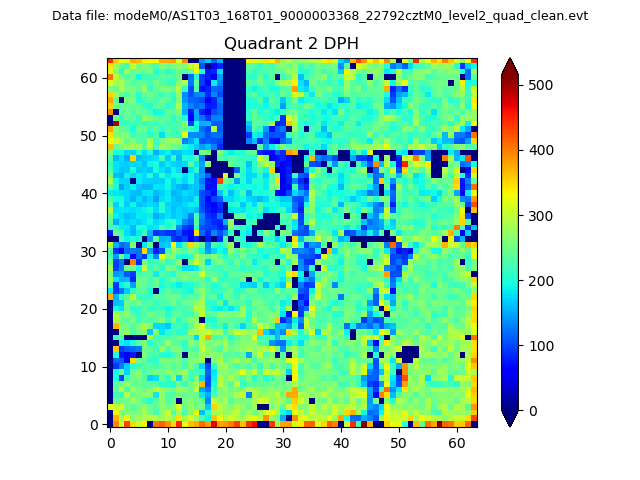
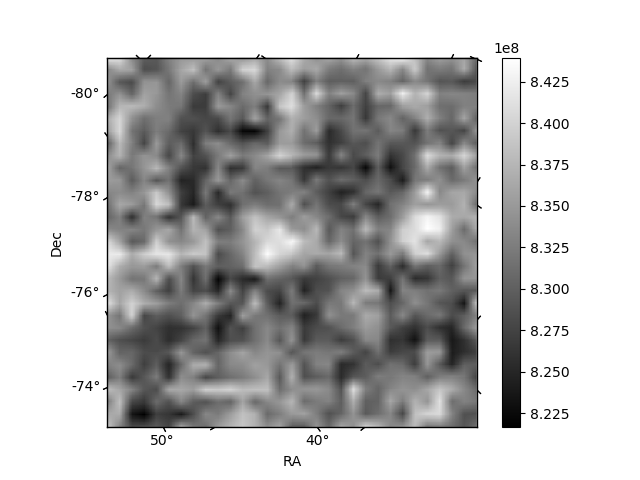
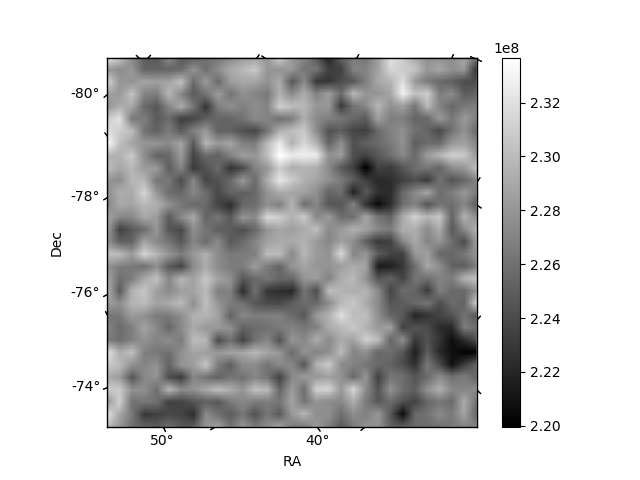
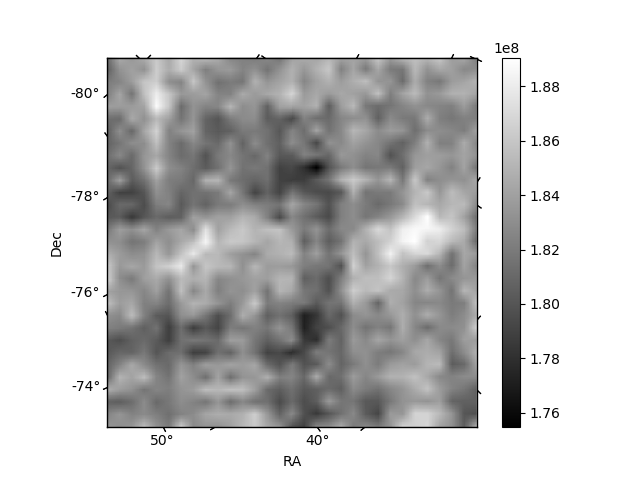
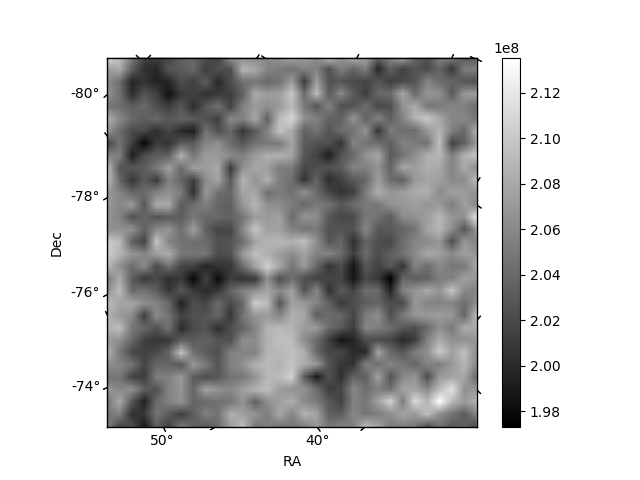
Histogram calculated using DETX and DETY for each event in the final _common_clean file
| Quadrant A | 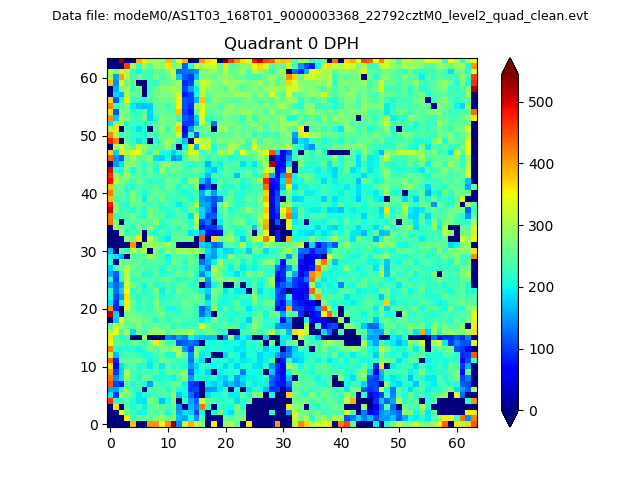 |
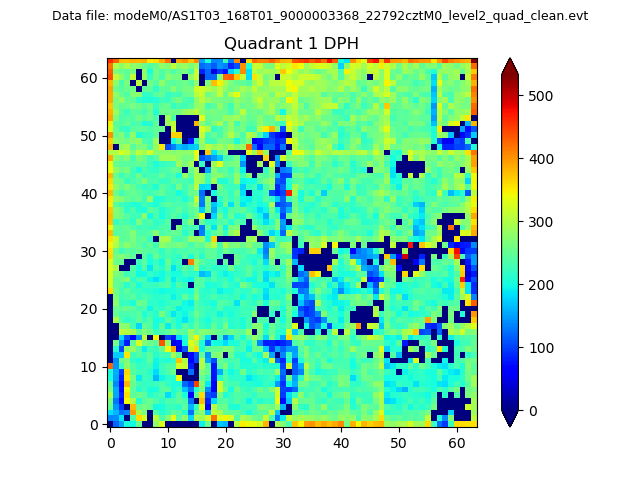 |
Quadrant B |
|---|---|---|---|
| Quadrant D | 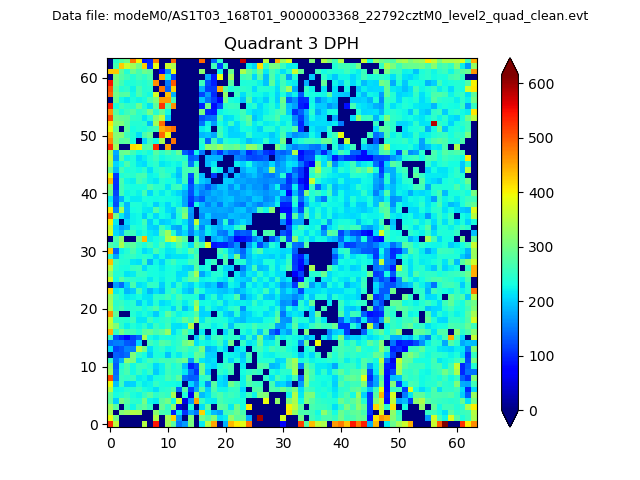 |
 |
Quadrant C |
| Plot type | Count rate plots | Images |
|---|---|---|
| Comparison with Poisson distribution Blue bars denote a histogram of data divided into 1 sec bins. Red curve is a Poisson curve with rate = median count rate of data. |
 |
 |
| Quadrant-wise count rates Data is divided into 100 sec bins |
 |
|
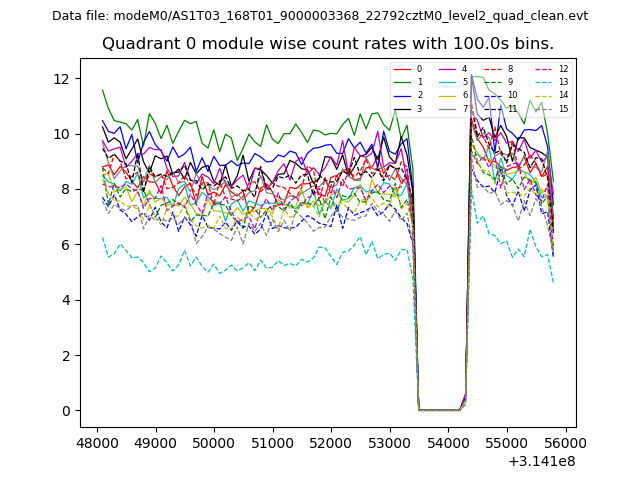
| Module-wise count rates for Quadrant A Data is divided into 100 sec bins |
 |
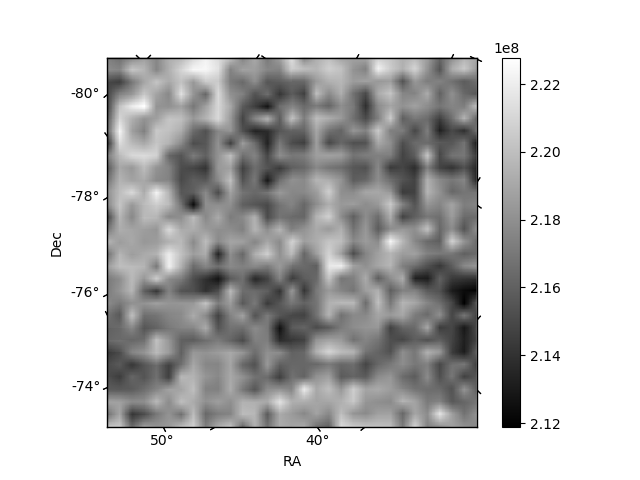 |
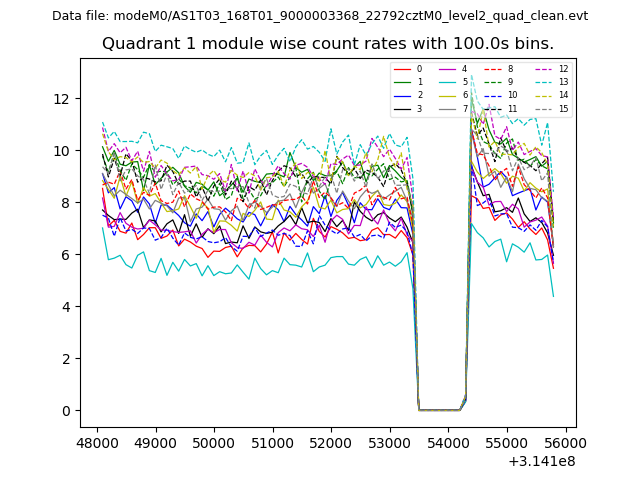
| Module-wise count rates for Quadrant B Data is divided into 100 sec bins |
 |
 |
| Module-wise count rates for Quadrant C Data is divided into 100 sec bins |
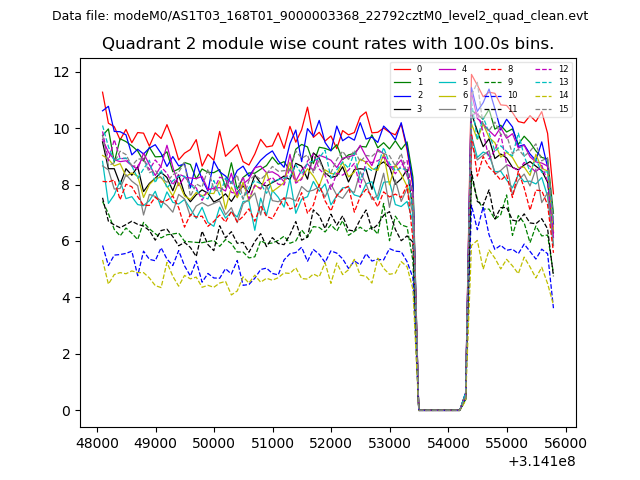 |
 |
| Module-wise count rates for Quadrant D Data is divided into 100 sec bins |
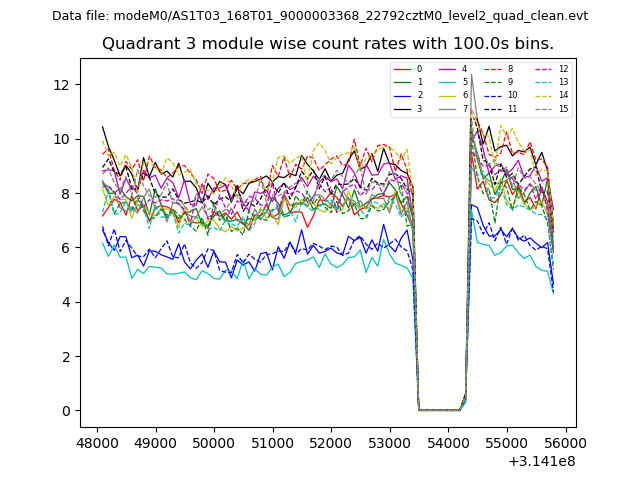 |
 |
| Parameter | Plot |
|---|---|
| CZT HV Monitor | 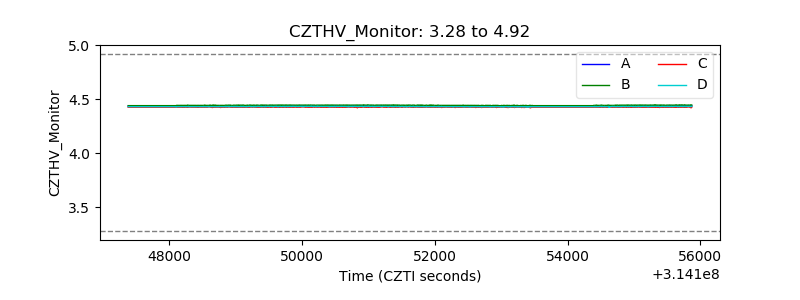 |
| D_VDD | 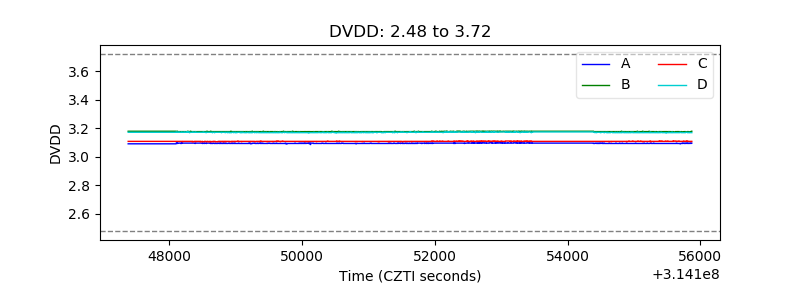 |
| Temperature 1 | 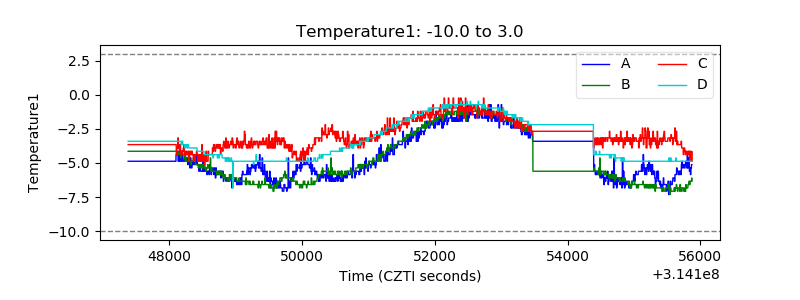 |
| Veto HV Monitor | 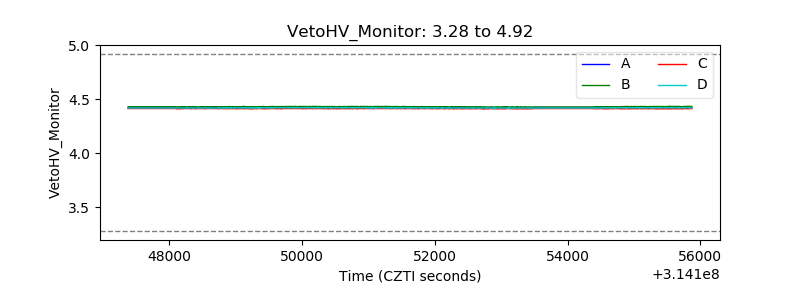 |
| Veto LLD | 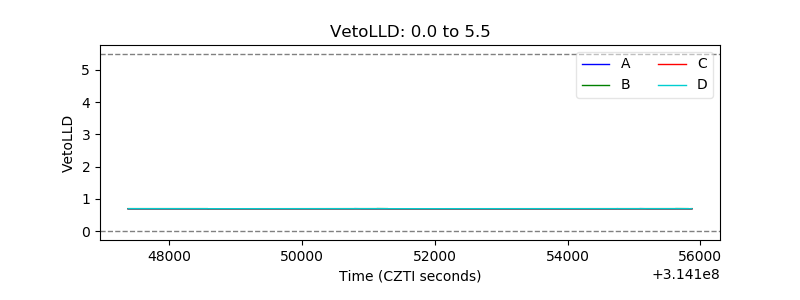 |
| Alpha Counter | 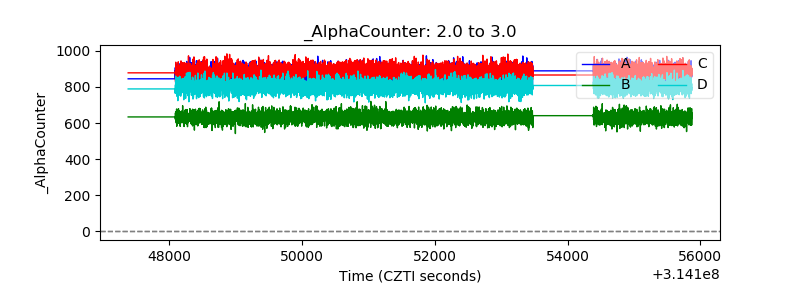 |
| _CPM_Rate | 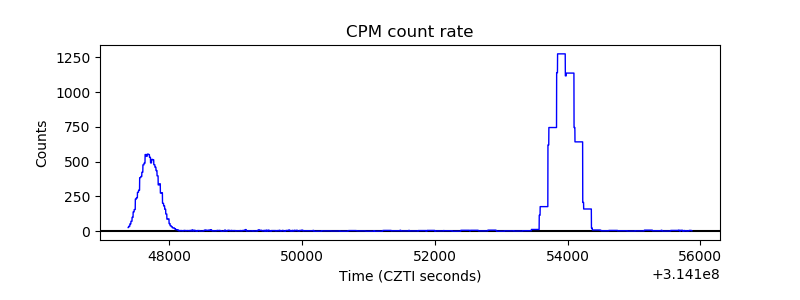 |
| CZT Counter | 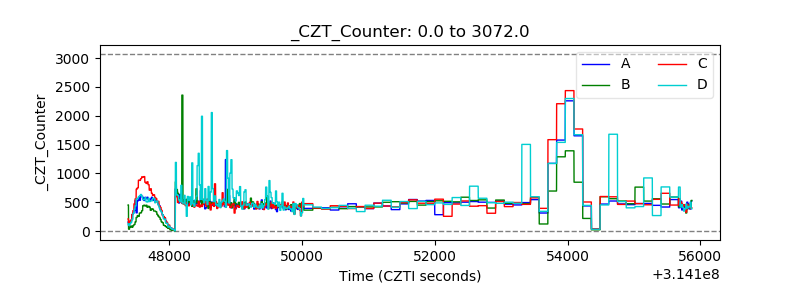 |
| +2.5 Volts monitor |  |
| +5 Volts monitor |  |
| _ROLL_ROT | 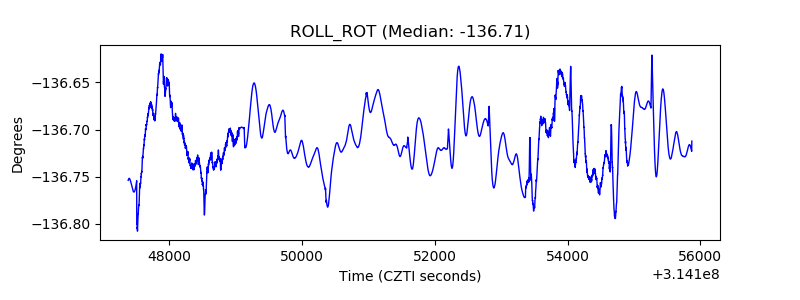 |
| _Roll_DEC | 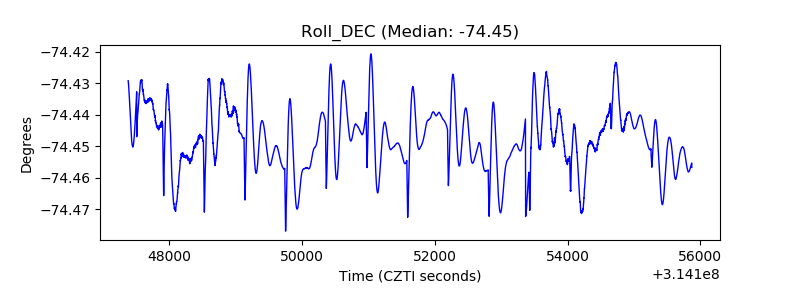 |
| _Roll_RA | 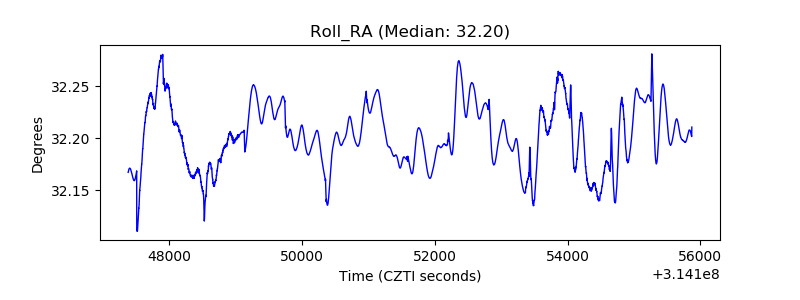 |
| Veto Counter | 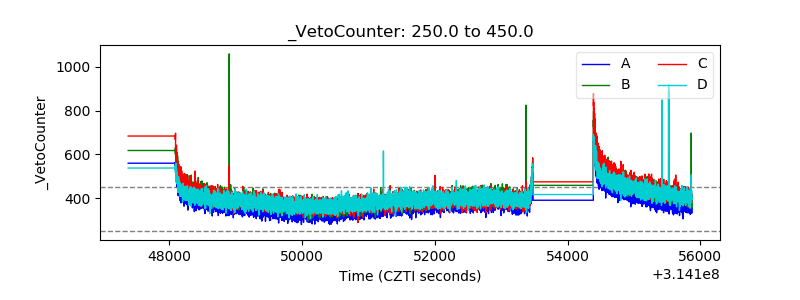 |