| Param | Original file | Final file |
|---|---|---|
| Filename | modeM0/AS1T03_168T01_9000003368_22795cztM0_level2.evt | modeM0/AS1T03_168T01_9000003368_22795cztM0_level2_quad_clean.evt |
| Size (bytes) | 517,559,040 | 137,263,680 |
| Size | 493.6 MB | 130.9 MB |
| Events in quadrant A | 3,191,592 | 949,235 |
| Events in quadrant B | 3,292,754 | 966,393 |
| Events in quadrant C | 3,286,117 | 926,127 |
| Events in quadrant D | 5,472,991 | 872,479 |
| Mode SS | |||
|---|---|---|---|
| Quadrant | BADHDUFLAG | Total packets | Discarded packets |
| A | 0 | 128 | 0 |
| B | 0 | 128 | 0 |
| C | 0 | 128 | 0 |
| D | 0 | 128 | 0 |
| Mode M9 | |||
|---|---|---|---|
| Quadrant | BADHDUFLAG | Total packets | Discarded packets |
| A | 0 | 20 | 0 |
| B | 0 | 21 | 0 |
| C | 0 | 21 | 0 |
| D | 0 | 21 | 0 |
| Mode M0 | |||
|---|---|---|---|
| Quadrant | BADHDUFLAG | Total packets | Discarded packets |
| A | 0 | 13449 | 2 |
| B | 0 | 13797 | 2 |
| C | 0 | 13808 | 2 |
| D | 0 | 20534 | 7 |
| Quadrant | Total seconds | Saturated seconds | Saturation percentage |
|---|---|---|---|
| A | 6357 | 37 | 0.582036% |
| B | 6357 | 40 | 0.629228% |
| C | 6357 | 81 | 1.274186% |
| D | 6356 | 439 | 6.906860% |
Noise dominated data is calculated using 1-second bins in cleaned event files. If a bin has >2000 counts, and if more than 50% of those come from <1% of pixels, then it is considered to be noise-dominated and hence unusable.
| Quadrant | # 1 sec bins | Bins with >0 counts | Bins with >2000 counts | High rate bins dominated by noise | Noise dominated (total time) | Noise dominated (detector-on time) | Marked lightcurve |
|---|---|---|---|---|---|---|---|
| A | 7552 | 6358 | 2 | 2 | 0.03% | 0.03% | 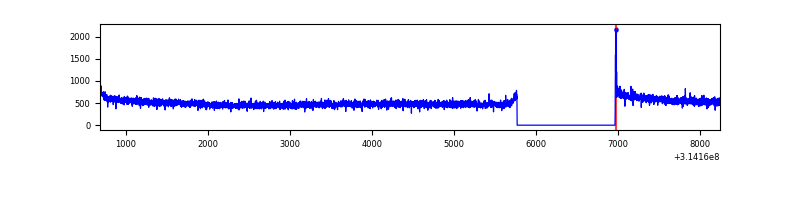 |
| B | 7552 | 6358 | 1 | 1 | 0.01% | 0.02% | 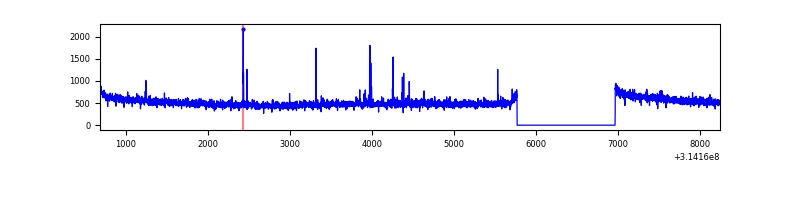 |
| C | 7552 | 6358 | 3 | 3 | 0.04% | 0.05% | 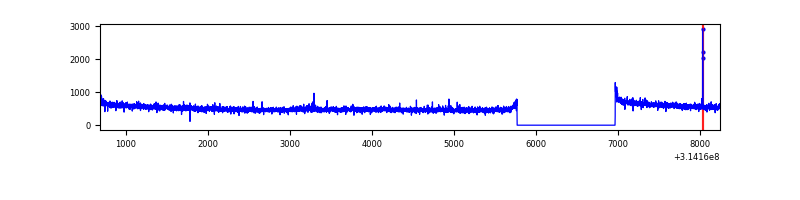 |
| D | 7551 | 6357 | 381 | 381 | 5.05% | 5.99% |  |
Top three noisy pixels from each quadrant. If the there are fewer than three noisy pixels in the level2.evt file, extra rows are filled as -1
| Pixel properties | Quadrant properties | ||||||
|---|---|---|---|---|---|---|---|
| Quadrant | DetID | PixID | Counts | Sigma | Mean | Median | Sigma |
| A | 13 | 254 | 12056 | 68.62 | 825 | 809 | 163.9 |
| A | 0 | 175 | 9436 | 52.63 | 825 | 809 | 163.9 |
| A | 0 | 226 | 7141 | 38.63 | 825 | 809 | 163.9 |
| B | 0 | 190 | 17541 | 109.97 | 826 | 808 | 152.2 |
| B | 12 | 111 | 17190 | 107.66 | 826 | 808 | 152.2 |
| B | 0 | 245 | 16251 | 101.49 | 826 | 808 | 152.2 |
| C | 14 | 238 | 130199 | 699.93 | 804 | 811 | 184.9 |
| C | 10 | 22 | 14379 | 73.4 | 804 | 811 | 184.9 |
| C | 0 | 10 | 5701 | 26.45 | 804 | 811 | 184.9 |
| D | 1 | 52 | 2399664 | 12585.46 | 793 | 771 | 190.6 |
| D | 5 | 222 | 29150 | 148.88 | 793 | 771 | 190.6 |
| D | 2 | 234 | 24994 | 127.08 | 793 | 771 | 190.6 |
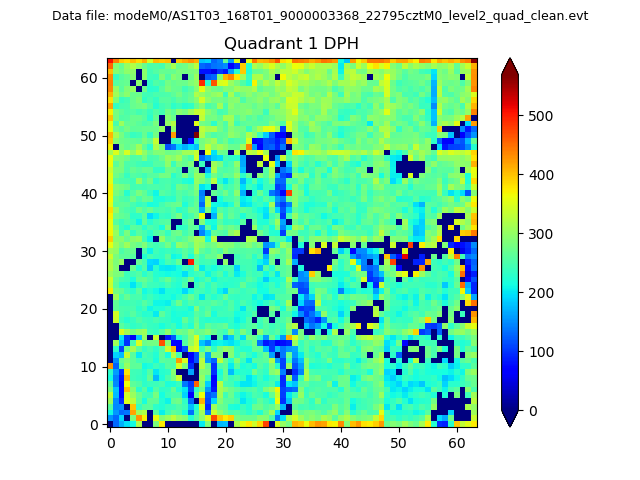
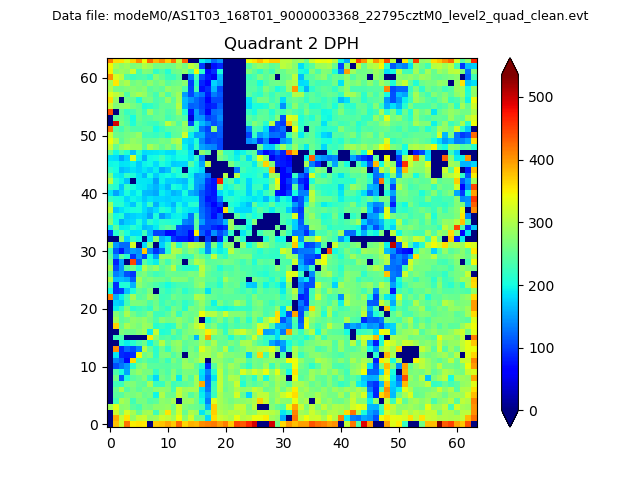
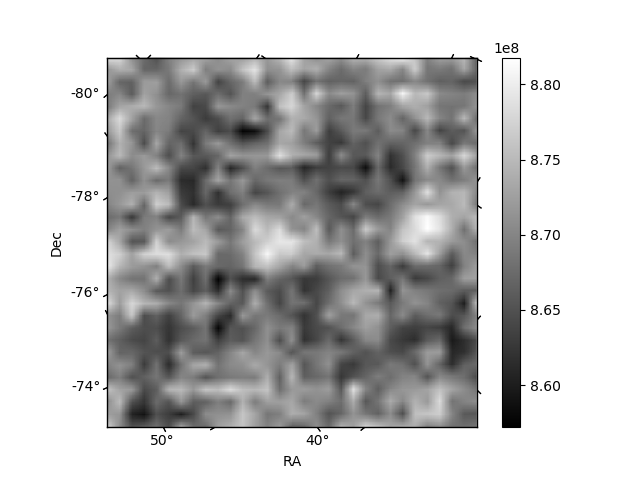
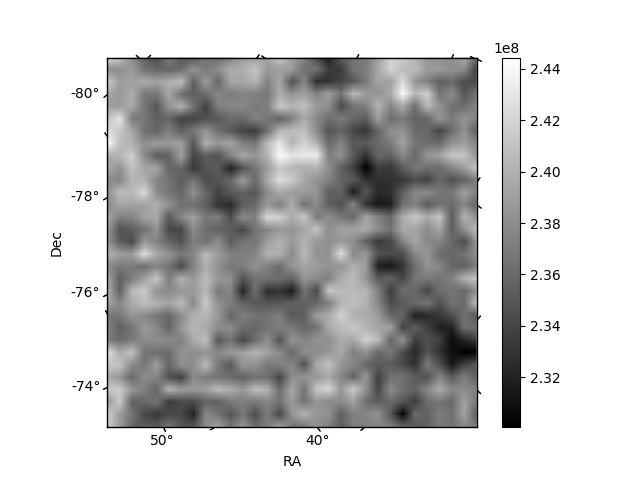
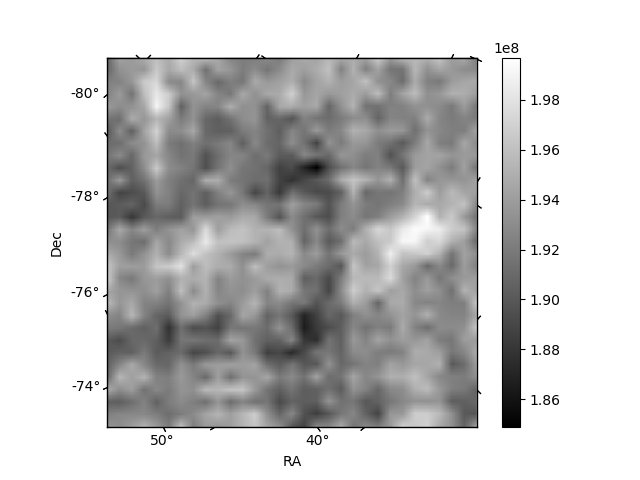
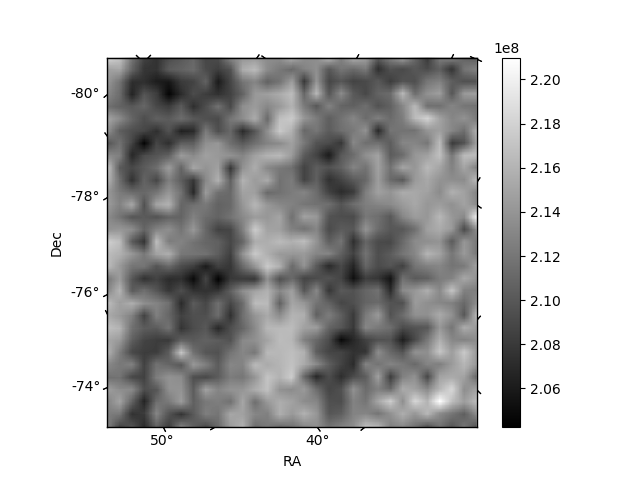
Histogram calculated using DETX and DETY for each event in the final _common_clean file
| Quadrant A | 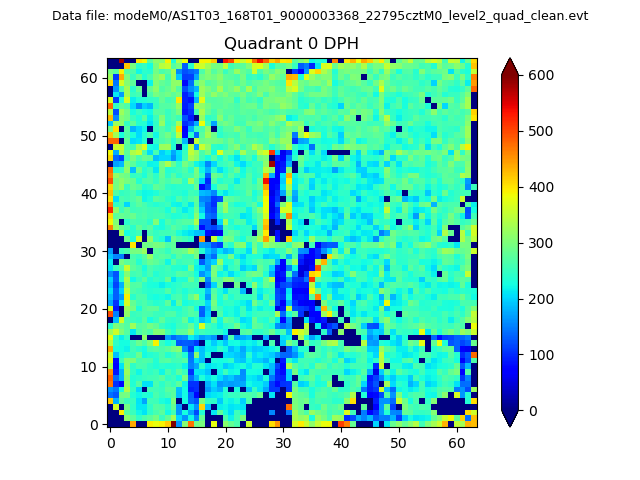 |
 |
Quadrant B |
|---|---|---|---|
| Quadrant D | 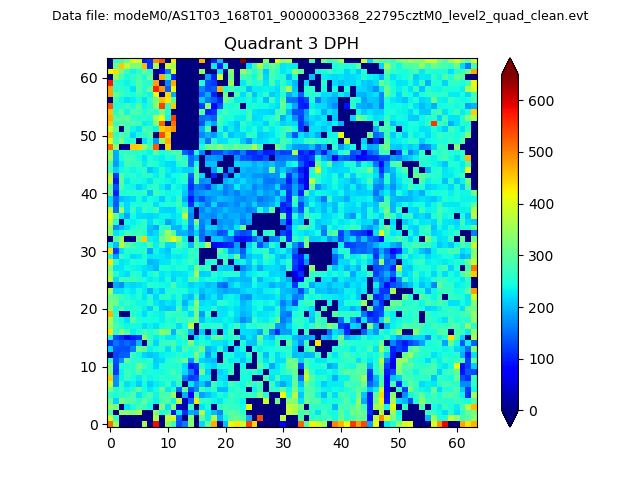 |
 |
Quadrant C |
| Plot type | Count rate plots | Images |
|---|---|---|
| Comparison with Poisson distribution Blue bars denote a histogram of data divided into 1 sec bins. Red curve is a Poisson curve with rate = median count rate of data. |
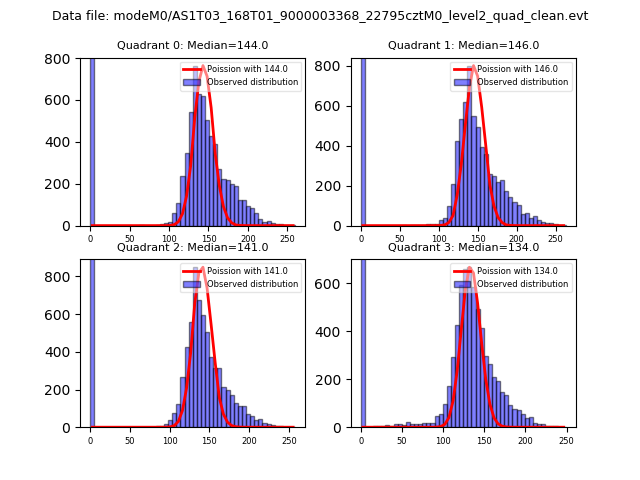 |
 |
| Quadrant-wise count rates Data is divided into 100 sec bins |
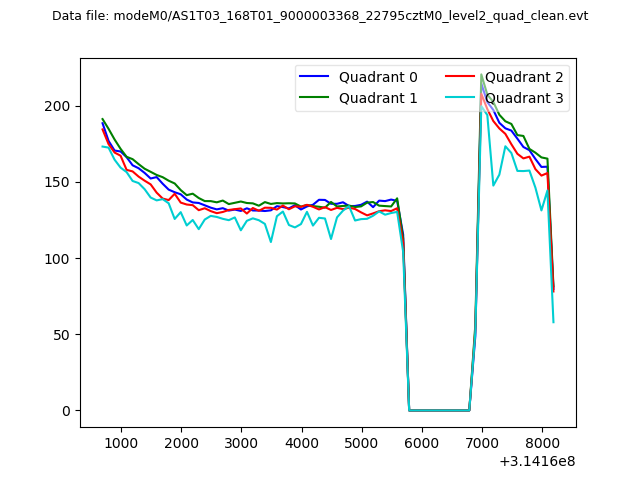 |
|
| Module-wise count rates for Quadrant A Data is divided into 100 sec bins |
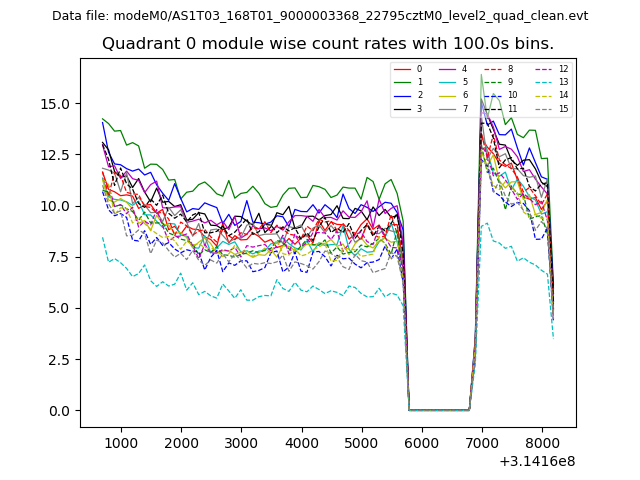 |
 |
| Module-wise count rates for Quadrant B Data is divided into 100 sec bins |
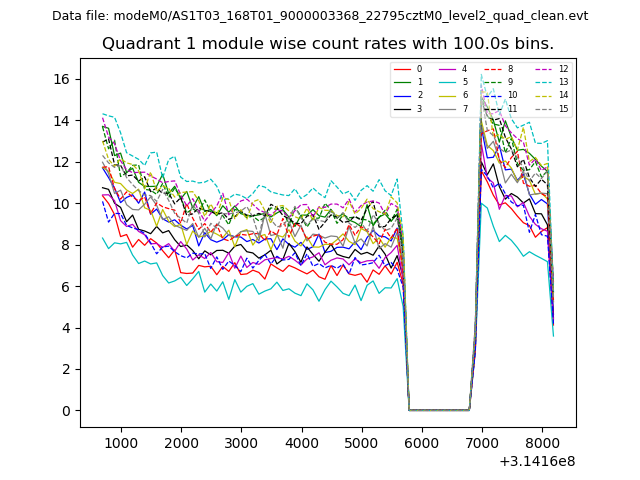 |
 |
| Module-wise count rates for Quadrant C Data is divided into 100 sec bins |
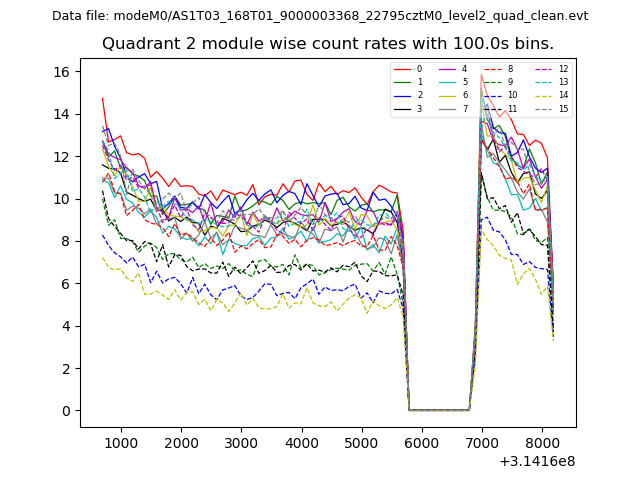 |
 |
| Module-wise count rates for Quadrant D Data is divided into 100 sec bins |
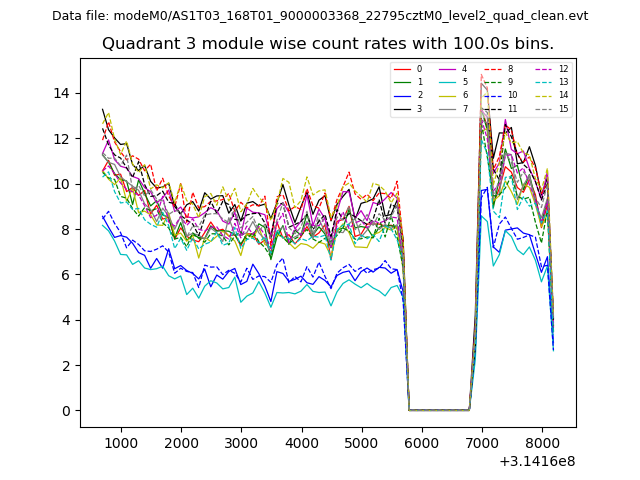 |
 |
| Parameter | Plot |
|---|---|
| CZT HV Monitor | 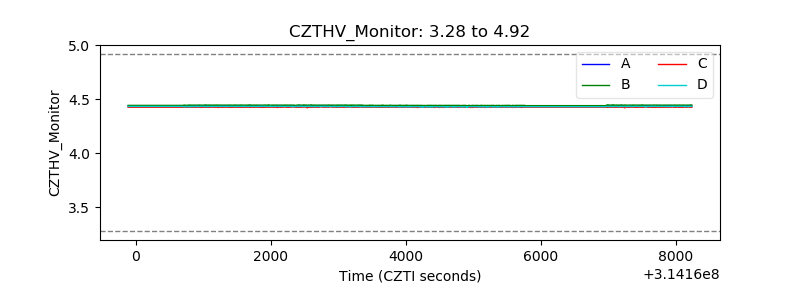 |
| D_VDD | 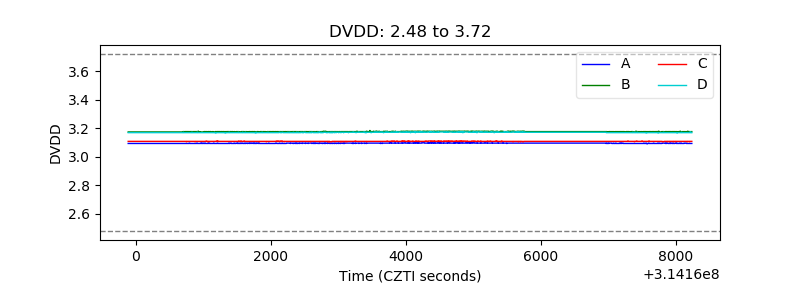 |
| Temperature 1 | 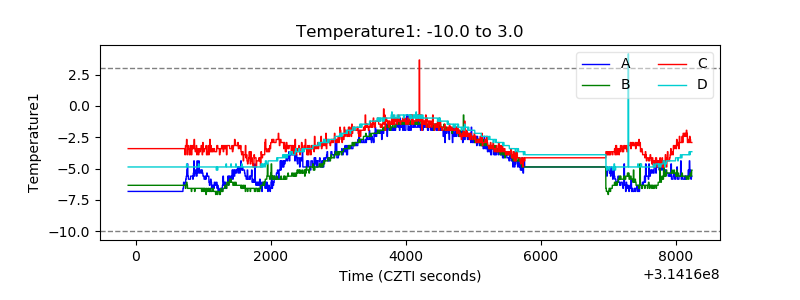 |
| Veto HV Monitor | 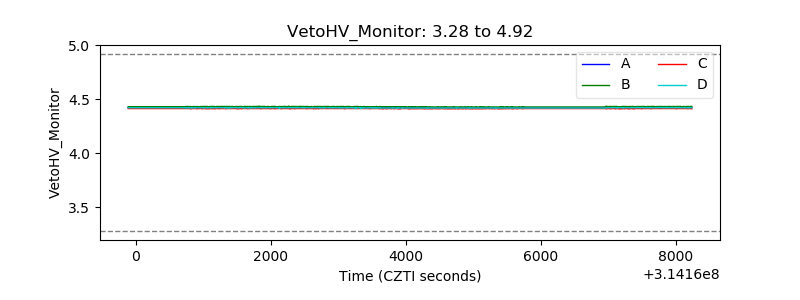 |
| Veto LLD | 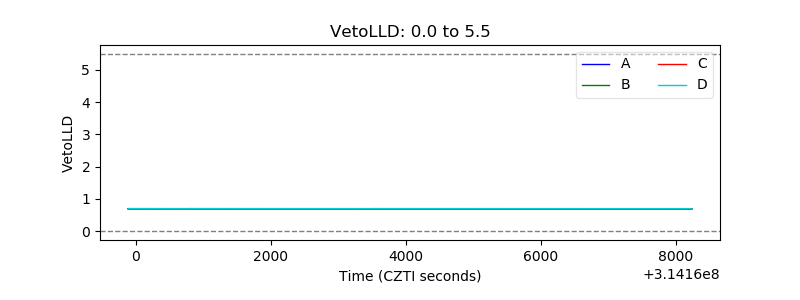 |
| Alpha Counter | 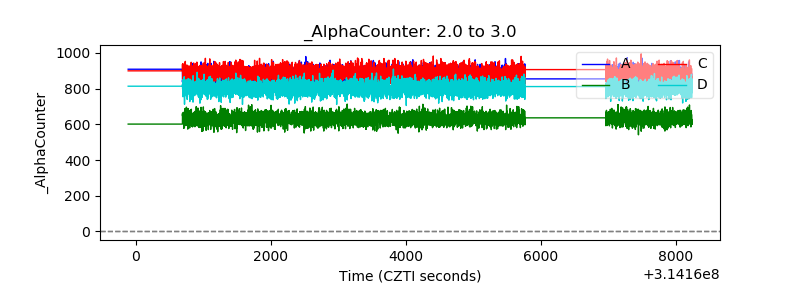 |
| _CPM_Rate | 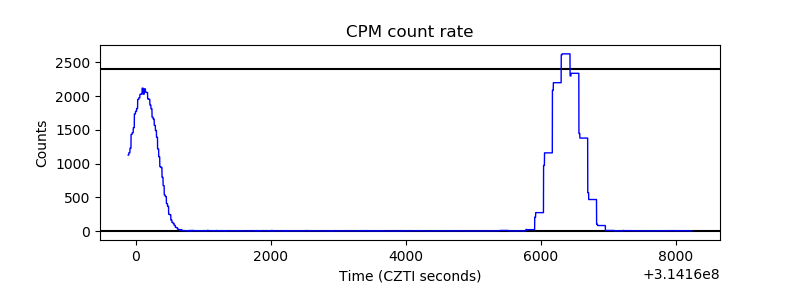 |
| CZT Counter | 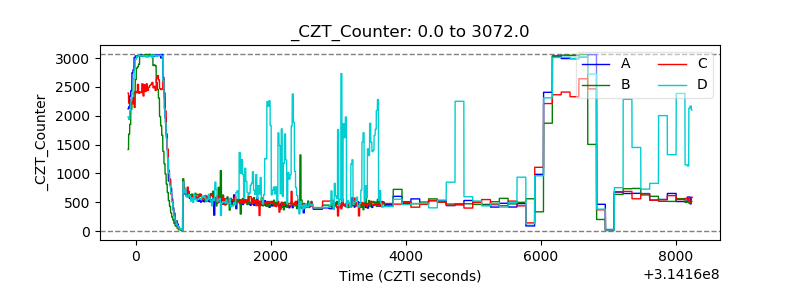 |
| +2.5 Volts monitor |  |
| +5 Volts monitor |  |
| _ROLL_ROT | 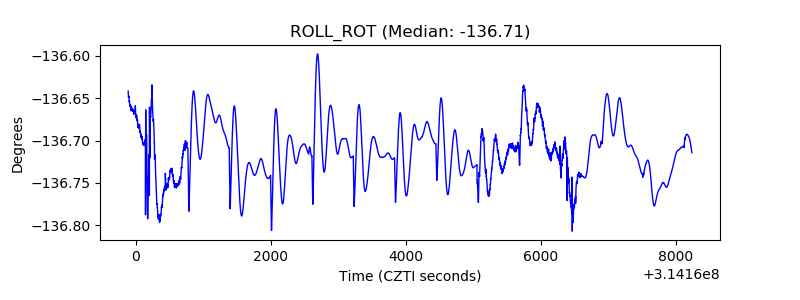 |
| _Roll_DEC | 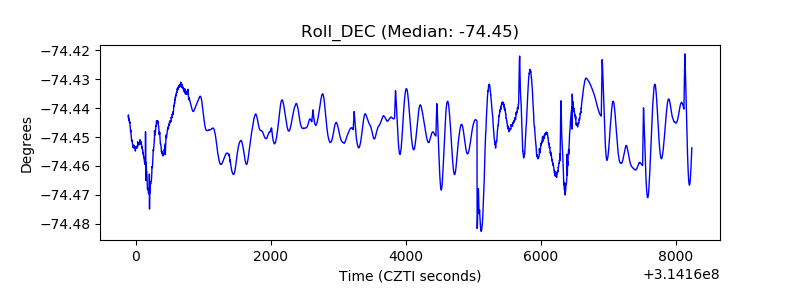 |
| _Roll_RA | 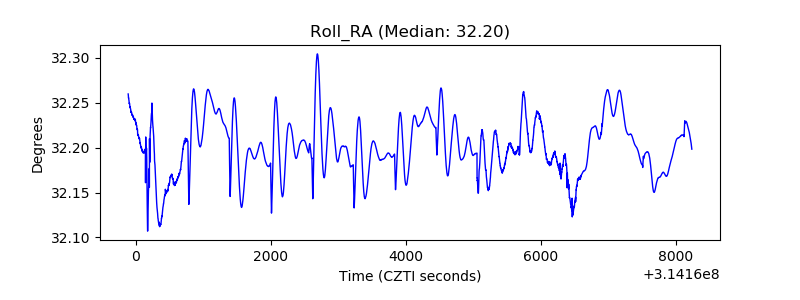 |
| Veto Counter | 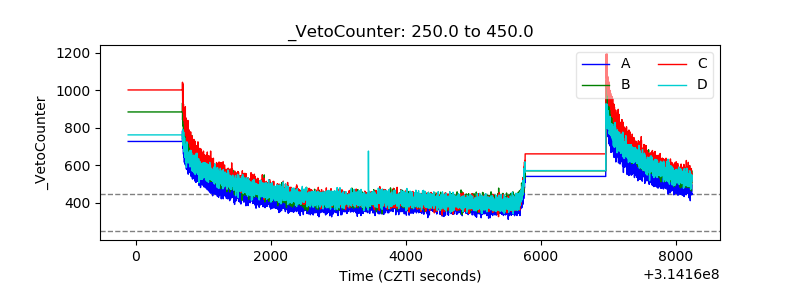 |