| Param | Original file | Final file |
|---|---|---|
| Filename | modeM0/AS1T03_168T01_9000003368_22797cztM0_level2.evt | modeM0/AS1T03_168T01_9000003368_22797cztM0_level2_quad_clean.evt |
| Size (bytes) | 595,342,080 | 139,029,120 |
| Size | 567.8 MB | 132.6 MB |
| Events in quadrant A | 3,229,770 | 993,627 |
| Events in quadrant B | 3,285,571 | 1,007,170 |
| Events in quadrant C | 3,337,074 | 958,581 |
| Events in quadrant D | 7,772,617 | 833,429 |
| Mode SS | |||
|---|---|---|---|
| Quadrant | BADHDUFLAG | Total packets | Discarded packets |
| A | 0 | 122 | 0 |
| B | 0 | 122 | 0 |
| C | 0 | 122 | 0 |
| D | 0 | 122 | 0 |
| Mode M9 | |||
|---|---|---|---|
| Quadrant | BADHDUFLAG | Total packets | Discarded packets |
| A | 0 | 13 | 0 |
| B | 0 | 13 | 0 |
| C | 0 | 13 | 0 |
| D | 0 | 13 | 0 |
| Mode M0 | |||
|---|---|---|---|
| Quadrant | BADHDUFLAG | Total packets | Discarded packets |
| A | 0 | 13372 | 1 |
| B | 0 | 13472 | 1 |
| C | 0 | 13862 | 1 |
| D | 0 | 27259 | 1 |
| Quadrant | Total seconds | Saturated seconds | Saturation percentage |
|---|---|---|---|
| A | 5978 | 94 | 1.572432% |
| B | 5979 | 112 | 1.873223% |
| C | 5979 | 170 | 2.843285% |
| D | 5979 | 1533 | 25.639739% |
Noise dominated data is calculated using 1-second bins in cleaned event files. If a bin has >2000 counts, and if more than 50% of those come from <1% of pixels, then it is considered to be noise-dominated and hence unusable.
| Quadrant | # 1 sec bins | Bins with >0 counts | Bins with >2000 counts | High rate bins dominated by noise | Noise dominated (total time) | Noise dominated (detector-on time) | Marked lightcurve |
|---|---|---|---|---|---|---|---|
| A | 7278 | 5979 | 0 | 0 | 0.00% | 0.00% | 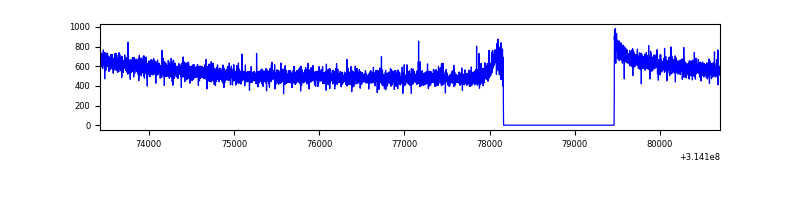 |
| B | 7279 | 5980 | 0 | 0 | 0.00% | 0.00% | 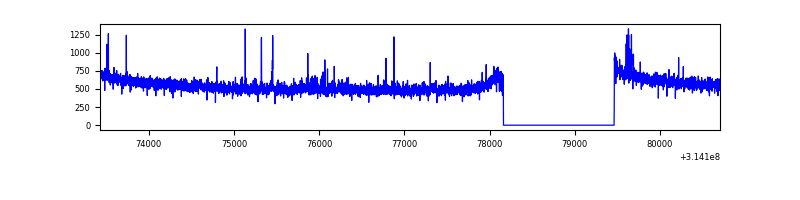 |
| C | 7279 | 5980 | 13 | 13 | 0.18% | 0.22% | 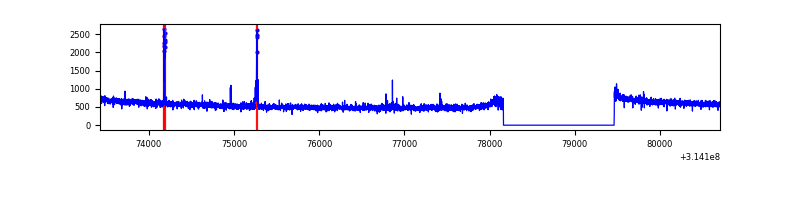 |
| D | 7279 | 5980 | 1295 | 1295 | 17.79% | 21.66% | 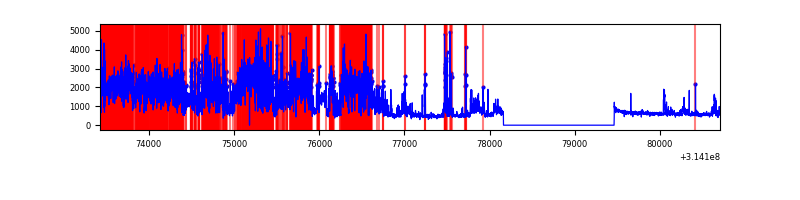 |
Top three noisy pixels from each quadrant. If the there are fewer than three noisy pixels in the level2.evt file, extra rows are filled as -1
| Pixel properties | Quadrant properties | ||||||
|---|---|---|---|---|---|---|---|
| Quadrant | DetID | PixID | Counts | Sigma | Mean | Median | Sigma |
| A | 13 | 254 | 11504 | 64.68 | 838 | 825 | 165.1 |
| A | 0 | 226 | 7241 | 38.86 | 838 | 825 | 165.1 |
| A | 12 | 194 | 6020 | 31.46 | 838 | 825 | 165.1 |
| B | 0 | 230 | 24892 | 158.61 | 830 | 814 | 151.8 |
| B | 12 | 111 | 16427 | 102.85 | 830 | 814 | 151.8 |
| B | 11 | 111 | 14246 | 88.48 | 830 | 814 | 151.8 |
| C | 14 | 238 | 132883 | 731.79 | 803 | 813 | 180.5 |
| C | 10 | 22 | 56575 | 308.97 | 803 | 813 | 180.5 |
| C | 2 | 16 | 12344 | 63.89 | 803 | 813 | 180.5 |
| D | 1 | 52 | 4589851 | 25592.64 | 753 | 733 | 179.3 |
| D | 5 | 222 | 225468 | 1253.3 | 753 | 733 | 179.3 |
| D | 2 | 152 | 32708 | 178.32 | 753 | 733 | 179.3 |
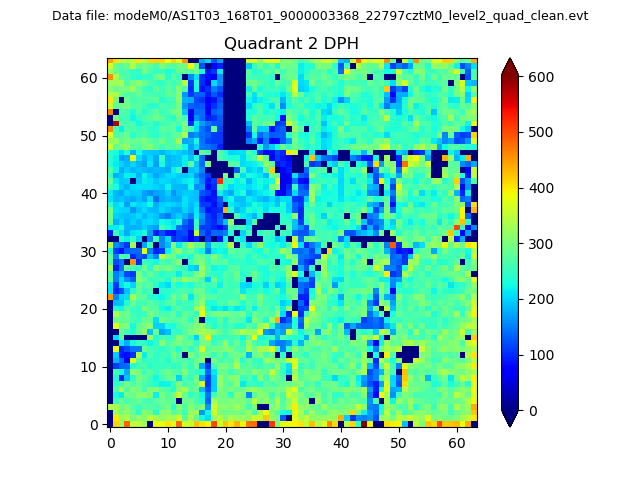
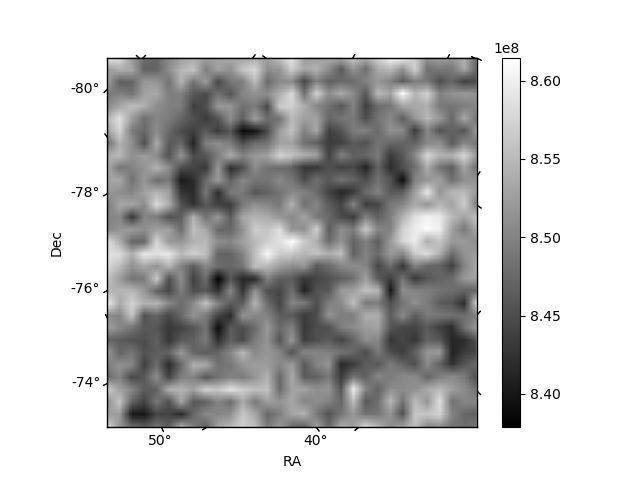
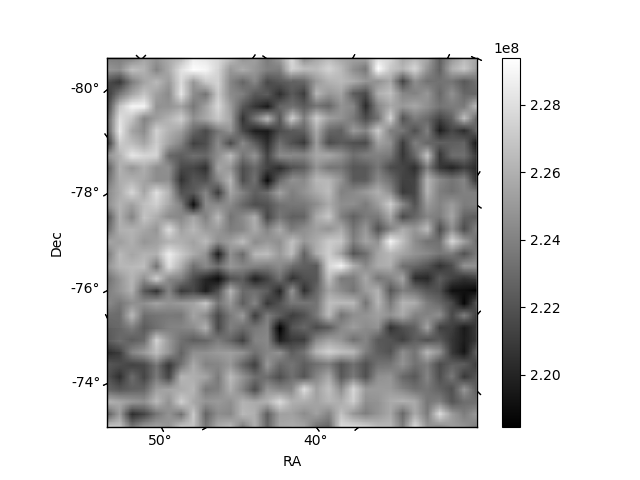
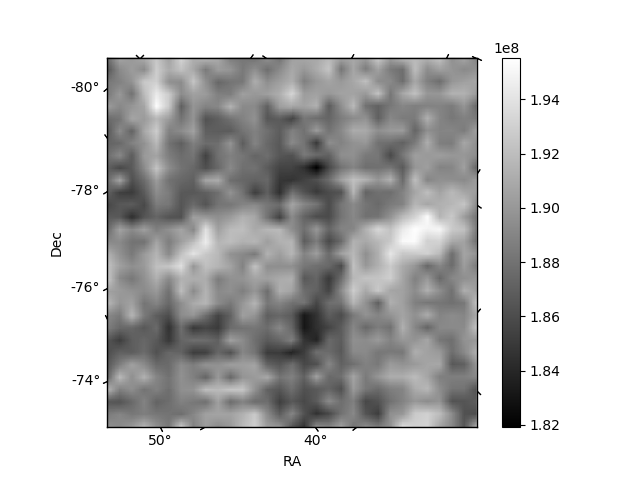
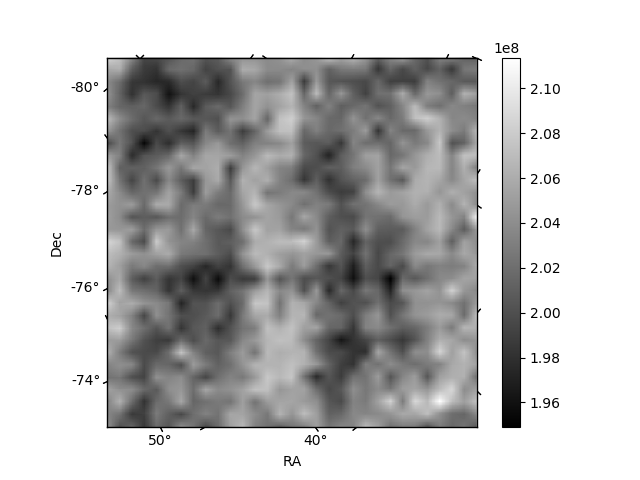
Histogram calculated using DETX and DETY for each event in the final _common_clean file
| Quadrant A | 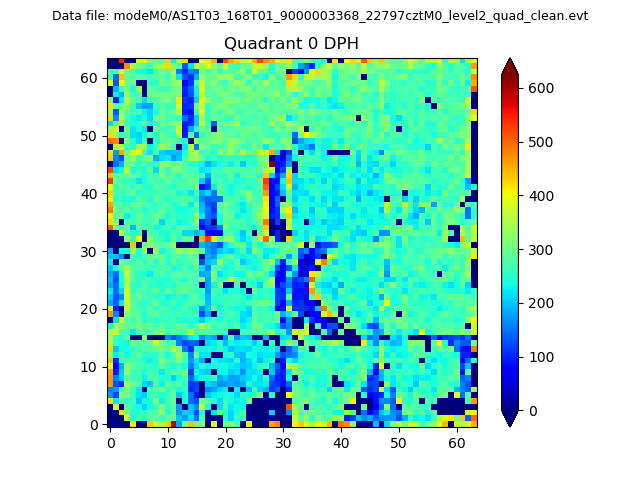 |
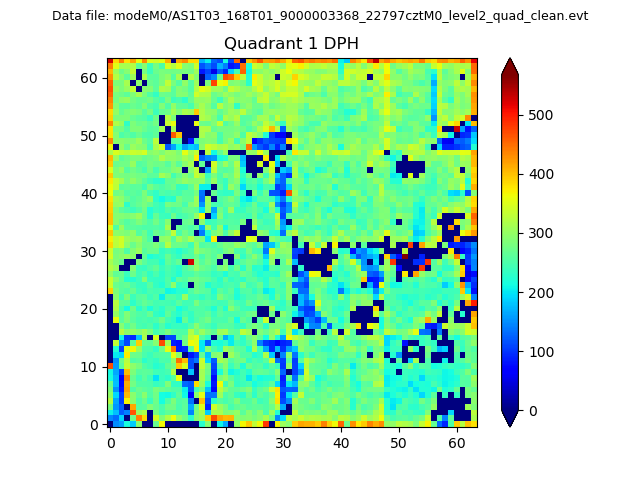 |
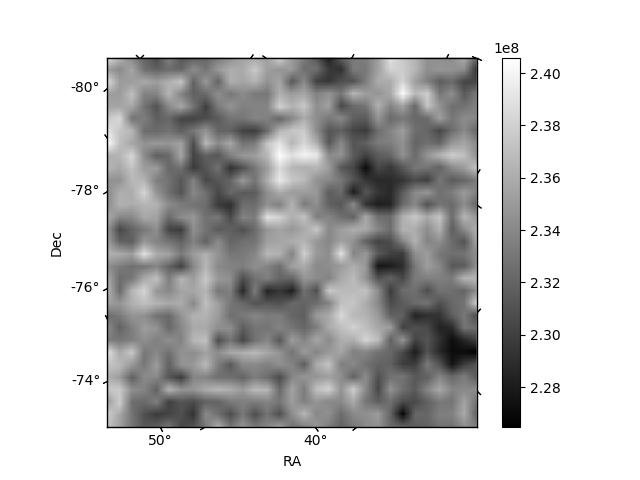
Quadrant B |
|---|---|---|---|
| Quadrant D | 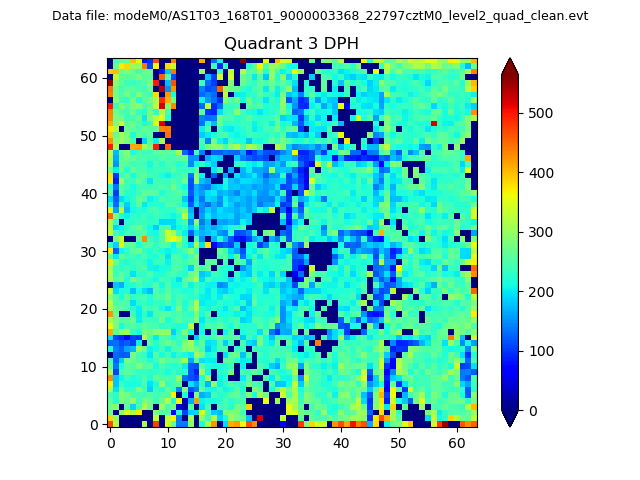 |
 |
Quadrant C |
| Plot type | Count rate plots | Images |
|---|---|---|
| Comparison with Poisson distribution Blue bars denote a histogram of data divided into 1 sec bins. Red curve is a Poisson curve with rate = median count rate of data. |
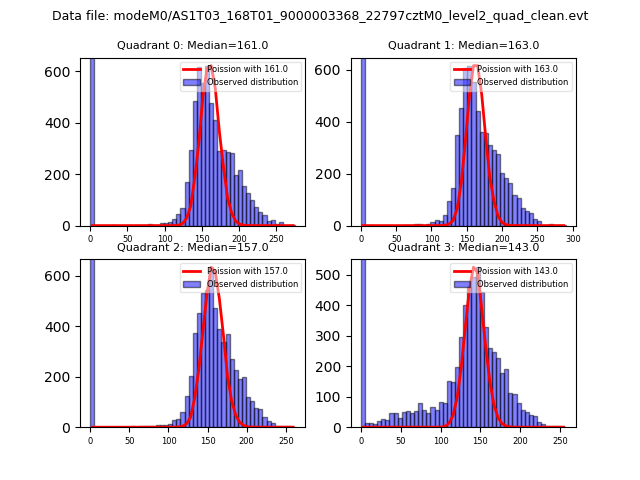 |
 |
| Quadrant-wise count rates Data is divided into 100 sec bins |
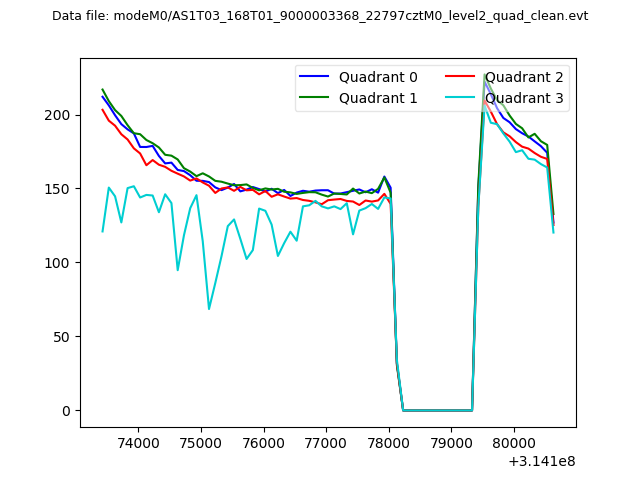 |
|
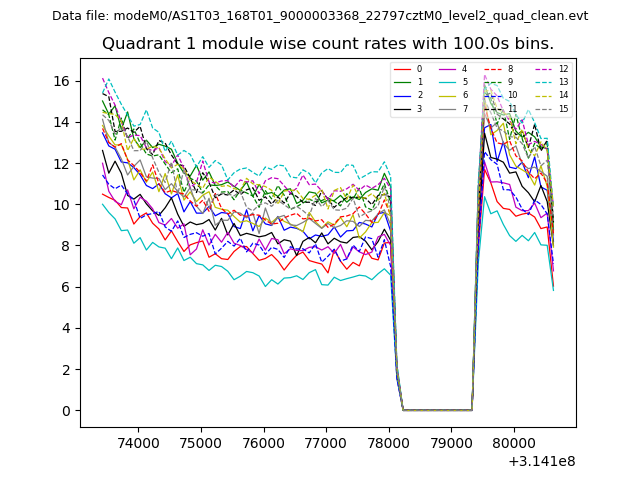
| Module-wise count rates for Quadrant A Data is divided into 100 sec bins |
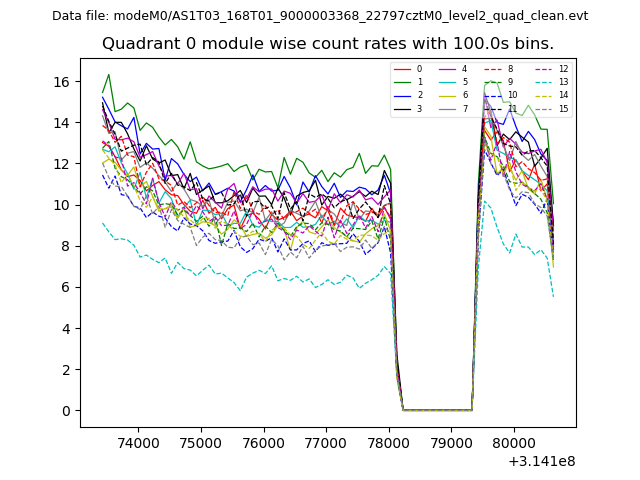 |
 |
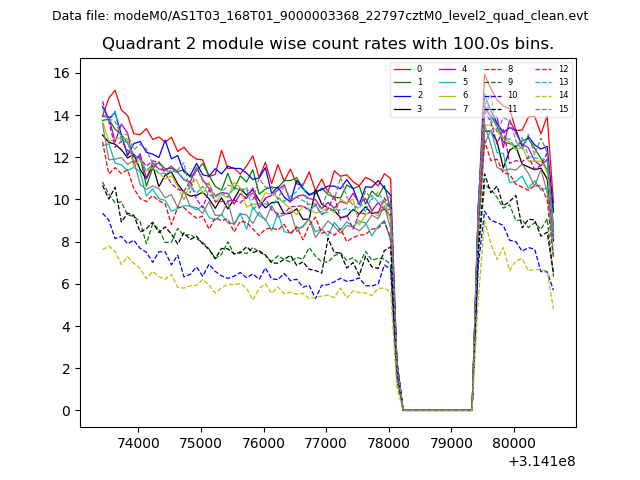
| Module-wise count rates for Quadrant B Data is divided into 100 sec bins |
 |
 |
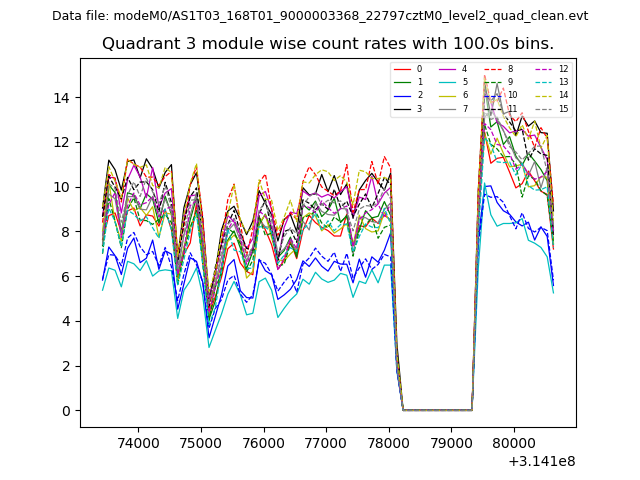
| Module-wise count rates for Quadrant C Data is divided into 100 sec bins |
 |
 |
| Module-wise count rates for Quadrant D Data is divided into 100 sec bins |
 |
 |
| Parameter | Plot |
|---|---|
| CZT HV Monitor | 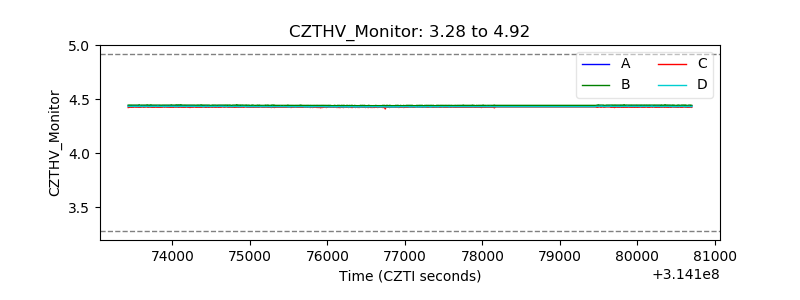 |
| D_VDD | 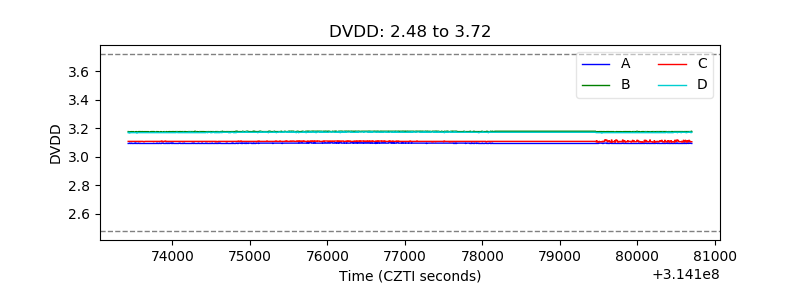 |
| Temperature 1 | 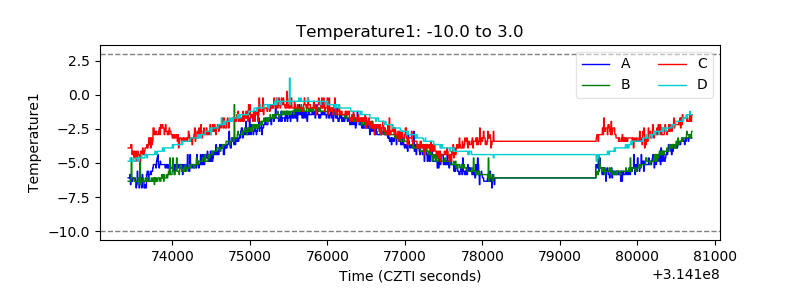 |
| Veto HV Monitor | 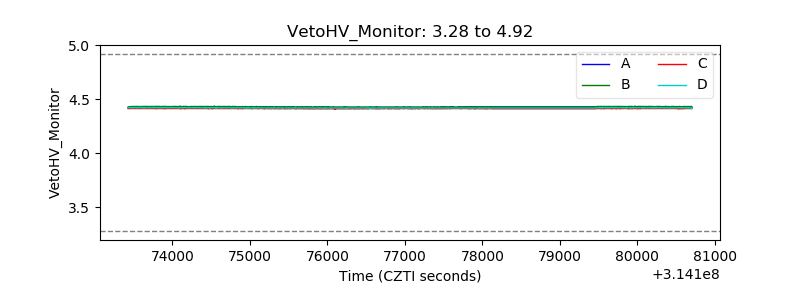 |
| Veto LLD | 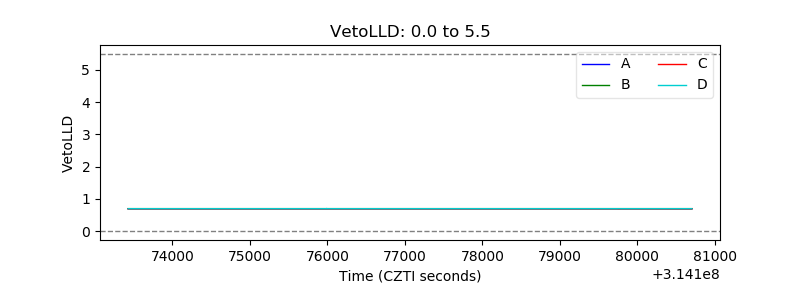 |
| Alpha Counter |  |
| _CPM_Rate | 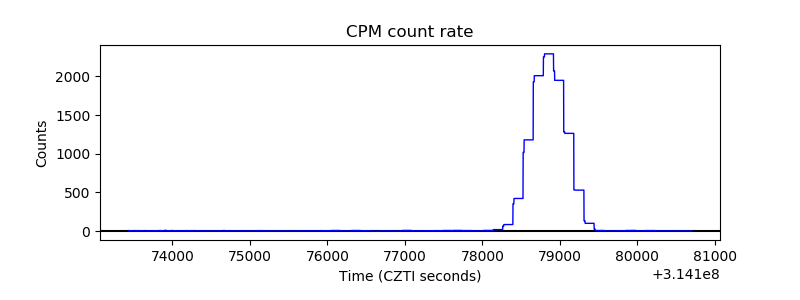 |
| CZT Counter | 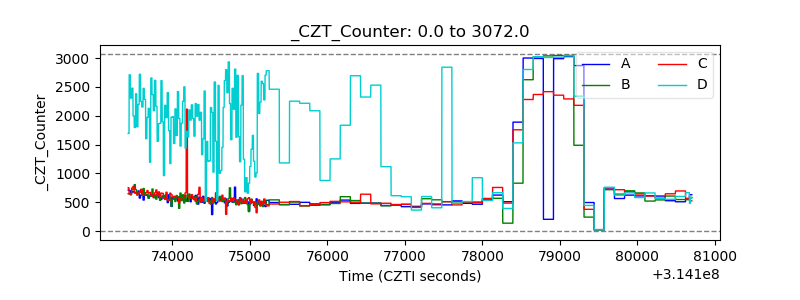 |
| +2.5 Volts monitor |  |
| +5 Volts monitor |  |
| _ROLL_ROT | 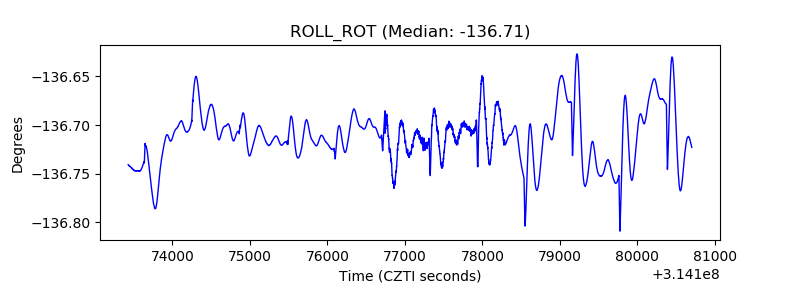 |
| _Roll_DEC | 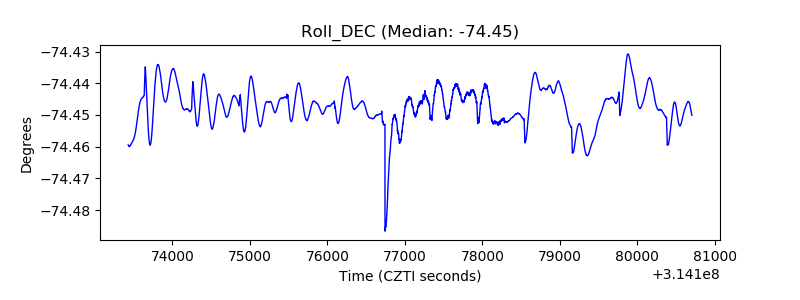 |
| _Roll_RA | 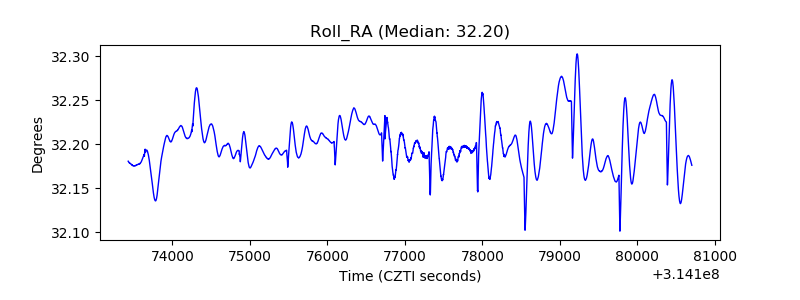 |
| Veto Counter | 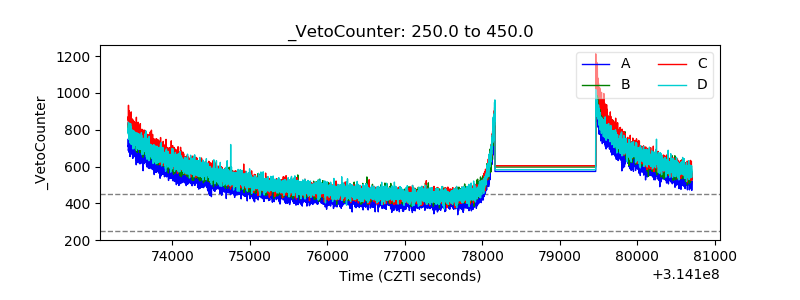 |