| Param | Original file | Final file |
|---|---|---|
| Filename | modeM0/AS1T03_168T01_9000003368_22799cztM0_level2.evt | modeM0/AS1T03_168T01_9000003368_22799cztM0_level2_quad_clean.evt |
| Size (bytes) | 349,277,760 | 102,965,760 |
| Size | 333.1 MB | 98.2 MB |
| Events in quadrant A | 2,330,568 | 718,141 |
| Events in quadrant B | 2,444,620 | 720,535 |
| Events in quadrant C | 2,311,704 | 687,716 |
| Events in quadrant D | 3,177,316 | 668,442 |
| Mode SS | |||
|---|---|---|---|
| Quadrant | BADHDUFLAG | Total packets | Discarded packets |
| A | 0 | 92 | 0 |
| B | 0 | 92 | 0 |
| C | 0 | 92 | 0 |
| D | 0 | 92 | 0 |
| Mode M9 | |||
|---|---|---|---|
| Quadrant | BADHDUFLAG | Total packets | Discarded packets |
| A | 0 | 5 | 0 |
| B | 0 | 6 | 0 |
| C | 0 | 6 | 0 |
| D | 0 | 6 | 0 |
| Mode M0 | |||
|---|---|---|---|
| Quadrant | BADHDUFLAG | Total packets | Discarded packets |
| A | 0 | 9761 | 1 |
| B | 0 | 10069 | 1 |
| C | 0 | 9820 | 1 |
| D | 0 | 12526 | 1 |
| Quadrant | Total seconds | Saturated seconds | Saturation percentage |
|---|---|---|---|
| A | 4606 | 5 | 0.108554% |
| B | 4606 | 28 | 0.607903% |
| C | 4606 | 29 | 0.629614% |
| D | 4606 | 85 | 1.845419% |
Noise dominated data is calculated using 1-second bins in cleaned event files. If a bin has >2000 counts, and if more than 50% of those come from <1% of pixels, then it is considered to be noise-dominated and hence unusable.
| Quadrant | # 1 sec bins | Bins with >0 counts | Bins with >2000 counts | High rate bins dominated by noise | Noise dominated (total time) | Noise dominated (detector-on time) | Marked lightcurve |
|---|---|---|---|---|---|---|---|
| A | 4606 | 4606 | 0 | 0 | 0.00% | 0.00% | 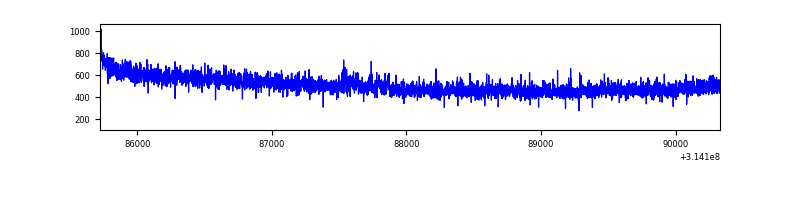 |
| B | 4606 | 4606 | 13 | 13 | 0.28% | 0.28% | 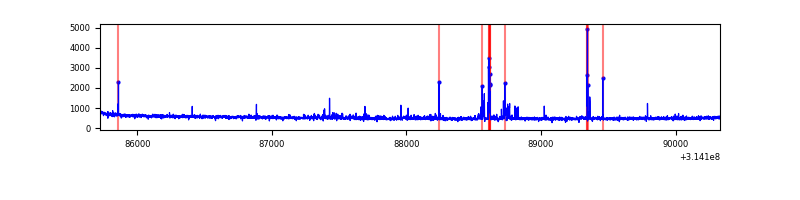 |
| C | 4606 | 4606 | 0 | 0 | 0.00% | 0.00% | 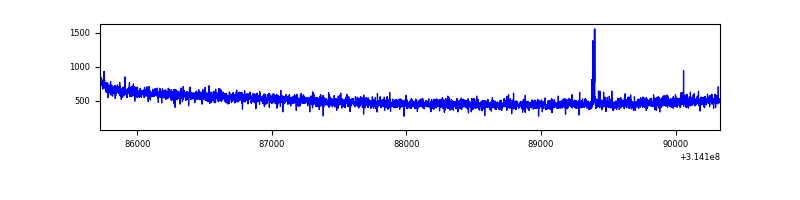 |
| D | 4606 | 4606 | 71 | 71 | 1.54% | 1.54% | 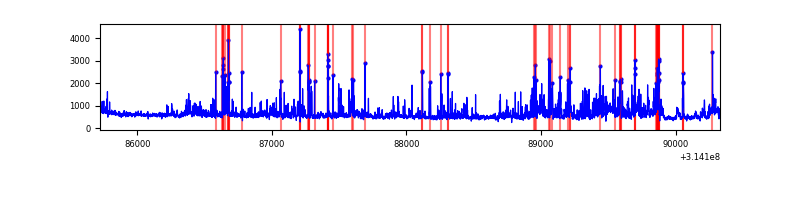 |
Top three noisy pixels from each quadrant. If the there are fewer than three noisy pixels in the level2.evt file, extra rows are filled as -1
| Pixel properties | Quadrant properties | ||||||
|---|---|---|---|---|---|---|---|
| Quadrant | DetID | PixID | Counts | Sigma | Mean | Median | Sigma |
| A | 11 | 47 | 18604 | 151.13 | 599 | 590 | 119.2 |
| A | 13 | 254 | 9121 | 71.57 | 599 | 590 | 119.2 |
| A | 0 | 226 | 5199 | 38.67 | 599 | 590 | 119.2 |
| B | 0 | 245 | 68848 | 626.26 | 592 | 583 | 109.0 |
| B | 0 | 228 | 27447 | 246.45 | 592 | 583 | 109.0 |
| B | 0 | 230 | 16882 | 149.53 | 592 | 583 | 109.0 |
| C | 14 | 238 | 93127 | 715.59 | 567 | 572 | 129.3 |
| C | 10 | 22 | 7353 | 52.43 | 567 | 572 | 129.3 |
| C | 13 | 61 | 4034 | 26.77 | 567 | 572 | 129.3 |
| D | 1 | 52 | 825325 | 6015.69 | 575 | 561 | 137.1 |
| D | 8 | 195 | 37260 | 267.68 | 575 | 561 | 137.1 |
| D | 12 | 227 | 31186 | 223.37 | 575 | 561 | 137.1 |
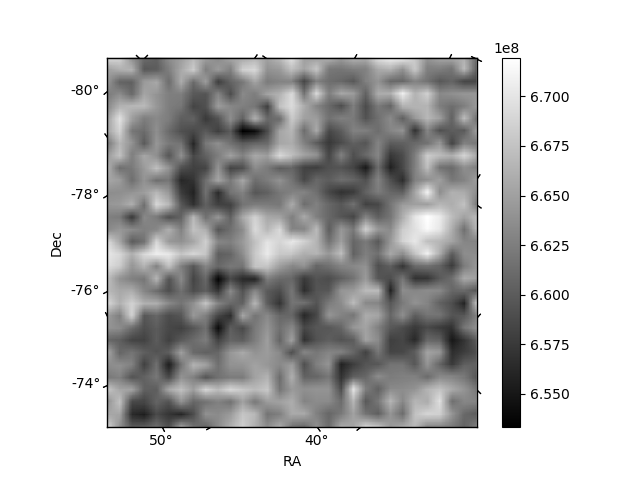
Histogram calculated using DETX and DETY for each event in the final _common_clean file
| Quadrant A | 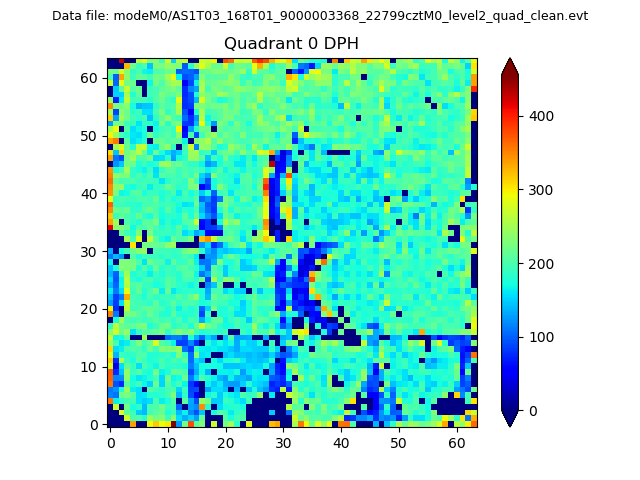 |
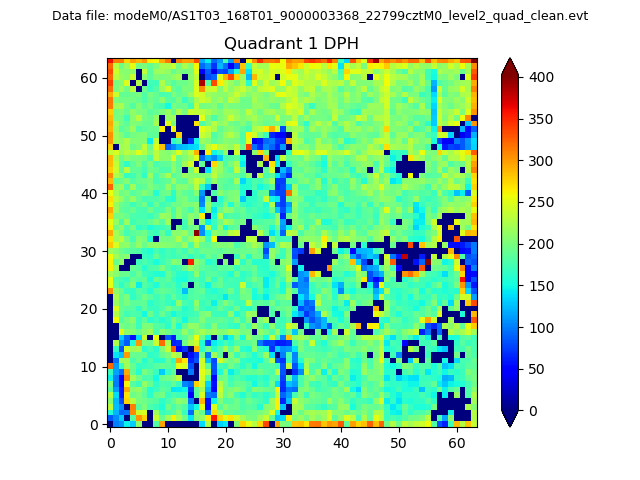 |
Quadrant B |
|---|---|---|---|
| Quadrant D |  |
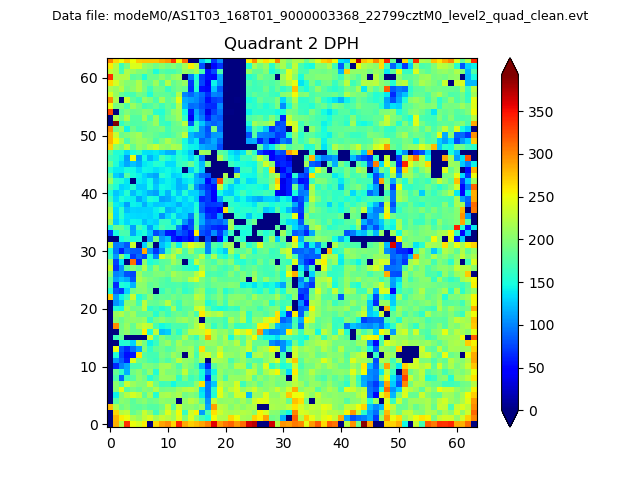 |
Quadrant C |
| Plot type | Count rate plots | Images |
|---|---|---|
| Comparison with Poisson distribution Blue bars denote a histogram of data divided into 1 sec bins. Red curve is a Poisson curve with rate = median count rate of data. |
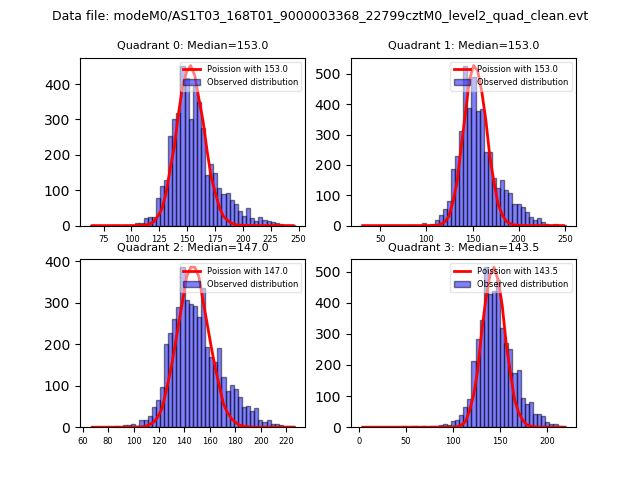 |
 |
| Quadrant-wise count rates Data is divided into 100 sec bins |
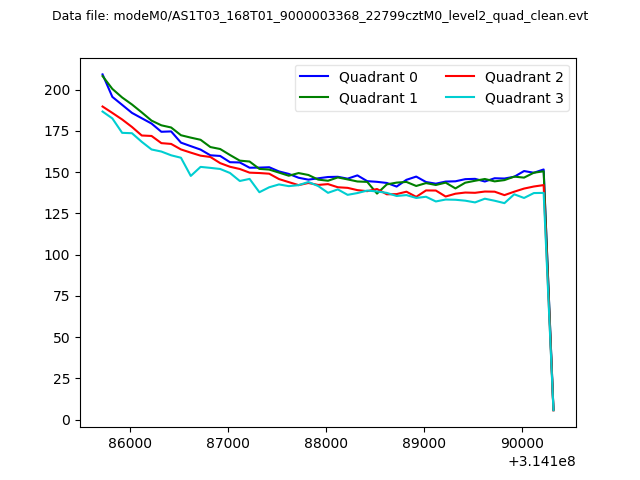 |
|
| Module-wise count rates for Quadrant A Data is divided into 100 sec bins |
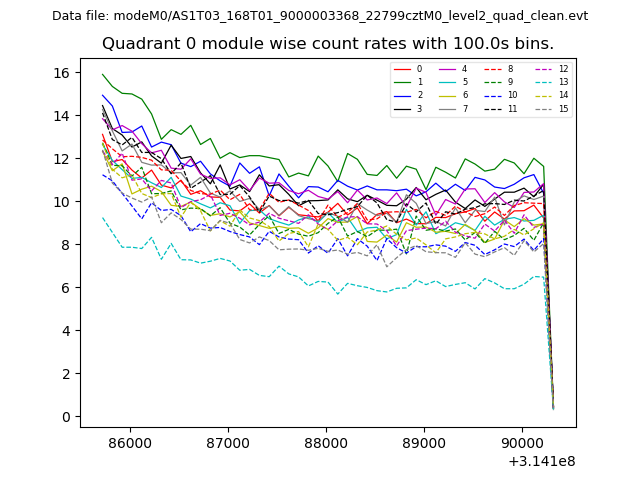 |
 |
| Module-wise count rates for Quadrant B Data is divided into 100 sec bins |
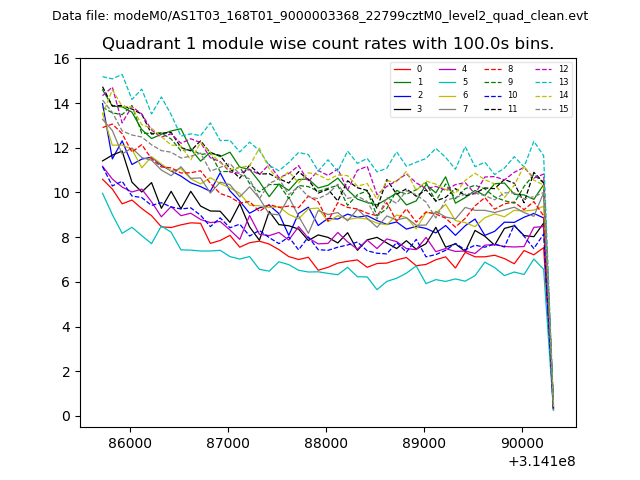 |
 |
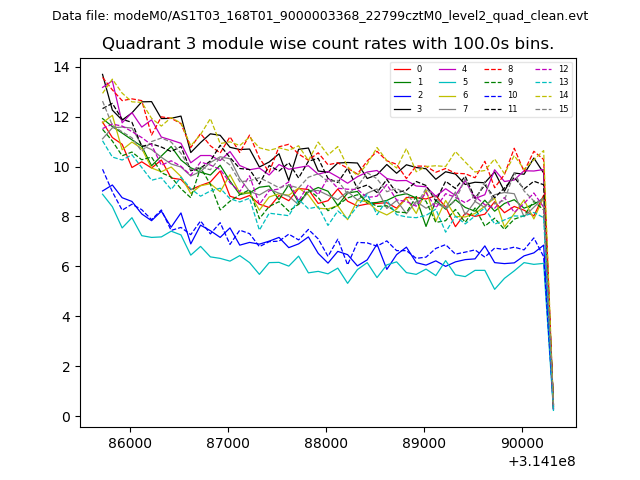
| Module-wise count rates for Quadrant C Data is divided into 100 sec bins |
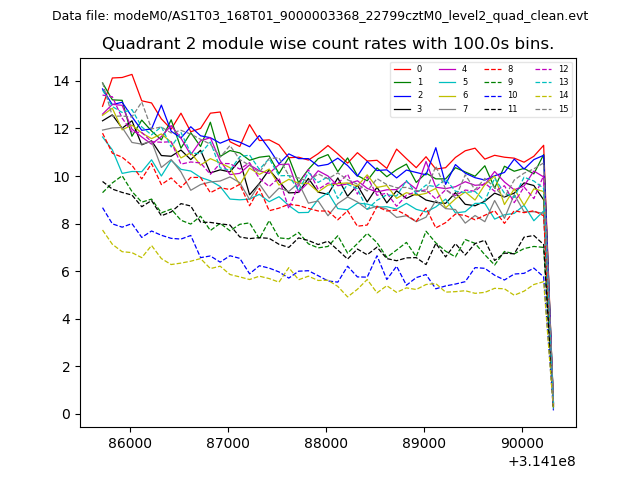 |
 |
| Module-wise count rates for Quadrant D Data is divided into 100 sec bins |
 |
 |
| Parameter | Plot |
|---|---|
| CZT HV Monitor | 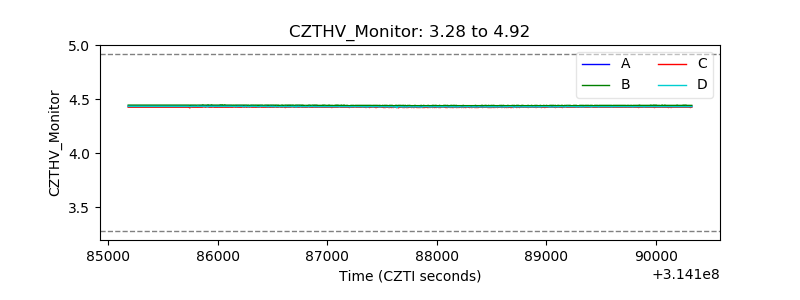 |
| D_VDD | 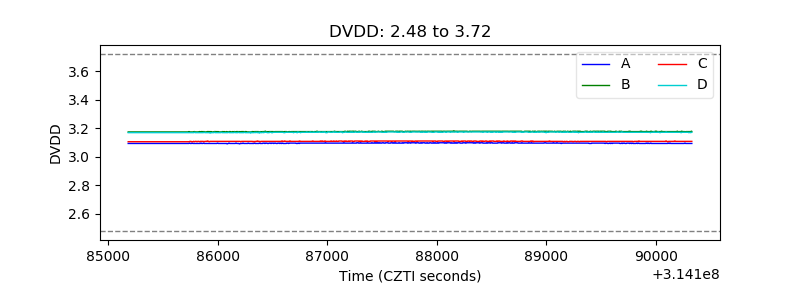 |
| Temperature 1 | 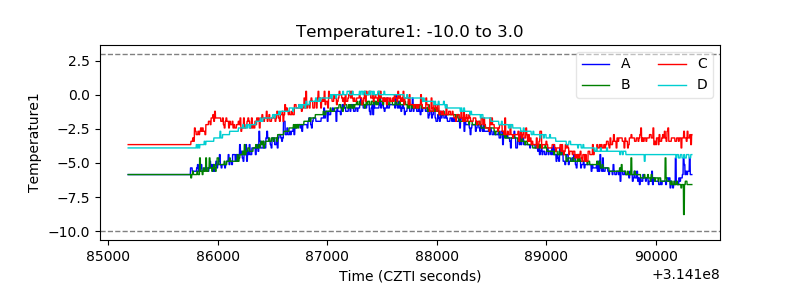 |
| Veto HV Monitor | 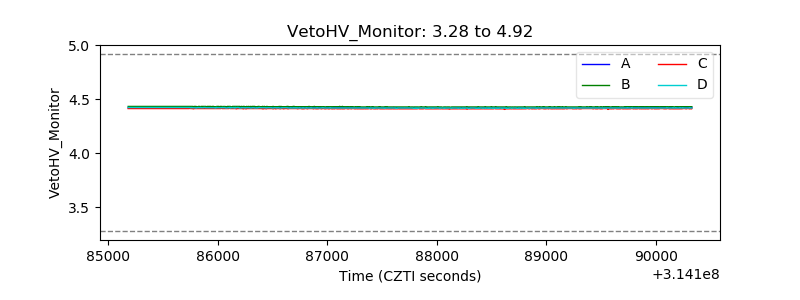 |
| Veto LLD | 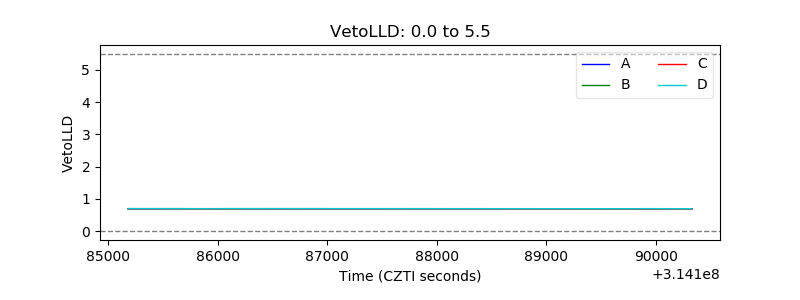 |
| Alpha Counter | 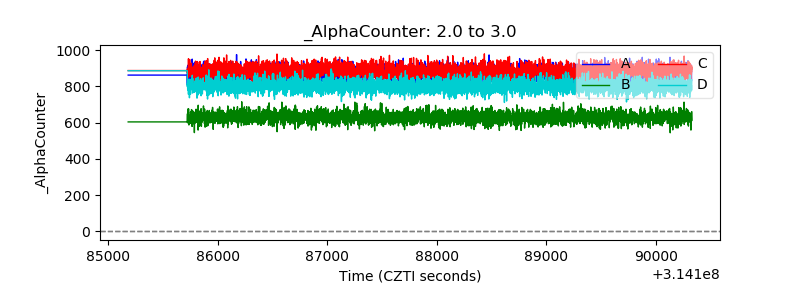 |
| _CPM_Rate | 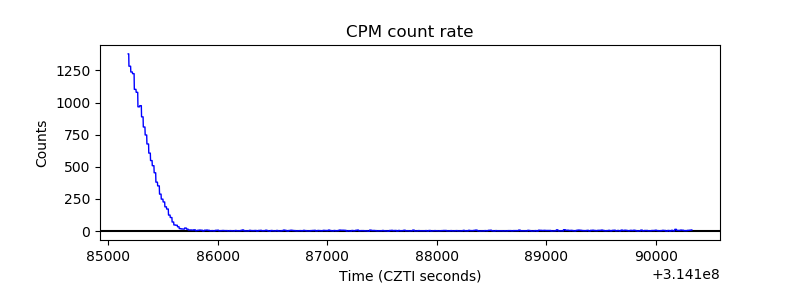 |
| CZT Counter | 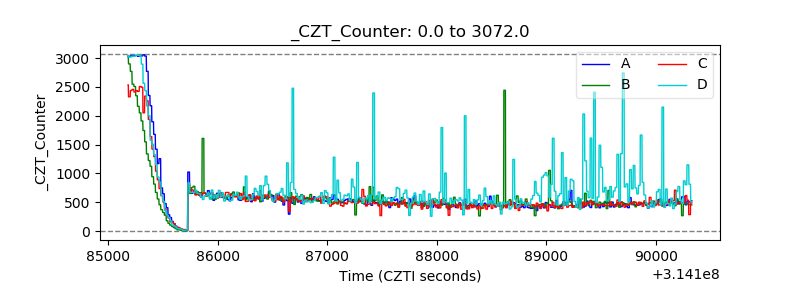 |
| +2.5 Volts monitor |  |
| +5 Volts monitor |  |
| _ROLL_ROT | 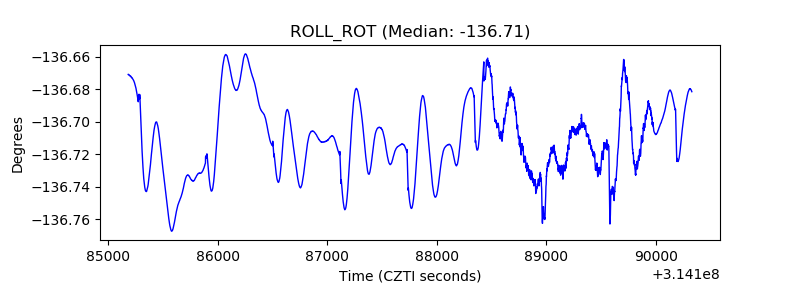 |
| _Roll_DEC | 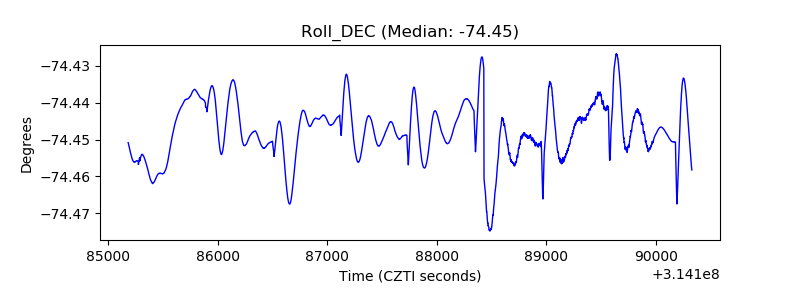 |
| _Roll_RA | 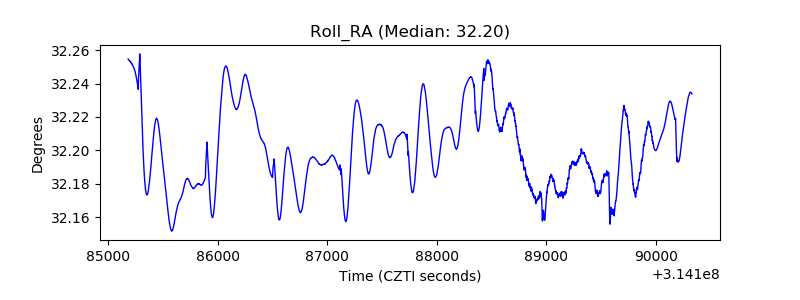 |
| Veto Counter | 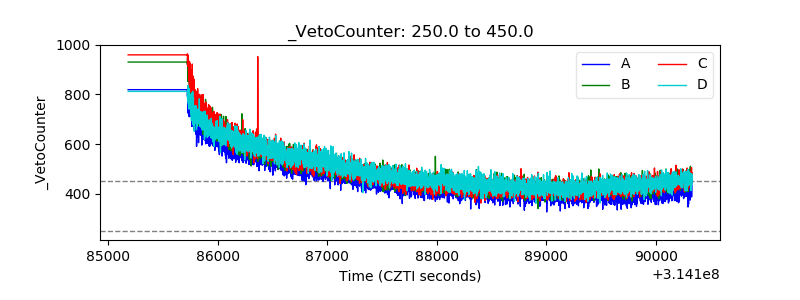 |