| Param | Original file | Final file |
|---|---|---|
| Filename | modeM0/AS1A07_054T01_9000003370cztM0_level2.fits | modeM0/AS1A07_054T01_9000003370cztM0_level2_quad_clean.evt |
| Size (bytes) | 783,576,000 | 965,073,600 |
| Size | 747.3 MB | 920.4 MB |
| Events in quadrant A | 4,918,052 | 6,357,157 |
| Events in quadrant B | 4,638,302 | 6,238,115 |
| Events in quadrant C | 4,688,186 | 5,884,080 |
| Events in quadrant D | 4,056,604 | 5,321,155 |
| Mode M0 | |||
|---|---|---|---|
| Quadrant | BADHDUFLAG | Total packets | Discarded packets |
| A | 0 | 162594 | 0 |
| B | 0 | 165342 | 0 |
| C | 0 | 162641 | 0 |
| D | 0 | 218366 | 0 |
| Mode SS | |||
|---|---|---|---|
| Quadrant | BADHDUFLAG | Total packets | Discarded packets |
| A | 0 | 1614 | 0 |
| B | 0 | 1614 | 0 |
| C | 0 | 1614 | 0 |
| D | 0 | 1614 | 0 |
| Mode M9 | |||
|---|---|---|---|
| Quadrant | BADHDUFLAG | Total packets | Discarded packets |
| A | 0 | 125 | 0 |
| B | 0 | 125 | 0 |
| C | 0 | 125 | 0 |
| D | 0 | 125 | 0 |
| Quadrant | Total seconds | Saturated seconds | Saturation percentage |
|---|---|---|---|
| A | 79175 | 518 | 0.654247% |
| B | 79175 | 763 | 0.963688% |
| C | 79175 | 1017 | 1.284496% |
| D | 79175 | 4167 | 5.263025% |
Noise dominated data is calculated using 1-second bins in cleaned event files. If a bin has >2000 counts, and if more than 50% of those come from <1% of pixels, then it is considered to be noise-dominated and hence unusable.
| Quadrant | # 1 sec bins | Bins with >0 counts | Bins with >2000 counts | High rate bins dominated by noise | Noise dominated (total time) | Noise dominated (detector-on time) | Marked lightcurve |
|---|---|---|---|---|---|---|---|
| A | 91760 | 79174 | 0 | 0 | 0.00% | 0.00% |  |
| B | 91760 | 79175 | 0 | 0 | 0.00% | 0.00% |  |
| C | 91760 | 79174 | 0 | 0 | 0.00% | 0.00% |  |
| D | 91760 | 79140 | 0 | 0 | 0.00% | 0.00% |  |
Top three noisy pixels from each quadrant. If the there are fewer than three noisy pixels in the level2.evt file, extra rows are filled as -1
| Pixel properties | Quadrant properties | ||||||
|---|---|---|---|---|---|---|---|
| Quadrant | DetID | PixID | Counts | Sigma | Mean | Median | Sigma |
| A | 0 | 29 | 4742 | 11.26 | 1280 | 1210 | 313.8 |
| A | 7 | 110 | 3821 | 8.32 | 1280 | 1210 | 313.8 |
| A | 9 | 19 | 3721 | 8.0 | 1280 | 1210 | 313.8 |
| B | 2 | 9 | 3682 | 10.63 | 1227 | 1178 | 235.5 |
| B | 2 | 8 | 3211 | 8.63 | 1227 | 1178 | 235.5 |
| B | 5 | 128 | 3059 | 7.99 | 1227 | 1178 | 235.5 |
| C | 1 | 81 | 3528 | 7.53 | 1238 | 1164 | 314.0 |
| C | 1 | 80 | 3504 | 7.45 | 1238 | 1164 | 314.0 |
| C | 12 | 241 | 3285 | 6.75 | 1238 | 1164 | 314.0 |
| D | 3 | 14 | 3043 | 6.4 | 1160 | 1064 | 309.3 |
| D | 10 | 189 | 3031 | 6.36 | 1160 | 1064 | 309.3 |
| D | 6 | 67 | 2834 | 5.72 | 1160 | 1064 | 309.3 |
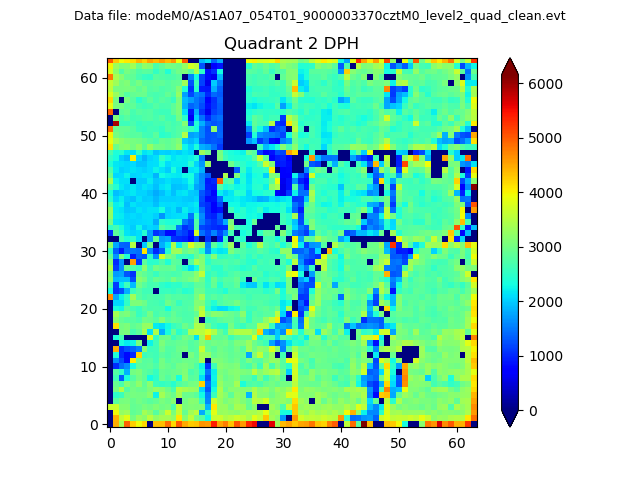
Histogram calculated using DETX and DETY for each event in the final _common_clean file
| Quadrant A |  |
 |
Quadrant B |
|---|---|---|---|
| Quadrant D |  |
 |
Quadrant C |
| Plot type | Count rate plots | Images |
|---|---|---|
| Comparison with Poisson distribution Blue bars denote a histogram of data divided into 1 sec bins. Red curve is a Poisson curve with rate = median count rate of data. |
 |
 |
| Quadrant-wise count rates Data is divided into 100 sec bins |
 |
|
| Module-wise count rates for Quadrant A Data is divided into 100 sec bins |
 |
 |
| Module-wise count rates for Quadrant B Data is divided into 100 sec bins |
 |
 |
| Module-wise count rates for Quadrant C Data is divided into 100 sec bins |
 |
 |
| Module-wise count rates for Quadrant D Data is divided into 100 sec bins |
 |
 |
| Parameter | Plot |
|---|---|
| CZT HV Monitor |  |
| D_VDD |  |
| Temperature 1 |  |
| Veto HV Monitor |  |
| Veto LLD |  |
| Alpha Counter |  |
| _CPM_Rate |  |
| CZT Counter |  |
| +2.5 Volts monitor |  |
| +5 Volts monitor |  |
| _ROLL_ROT |  |
| _Roll_DEC |  |
| _Roll_RA | 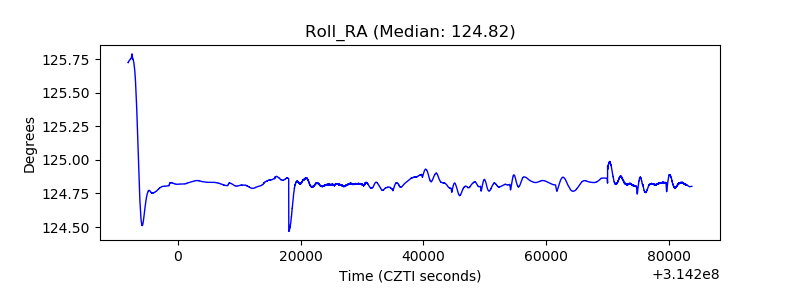 |
| Veto Counter |  |