| Param | Original file | Final file |
|---|---|---|
| Filename | modeM0/AS1A07_054T01_9000003370_22799cztM0_level2.evt | modeM0/AS1A07_054T01_9000003370_22799cztM0_level2_quad_clean.evt |
| Size (bytes) | 146,877,120 | 36,506,880 |
| Size | 140.1 MB | 34.8 MB |
| Events in quadrant A | 889,368 | 255,135 |
| Events in quadrant B | 904,248 | 258,992 |
| Events in quadrant C | 893,648 | 242,835 |
| Events in quadrant D | 1,644,599 | 225,019 |
| Mode M0 | |||
|---|---|---|---|
| Quadrant | BADHDUFLAG | Total packets | Discarded packets |
| A | 0 | 3545 | 1 |
| B | 0 | 3612 | 1 |
| C | 0 | 3615 | 1 |
| D | 0 | 6080 | 2 |
| Mode SS | |||
|---|---|---|---|
| Quadrant | BADHDUFLAG | Total packets | Discarded packets |
| A | 0 | 34 | 0 |
| B | 0 | 34 | 0 |
| C | 0 | 34 | 0 |
| D | 0 | 34 | 0 |
| Quadrant | Total seconds | Saturated seconds | Saturation percentage |
|---|---|---|---|
| A | 1674 | 33 | 1.971326% |
| B | 1674 | 29 | 1.732378% |
| C | 1674 | 25 | 1.493429% |
| D | 1673 | 211 | 12.612074% |
Noise dominated data is calculated using 1-second bins in cleaned event files. If a bin has >2000 counts, and if more than 50% of those come from <1% of pixels, then it is considered to be noise-dominated and hence unusable.
| Quadrant | # 1 sec bins | Bins with >0 counts | Bins with >2000 counts | High rate bins dominated by noise | Noise dominated (total time) | Noise dominated (detector-on time) | Marked lightcurve |
|---|---|---|---|---|---|---|---|
| A | 1674 | 1674 | 0 | 0 | 0.00% | 0.00% | 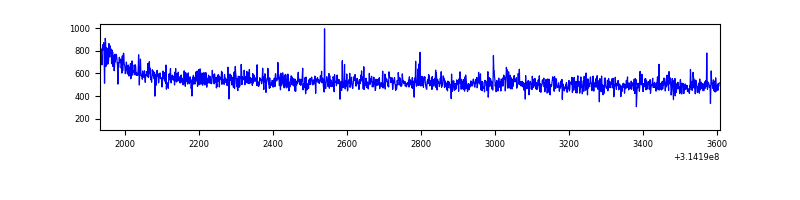 |
| B | 1674 | 1674 | 1 | 1 | 0.06% | 0.06% | 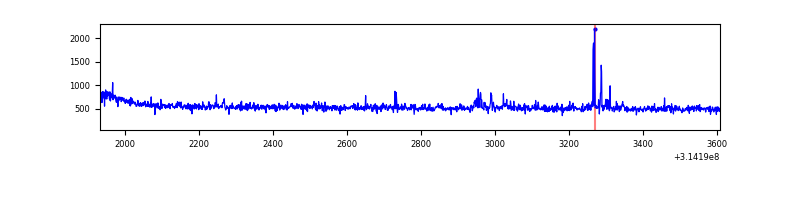 |
| C | 1674 | 1674 | 0 | 0 | 0.00% | 0.00% | 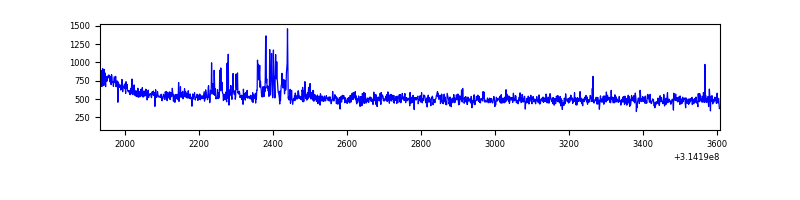 |
| D | 1673 | 1673 | 110 | 110 | 6.58% | 6.58% | 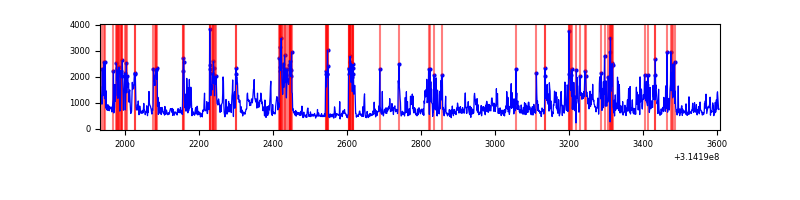 |
Top three noisy pixels from each quadrant. If the there are fewer than three noisy pixels in the level2.evt file, extra rows are filled as -1
| Pixel properties | Quadrant properties | ||||||
|---|---|---|---|---|---|---|---|
| Quadrant | DetID | PixID | Counts | Sigma | Mean | Median | Sigma |
| A | 13 | 254 | 2987 | 58.96 | 229 | 226 | 46.8 |
| A | 0 | 226 | 2029 | 38.51 | 229 | 226 | 46.8 |
| A | 11 | 47 | 2004 | 37.97 | 229 | 226 | 46.8 |
| B | 0 | 190 | 12547 | 285.38 | 223 | 218 | 43.2 |
| B | 0 | 228 | 11461 | 260.24 | 223 | 218 | 43.2 |
| B | 0 | 230 | 6167 | 137.7 | 223 | 218 | 43.2 |
| C | 14 | 238 | 34321 | 685.3 | 212 | 212 | 49.8 |
| C | 10 | 22 | 30621 | 610.96 | 212 | 212 | 49.8 |
| C | 13 | 61 | 1531 | 26.5 | 212 | 212 | 49.8 |
| D | 1 | 52 | 763846 | 14584.68 | 209 | 202 | 52.4 |
| D | 6 | 112 | 33798 | 641.63 | 209 | 202 | 52.4 |
| D | 8 | 195 | 16632 | 313.78 | 209 | 202 | 52.4 |
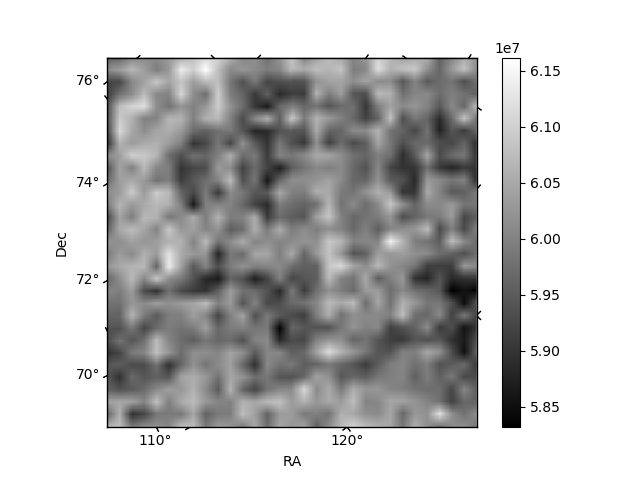
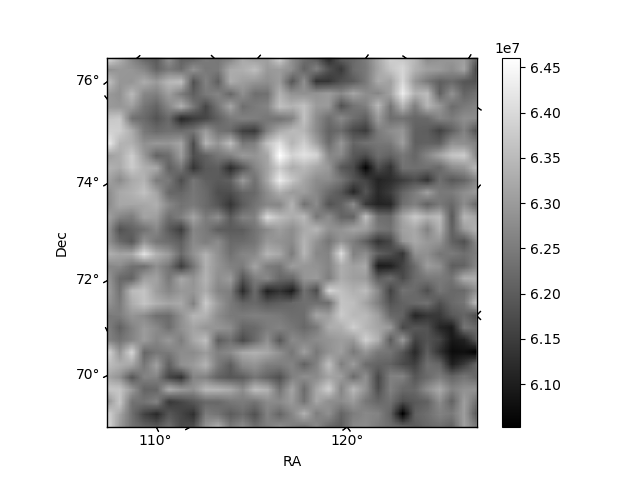
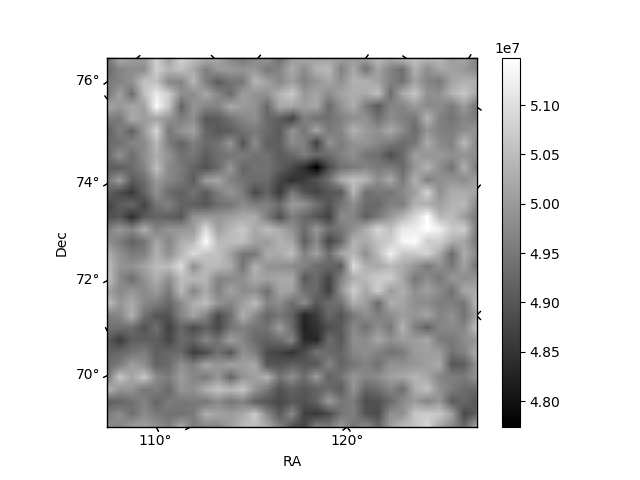
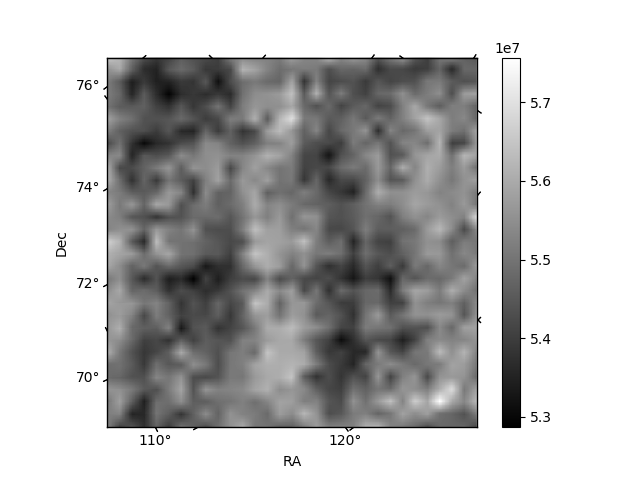
Histogram calculated using DETX and DETY for each event in the final _common_clean file
| Quadrant A | 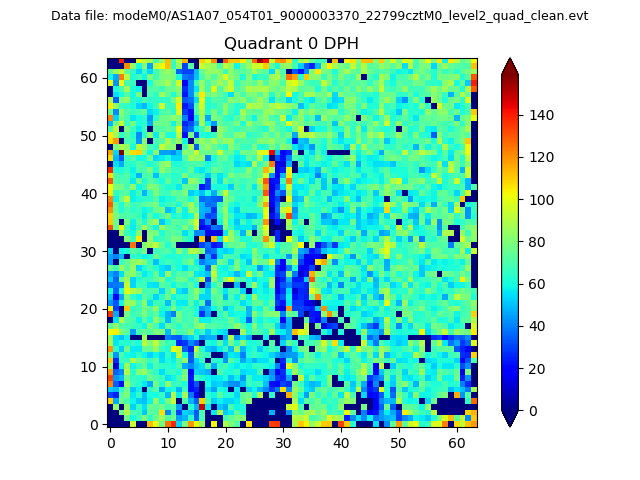 |
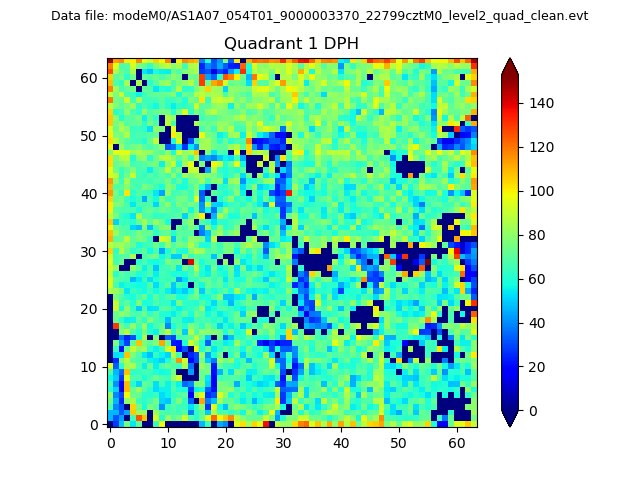 |
Quadrant B |
|---|---|---|---|
| Quadrant D | 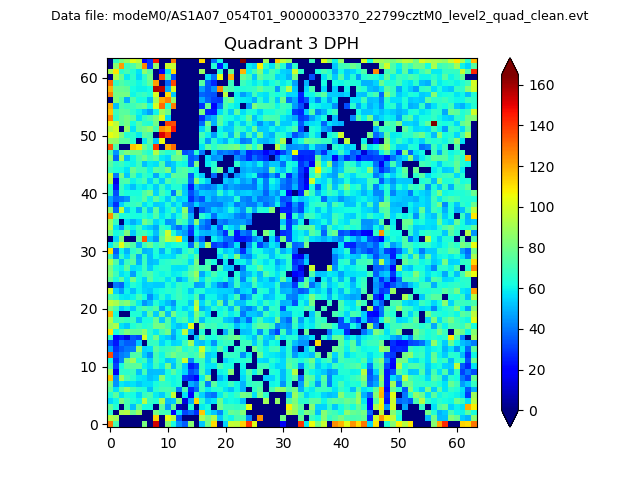 |
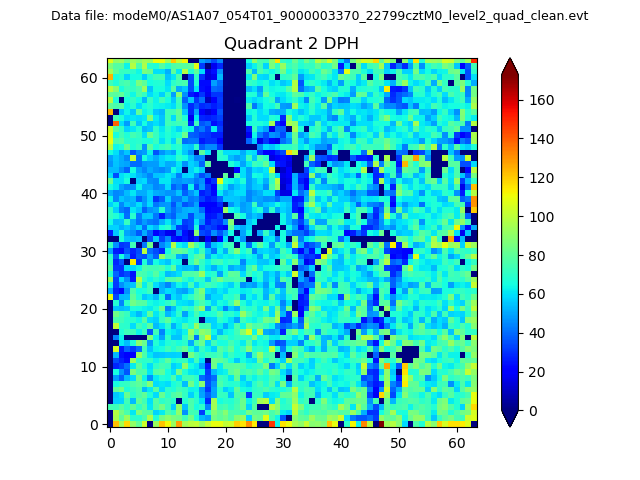 |
Quadrant C |
| Plot type | Count rate plots | Images |
|---|---|---|
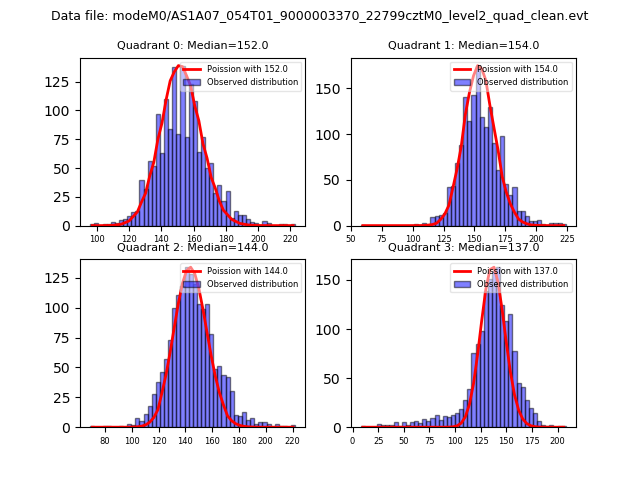
| Comparison with Poisson distribution Blue bars denote a histogram of data divided into 1 sec bins. Red curve is a Poisson curve with rate = median count rate of data. |
 |
 |
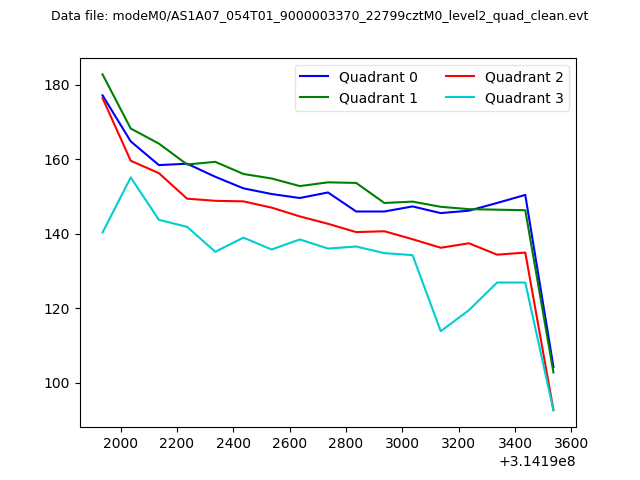
| Quadrant-wise count rates Data is divided into 100 sec bins |
 |
|
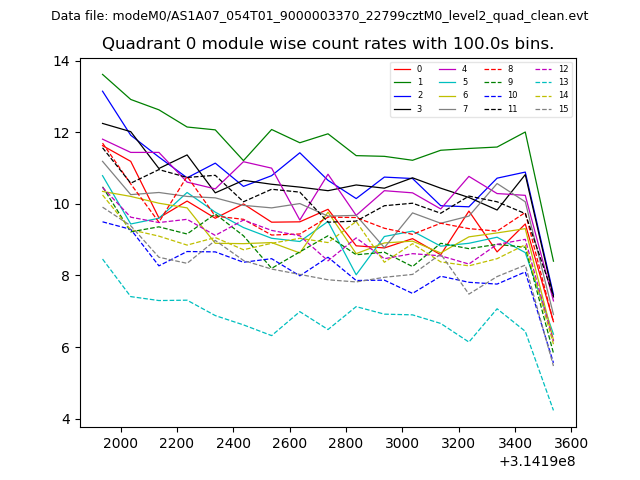
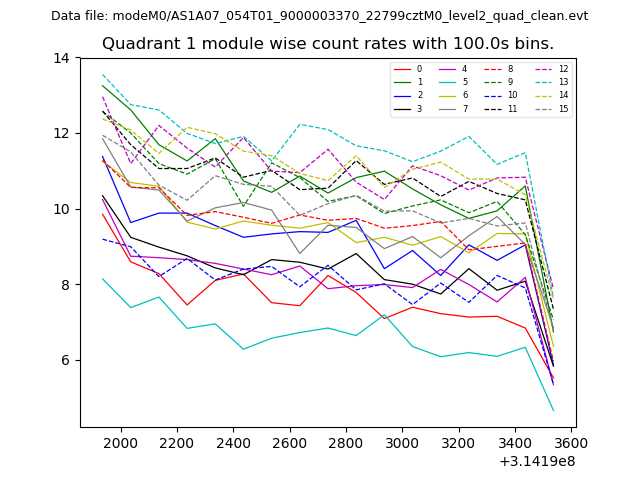
| Module-wise count rates for Quadrant A Data is divided into 100 sec bins |
 |
 |
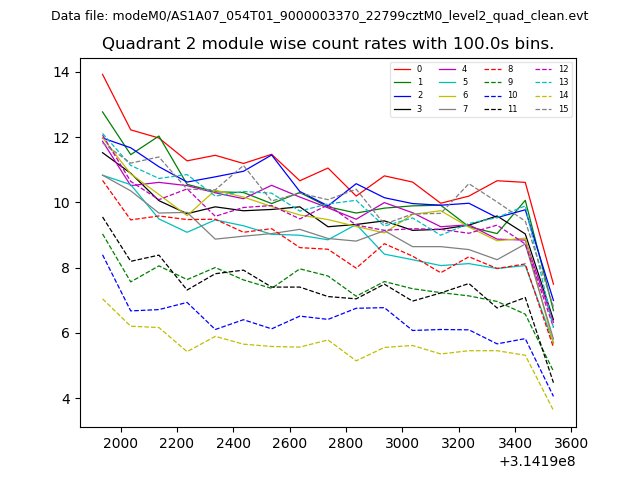
| Module-wise count rates for Quadrant B Data is divided into 100 sec bins |
 |
 |
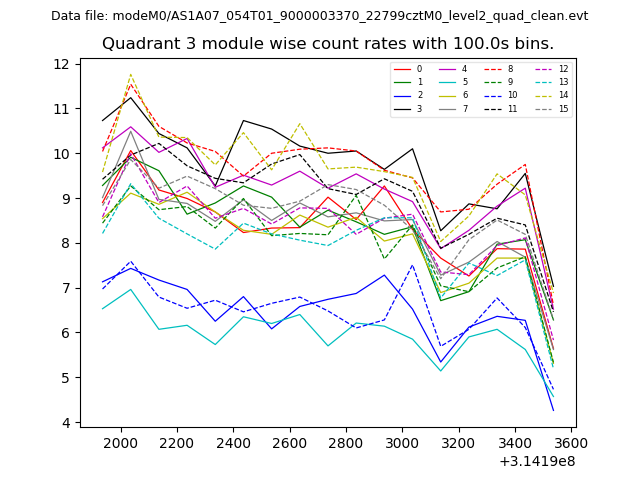
| Module-wise count rates for Quadrant C Data is divided into 100 sec bins |
 |
 |
| Module-wise count rates for Quadrant D Data is divided into 100 sec bins |
 |
 |
| Parameter | Plot |
|---|---|
| CZT HV Monitor | 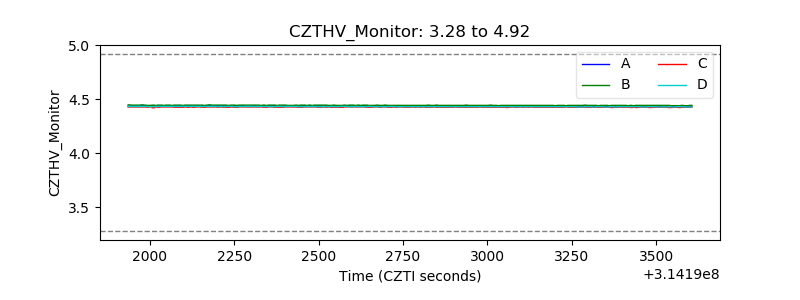 |
| D_VDD | 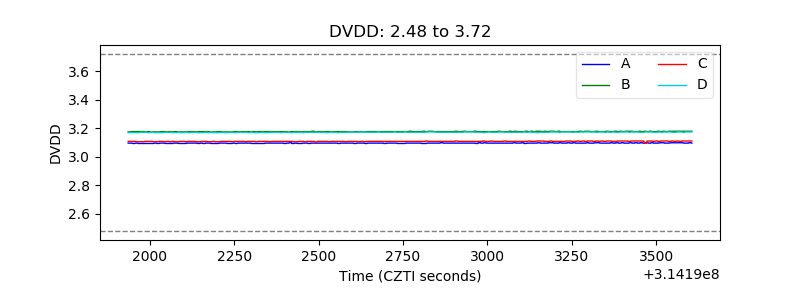 |
| Temperature 1 | 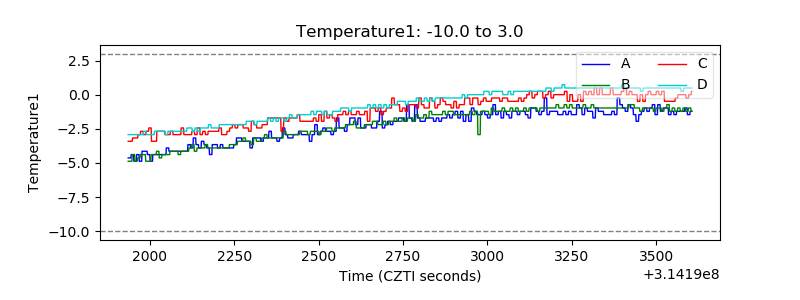 |
| Veto HV Monitor |  |
| Veto LLD | 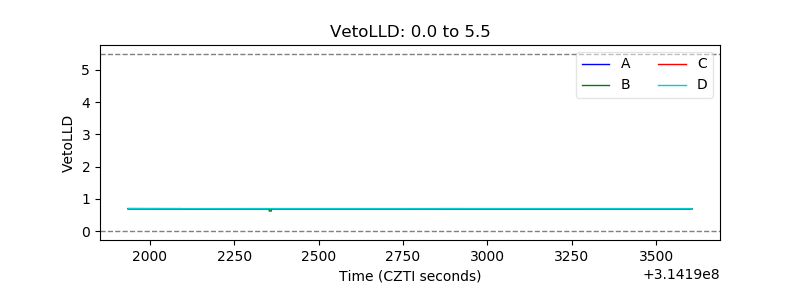 |
| Alpha Counter | 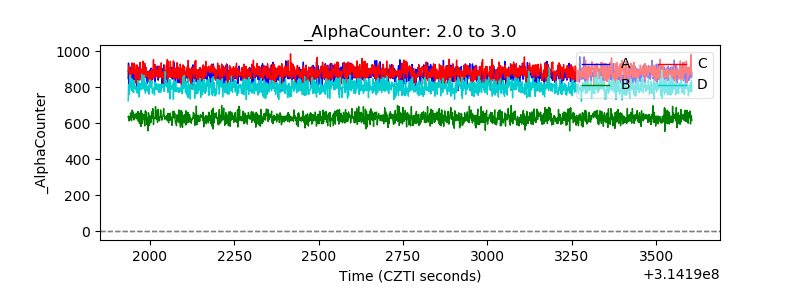 |
| _CPM_Rate | 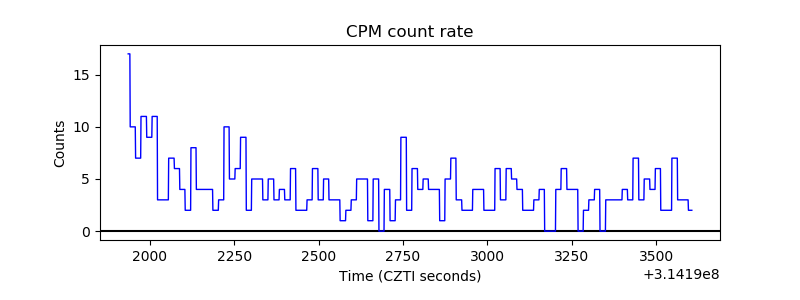 |
| CZT Counter | 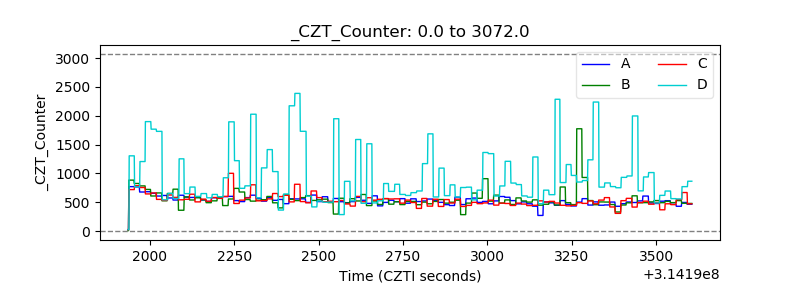 |
| +2.5 Volts monitor | 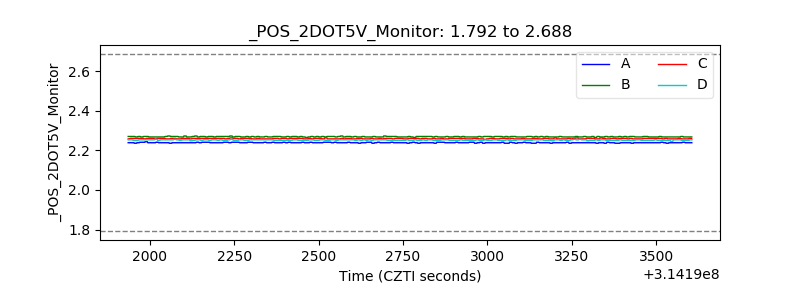 |
| +5 Volts monitor |  |
| _ROLL_ROT | 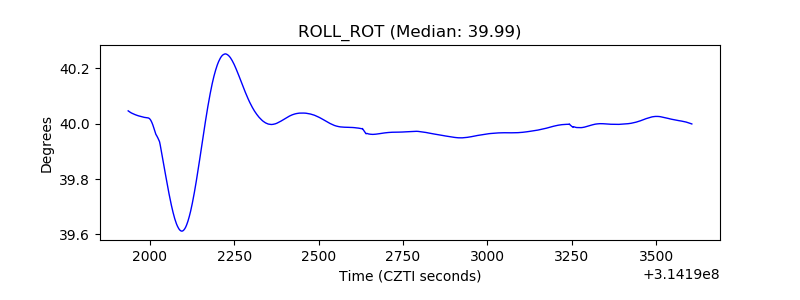 |
| _Roll_DEC | 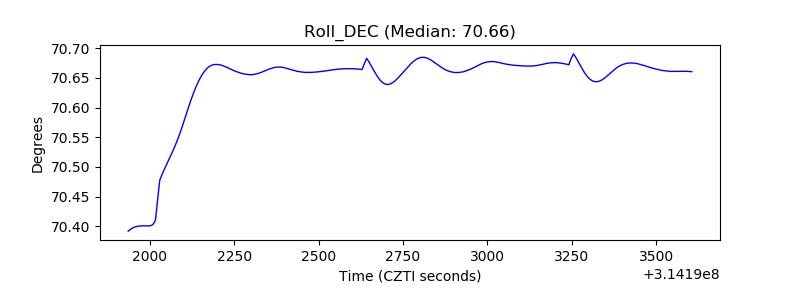 |
| _Roll_RA | 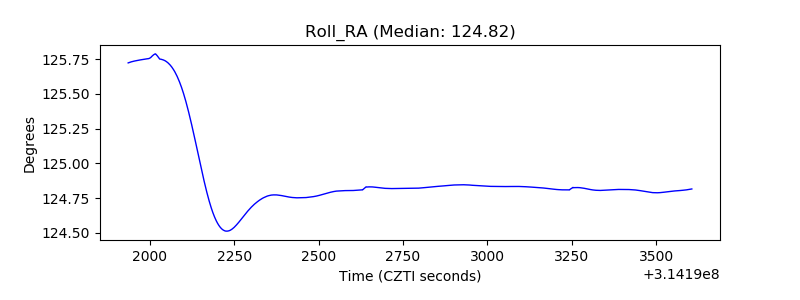 |
| Veto Counter | 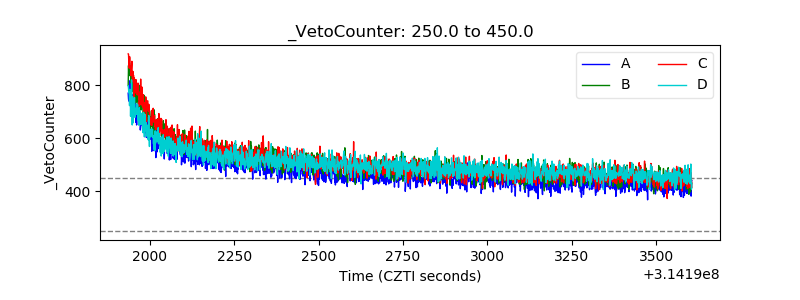 |