| Param | Original file | Final file |
|---|---|---|
| Filename | modeM0/AS1A07_054T01_9000003370_22800cztM0_level2.evt | modeM0/AS1A07_054T01_9000003370_22800cztM0_level2_quad_clean.evt |
| Size (bytes) | 502,398,720 | 130,213,440 |
| Size | 479.1 MB | 124.2 MB |
| Events in quadrant A | 3,095,510 | 911,994 |
| Events in quadrant B | 3,249,837 | 907,419 |
| Events in quadrant C | 3,132,528 | 855,623 |
| Events in quadrant D | 5,303,508 | 822,883 |
| Mode M0 | |||
|---|---|---|---|
| Quadrant | BADHDUFLAG | Total packets | Discarded packets |
| A | 0 | 13070 | 1 |
| B | 0 | 13436 | 1 |
| C | 0 | 13158 | 1 |
| D | 0 | 20047 | 1 |
| Mode SS | |||
|---|---|---|---|
| Quadrant | BADHDUFLAG | Total packets | Discarded packets |
| A | 0 | 130 | 0 |
| B | 0 | 130 | 0 |
| C | 0 | 130 | 0 |
| D | 0 | 130 | 0 |
| Mode M9 | |||
|---|---|---|---|
| Quadrant | BADHDUFLAG | Total packets | Discarded packets |
| A | 0 | 10 | 0 |
| B | 0 | 10 | 0 |
| C | 0 | 10 | 0 |
| D | 0 | 10 | 0 |
| Quadrant | Total seconds | Saturated seconds | Saturation percentage |
|---|---|---|---|
| A | 6392 | 52 | 0.813517% |
| B | 6393 | 71 | 1.110590% |
| C | 6393 | 92 | 1.439074% |
| D | 6393 | 477 | 7.461286% |
Noise dominated data is calculated using 1-second bins in cleaned event files. If a bin has >2000 counts, and if more than 50% of those come from <1% of pixels, then it is considered to be noise-dominated and hence unusable.
| Quadrant | # 1 sec bins | Bins with >0 counts | Bins with >2000 counts | High rate bins dominated by noise | Noise dominated (total time) | Noise dominated (detector-on time) | Marked lightcurve |
|---|---|---|---|---|---|---|---|
| A | 7357 | 6393 | 0 | 0 | 0.00% | 0.00% | 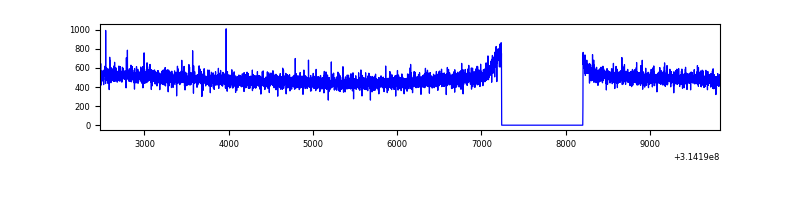 |
| B | 7358 | 6394 | 4 | 4 | 0.05% | 0.06% | 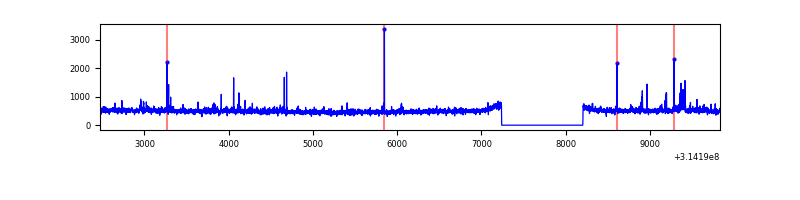 |
| C | 7358 | 6394 | 6 | 6 | 0.08% | 0.09% | 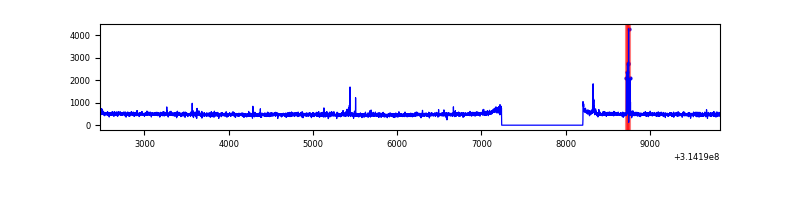 |
| D | 7358 | 6394 | 280 | 280 | 3.81% | 4.38% | 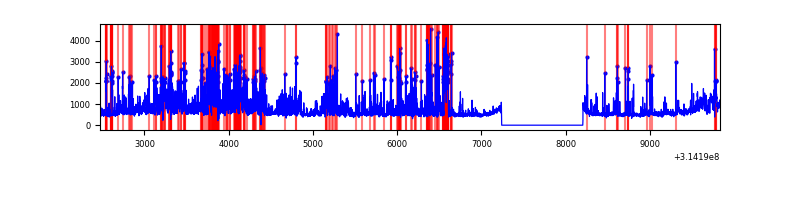 |
Top three noisy pixels from each quadrant. If the there are fewer than three noisy pixels in the level2.evt file, extra rows are filled as -1
| Pixel properties | Quadrant properties | ||||||
|---|---|---|---|---|---|---|---|
| Quadrant | DetID | PixID | Counts | Sigma | Mean | Median | Sigma |
| A | 13 | 254 | 12241 | 71.82 | 800 | 784 | 159.5 |
| A | 0 | 226 | 6958 | 38.7 | 800 | 784 | 159.5 |
| A | 11 | 47 | 6342 | 34.84 | 800 | 784 | 159.5 |
| B | 0 | 190 | 57092 | 387.53 | 788 | 771 | 145.3 |
| B | 0 | 228 | 31390 | 210.68 | 788 | 771 | 145.3 |
| B | 0 | 230 | 25517 | 170.27 | 788 | 771 | 145.3 |
| C | 14 | 238 | 122277 | 699.59 | 757 | 763 | 173.7 |
| C | 0 | 207 | 27645 | 154.77 | 757 | 763 | 173.7 |
| C | 10 | 22 | 18695 | 103.24 | 757 | 763 | 173.7 |
| D | 1 | 52 | 1890021 | 10371.54 | 755 | 732 | 182.2 |
| D | 13 | 172 | 208472 | 1140.42 | 755 | 732 | 182.2 |
| D | 6 | 112 | 78154 | 425.02 | 755 | 732 | 182.2 |
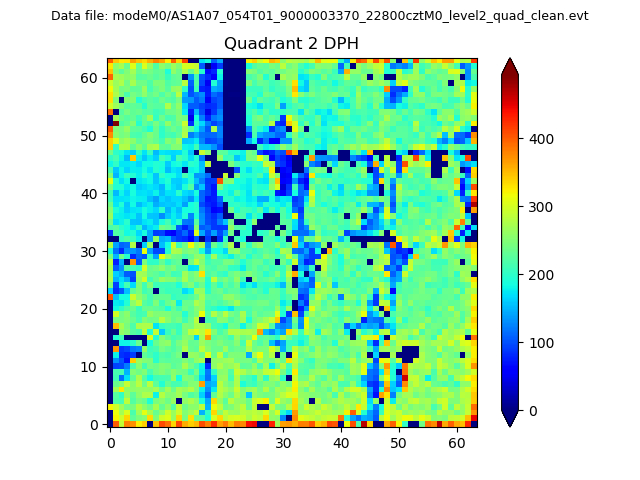
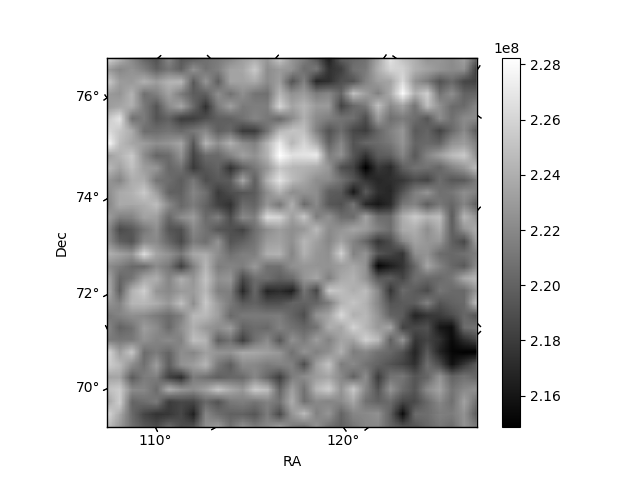
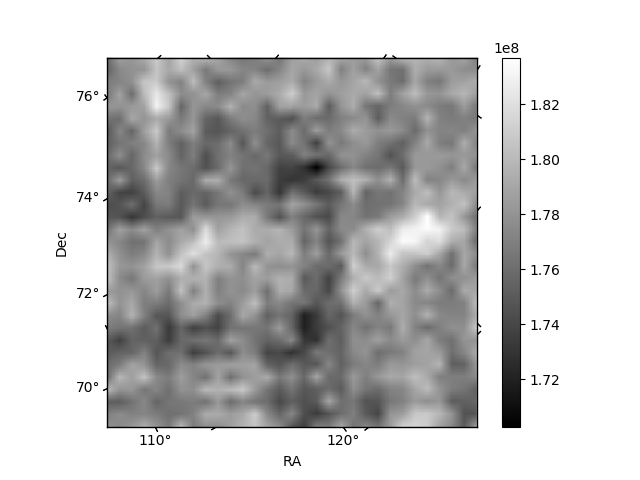
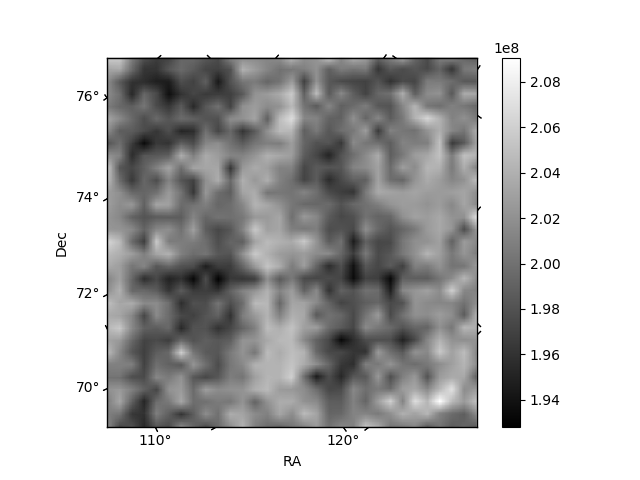
Histogram calculated using DETX and DETY for each event in the final _common_clean file
| Quadrant A | 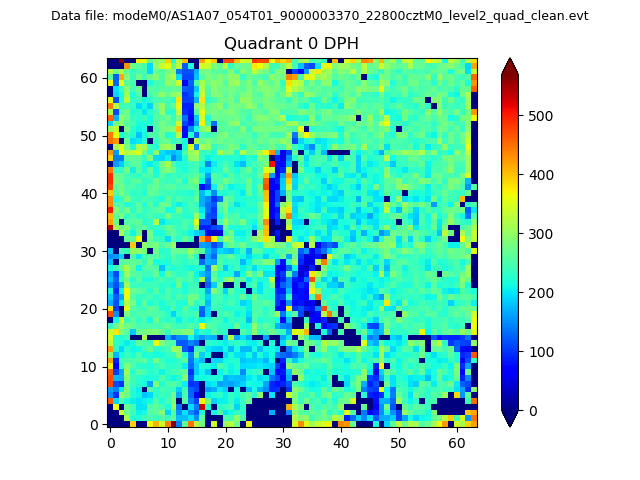 |
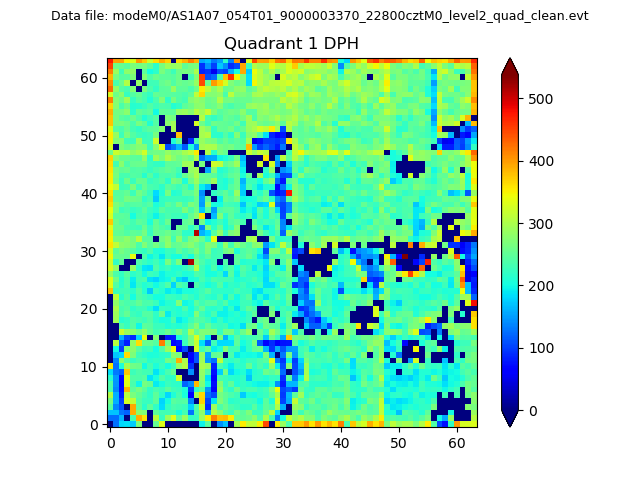 |
Quadrant B |
|---|---|---|---|
| Quadrant D | 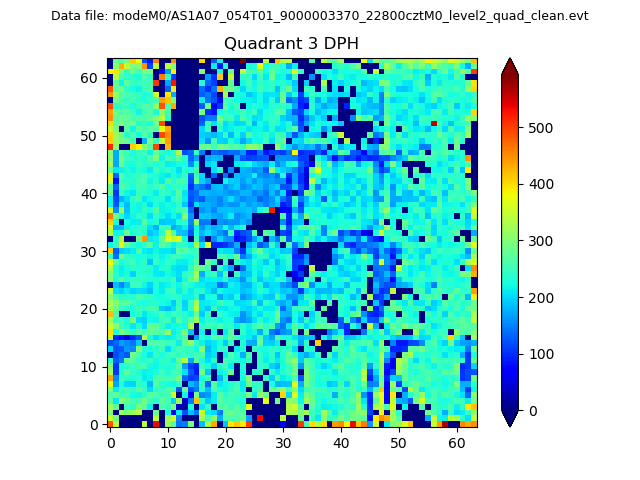 |
 |
Quadrant C |
| Plot type | Count rate plots | Images |
|---|---|---|
| Comparison with Poisson distribution Blue bars denote a histogram of data divided into 1 sec bins. Red curve is a Poisson curve with rate = median count rate of data. |
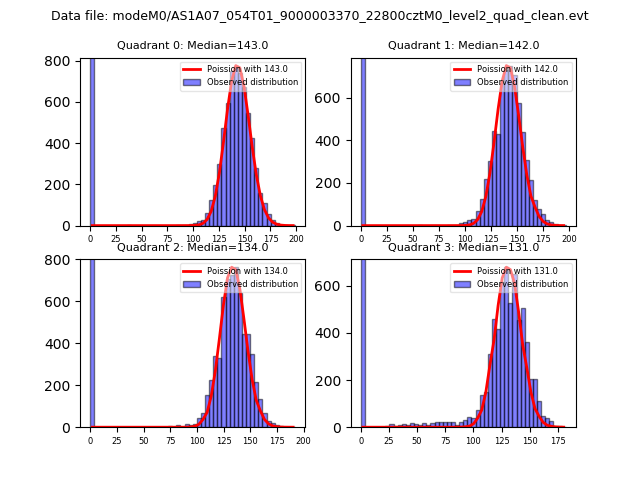 |
 |
| Quadrant-wise count rates Data is divided into 100 sec bins |
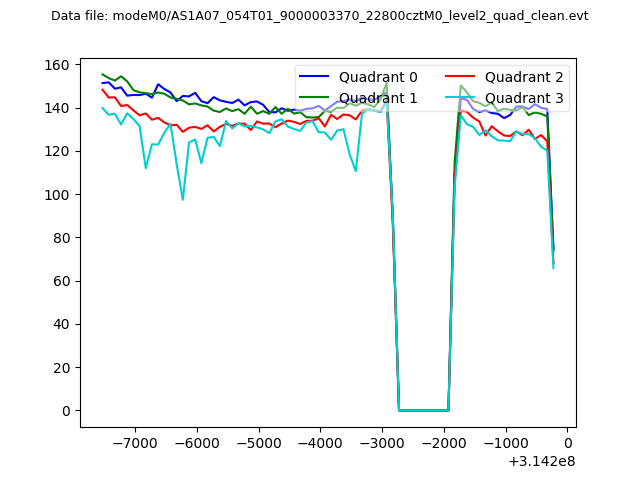 |
|
| Module-wise count rates for Quadrant A Data is divided into 100 sec bins |
 |
 |
| Module-wise count rates for Quadrant B Data is divided into 100 sec bins |
 |
 |
| Module-wise count rates for Quadrant C Data is divided into 100 sec bins |
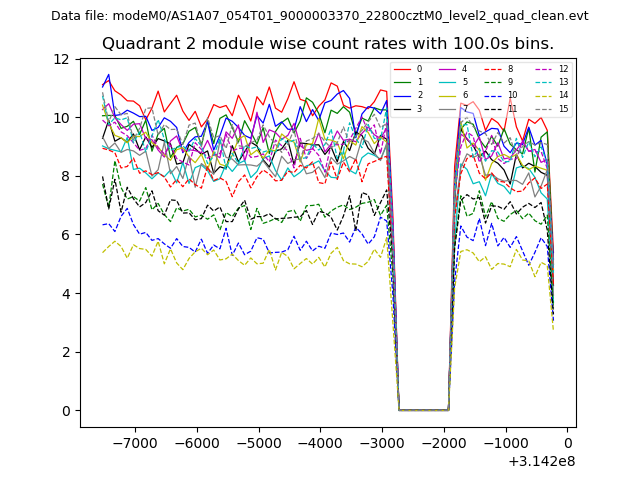 |
 |
| Module-wise count rates for Quadrant D Data is divided into 100 sec bins |
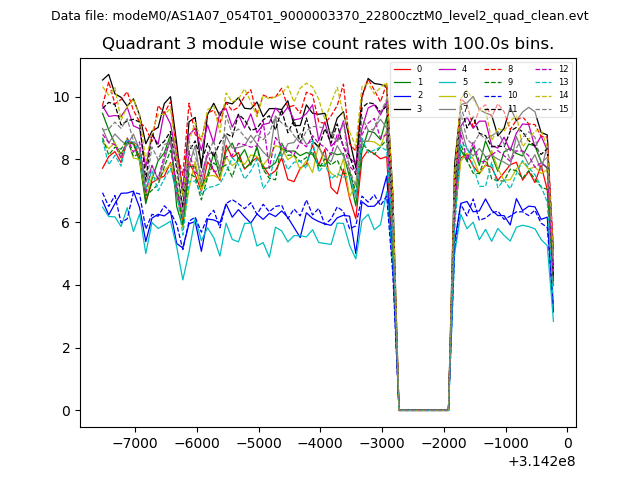 |
 |
| Parameter | Plot |
|---|---|
| CZT HV Monitor |  |
| D_VDD | 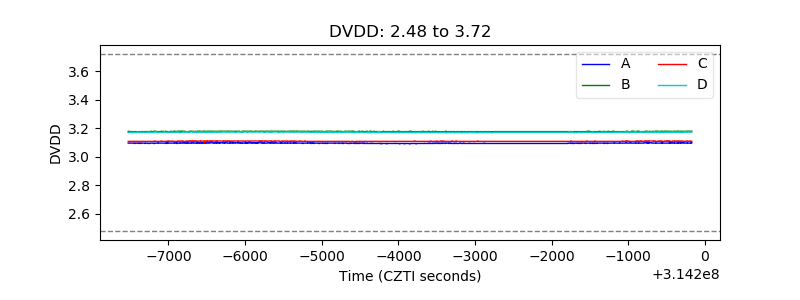 |
| Temperature 1 | 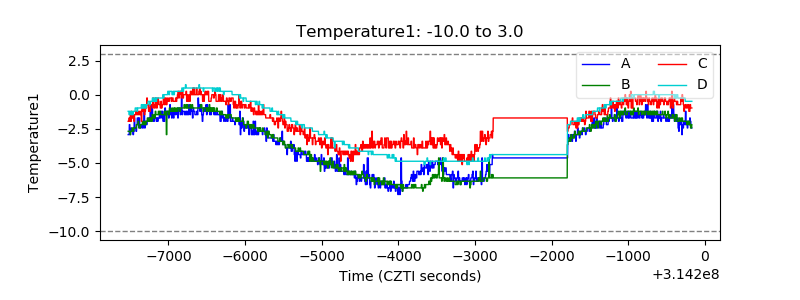 |
| Veto HV Monitor |  |
| Veto LLD | 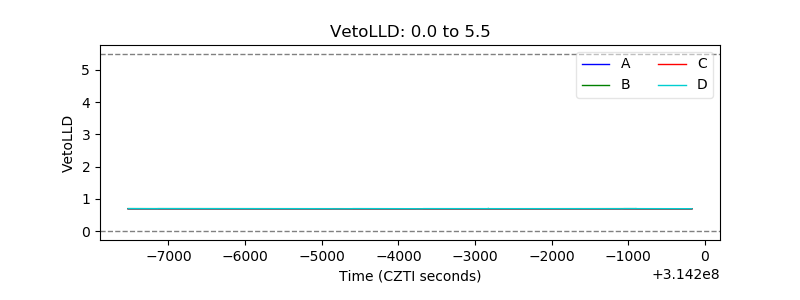 |
| Alpha Counter | 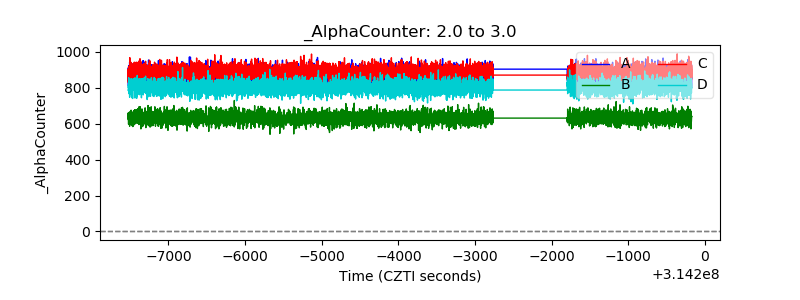 |
| _CPM_Rate | 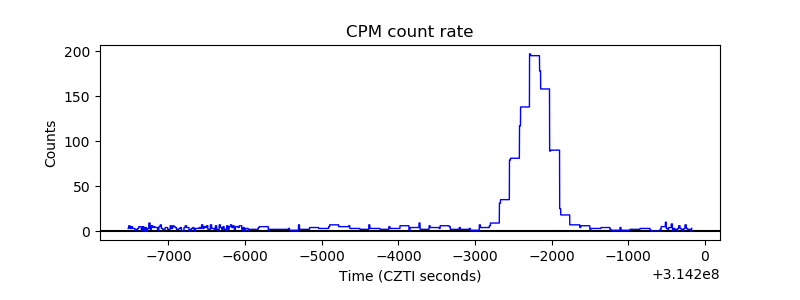 |
| CZT Counter | 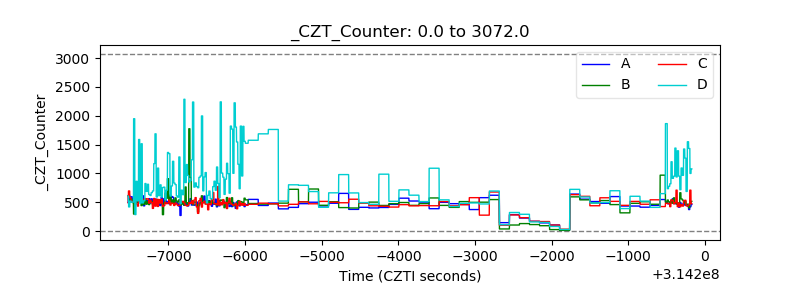 |
| +2.5 Volts monitor | 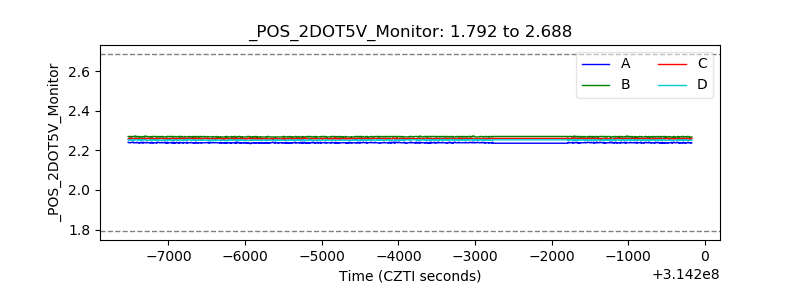 |
| +5 Volts monitor |  |
| _ROLL_ROT |  |
| _Roll_DEC | 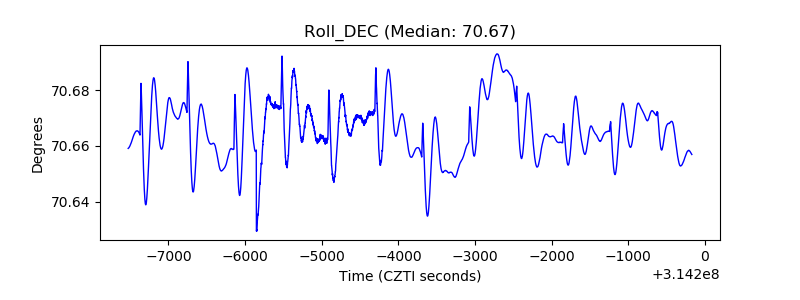 |
| _Roll_RA | 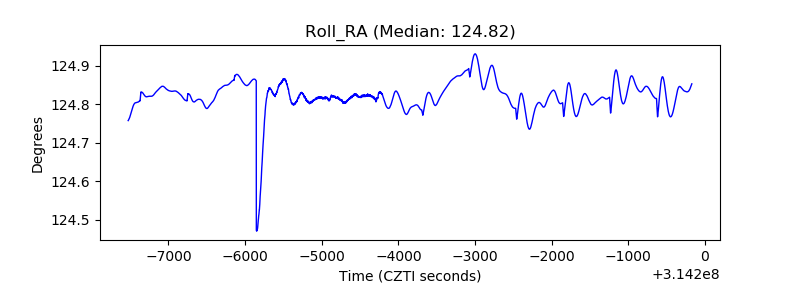 |
| Veto Counter |  |