| Param | Original file | Final file |
|---|---|---|
| Filename | modeM0/AS1A07_054T01_9000003370_22801cztM0_level2.evt | modeM0/AS1A07_054T01_9000003370_22801cztM0_level2_quad_clean.evt |
| Size (bytes) | 453,513,600 | 125,294,400 |
| Size | 432.5 MB | 119.5 MB |
| Events in quadrant A | 3,004,841 | 867,323 |
| Events in quadrant B | 3,174,164 | 859,295 |
| Events in quadrant C | 3,019,128 | 813,641 |
| Events in quadrant D | 4,102,401 | 808,889 |
| Mode M0 | |||
|---|---|---|---|
| Quadrant | BADHDUFLAG | Total packets | Discarded packets |
| A | 0 | 13014 | 1 |
| B | 0 | 13489 | 1 |
| C | 0 | 13049 | 1 |
| D | 0 | 16521 | 2 |
| Mode SS | |||
|---|---|---|---|
| Quadrant | BADHDUFLAG | Total packets | Discarded packets |
| A | 0 | 128 | 0 |
| B | 0 | 128 | 0 |
| C | 0 | 128 | 0 |
| D | 0 | 128 | 0 |
| Mode M9 | |||
|---|---|---|---|
| Quadrant | BADHDUFLAG | Total packets | Discarded packets |
| A | 0 | 6 | 0 |
| B | 0 | 6 | 0 |
| C | 0 | 6 | 0 |
| D | 0 | 6 | 0 |
| Quadrant | Total seconds | Saturated seconds | Saturation percentage |
|---|---|---|---|
| A | 6395 | 35 | 0.547303% |
| B | 6395 | 59 | 0.922596% |
| C | 6395 | 84 | 1.313526% |
| D | 6394 | 128 | 2.001877% |
Noise dominated data is calculated using 1-second bins in cleaned event files. If a bin has >2000 counts, and if more than 50% of those come from <1% of pixels, then it is considered to be noise-dominated and hence unusable.
| Quadrant | # 1 sec bins | Bins with >0 counts | Bins with >2000 counts | High rate bins dominated by noise | Noise dominated (total time) | Noise dominated (detector-on time) | Marked lightcurve |
|---|---|---|---|---|---|---|---|
| A | 6946 | 6396 | 0 | 0 | 0.00% | 0.00% |  |
| B | 6946 | 6396 | 2 | 2 | 0.03% | 0.03% |  |
| C | 6946 | 6396 | 1 | 1 | 0.01% | 0.02% |  |
| D | 6945 | 6395 | 63 | 63 | 0.91% | 0.99% |  |
Top three noisy pixels from each quadrant. If the there are fewer than three noisy pixels in the level2.evt file, extra rows are filled as -1
| Pixel properties | Quadrant properties | ||||||
|---|---|---|---|---|---|---|---|
| Quadrant | DetID | PixID | Counts | Sigma | Mean | Median | Sigma |
| A | 11 | 47 | 16087 | 99.49 | 772 | 757 | 154.1 |
| A | 13 | 254 | 11886 | 72.22 | 772 | 757 | 154.1 |
| A | 13 | 252 | 11819 | 71.79 | 772 | 757 | 154.1 |
| B | 0 | 190 | 83033 | 572.3 | 764 | 746 | 143.8 |
| B | 0 | 228 | 44279 | 302.77 | 764 | 746 | 143.8 |
| B | 0 | 230 | 39121 | 266.9 | 764 | 746 | 143.8 |
| C | 14 | 238 | 118694 | 692.85 | 734 | 738 | 170.2 |
| C | 0 | 207 | 24433 | 139.18 | 734 | 738 | 170.2 |
| C | 2 | 16 | 8230 | 44.01 | 734 | 738 | 170.2 |
| D | 1 | 52 | 505876 | 2808.14 | 747 | 725 | 179.9 |
| D | 13 | 172 | 485632 | 2695.6 | 747 | 725 | 179.9 |
| D | 7 | 238 | 71908 | 395.71 | 747 | 725 | 179.9 |
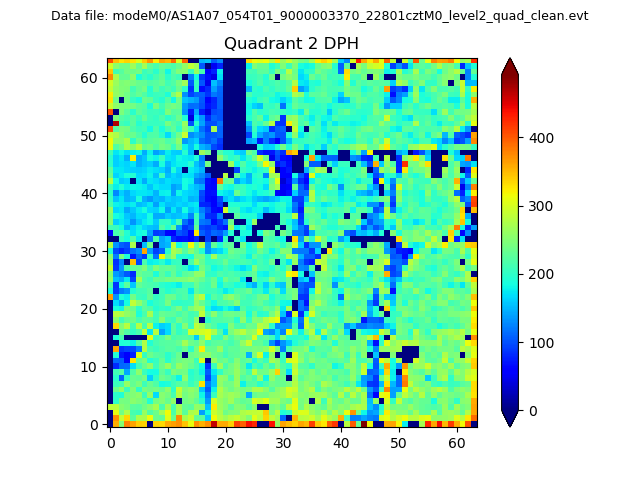
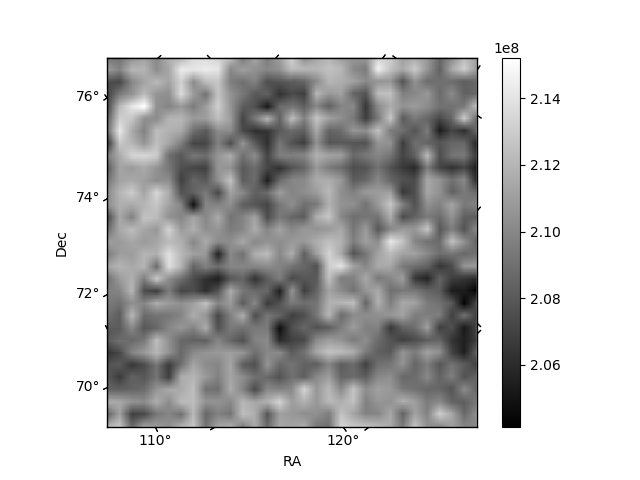
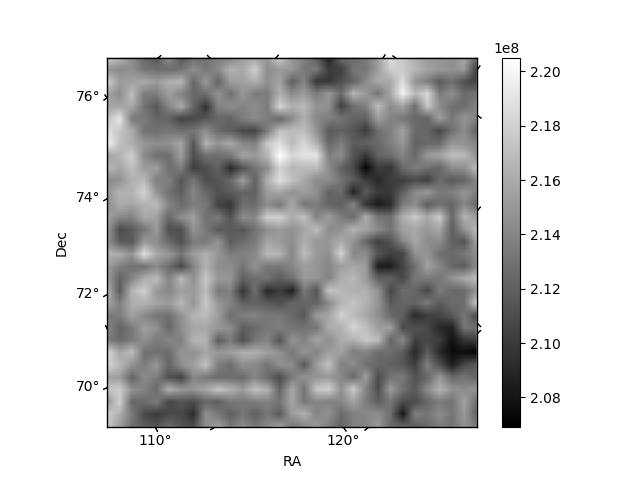
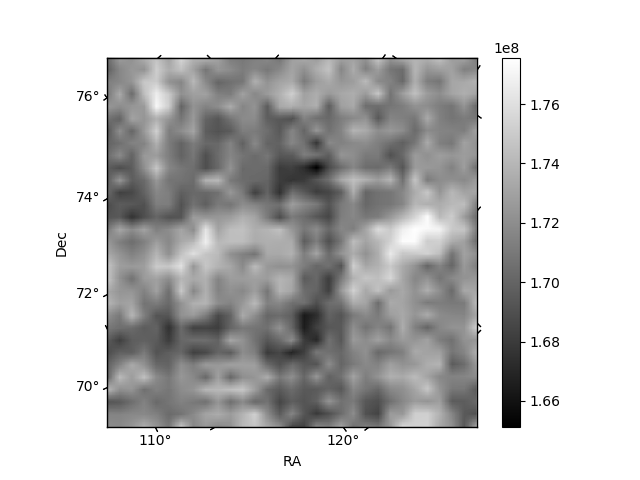
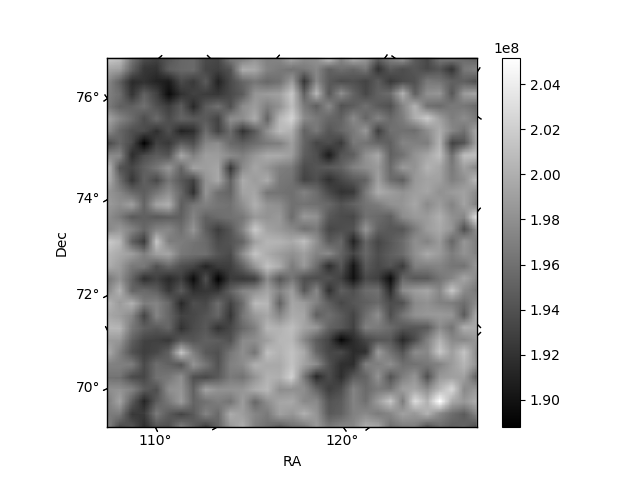
Histogram calculated using DETX and DETY for each event in the final _common_clean file
| Quadrant A | 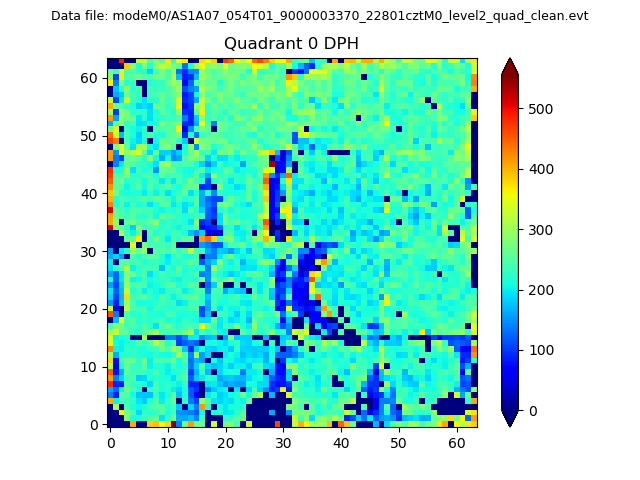 |
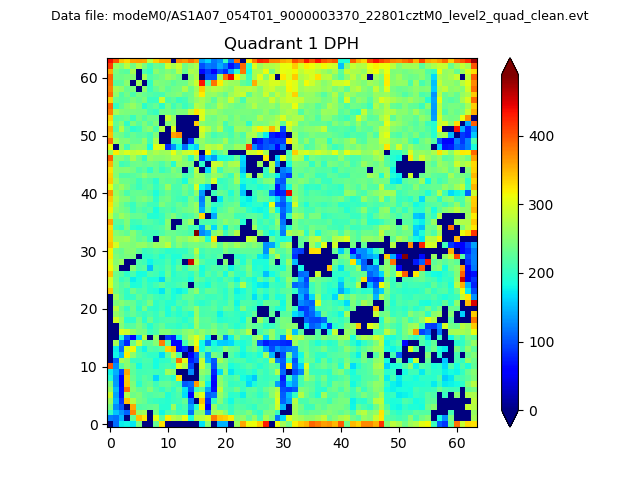 |
Quadrant B |
|---|---|---|---|
| Quadrant D | 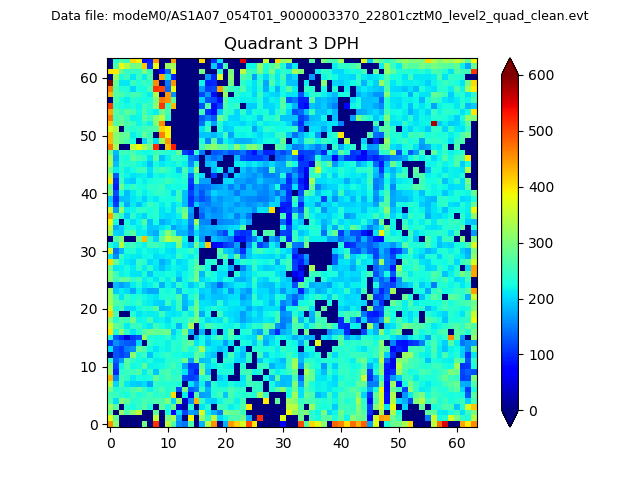 |
 |
Quadrant C |
| Plot type | Count rate plots | Images |
|---|---|---|
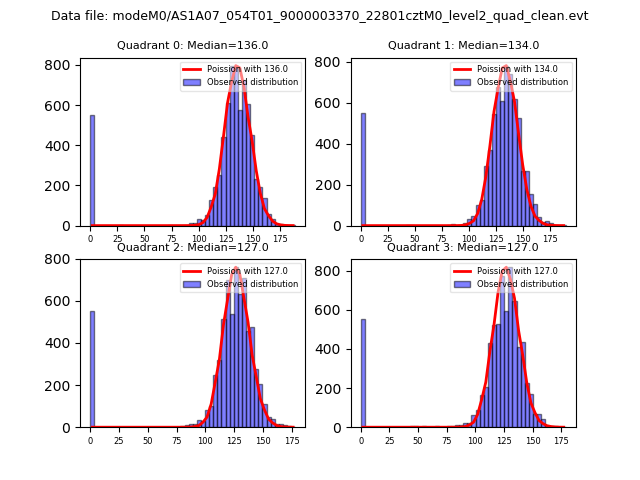
| Comparison with Poisson distribution Blue bars denote a histogram of data divided into 1 sec bins. Red curve is a Poisson curve with rate = median count rate of data. |
 |
 |
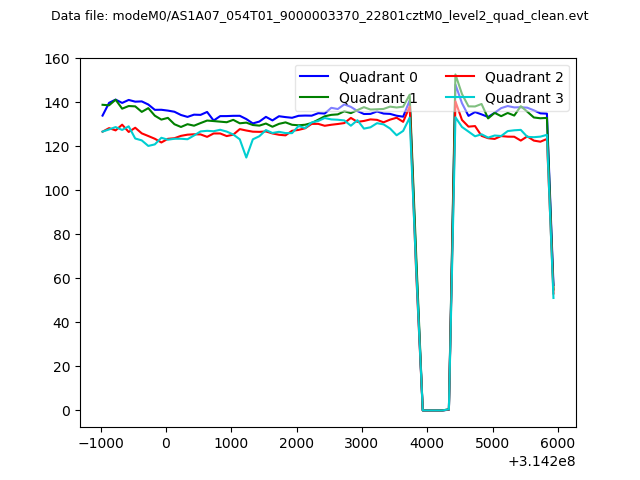
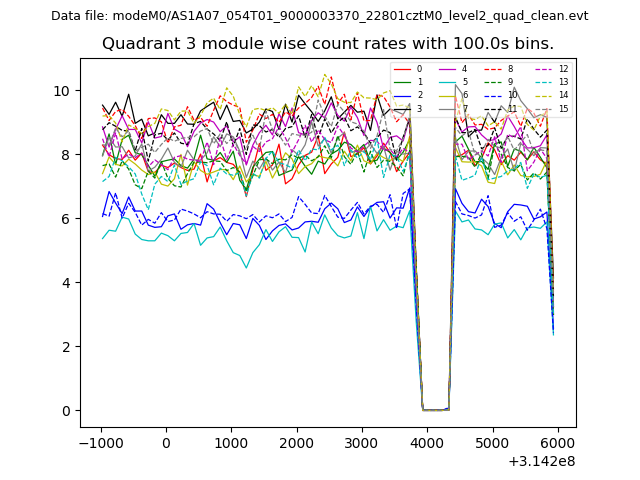
| Quadrant-wise count rates Data is divided into 100 sec bins |
 |
|
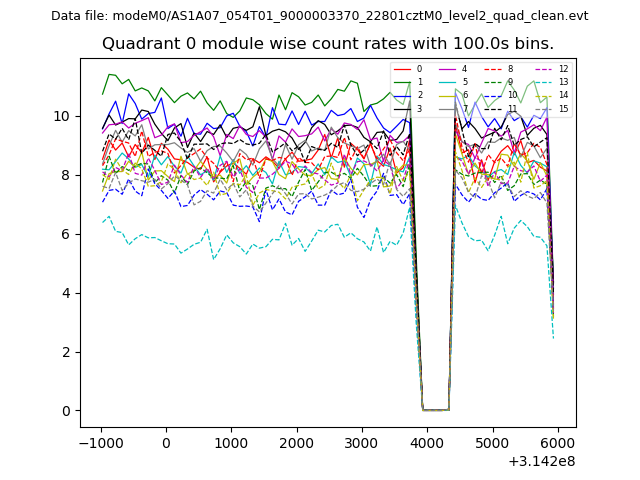
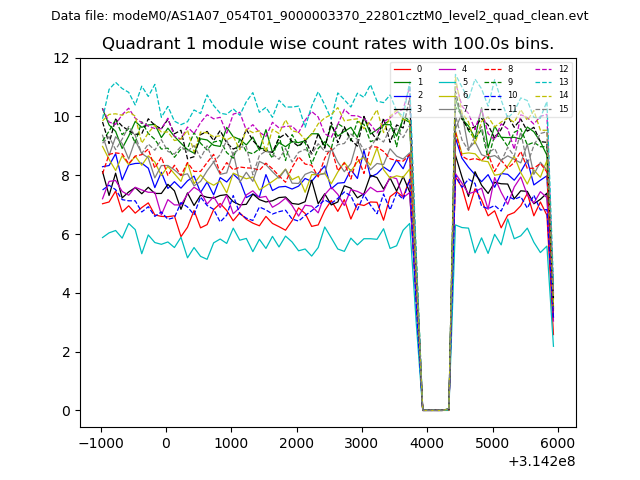
| Module-wise count rates for Quadrant A Data is divided into 100 sec bins |
 |
 |
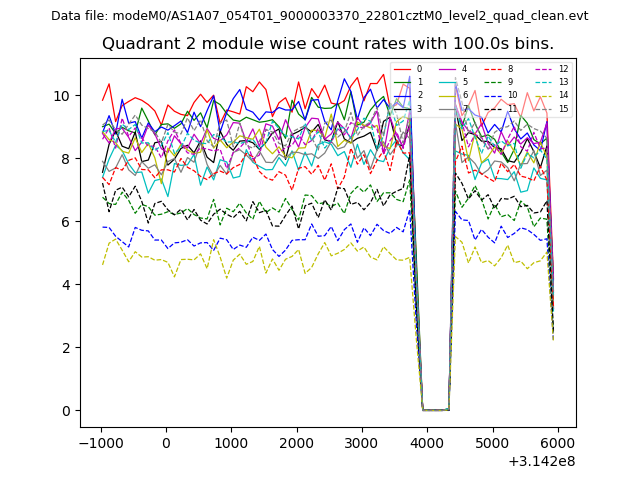
| Module-wise count rates for Quadrant B Data is divided into 100 sec bins |
 |
 |
| Module-wise count rates for Quadrant C Data is divided into 100 sec bins |
 |
 |
| Module-wise count rates for Quadrant D Data is divided into 100 sec bins |
 |
 |
| Parameter | Plot |
|---|---|
| CZT HV Monitor | 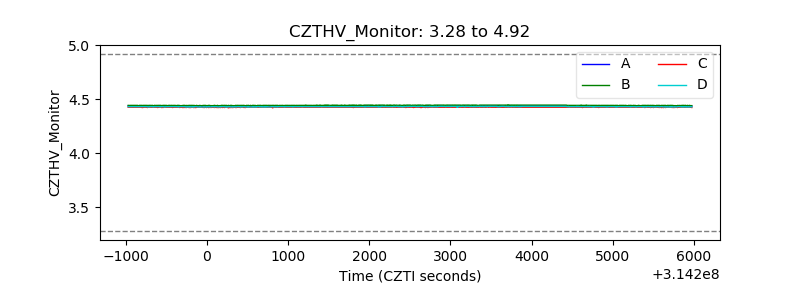 |
| D_VDD | 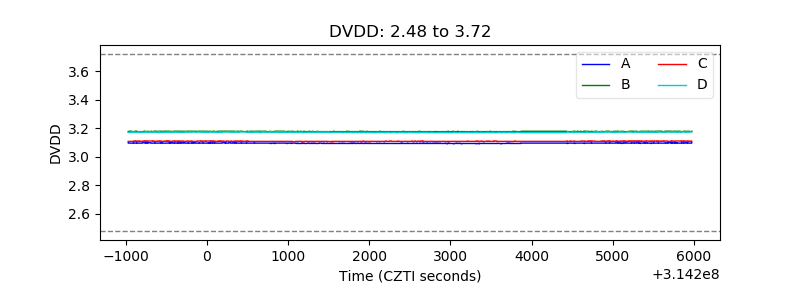 |
| Temperature 1 | 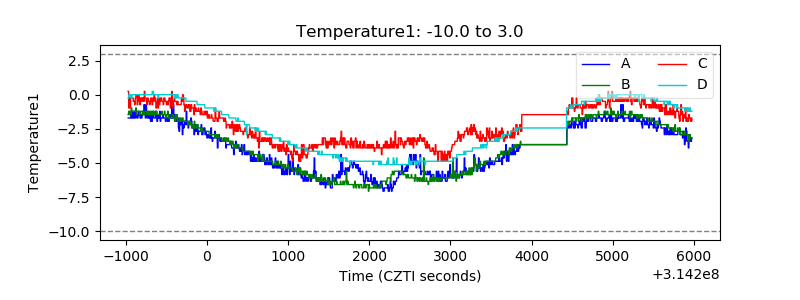 |
| Veto HV Monitor | 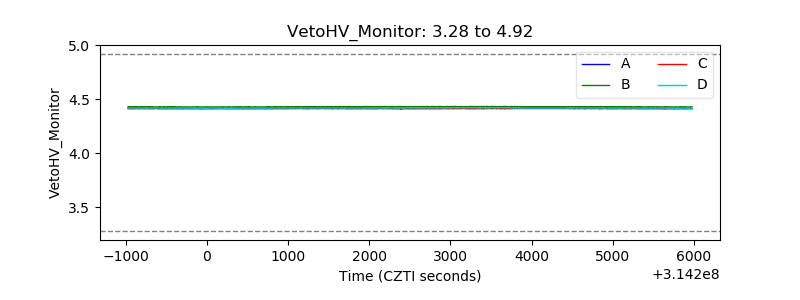 |
| Veto LLD | 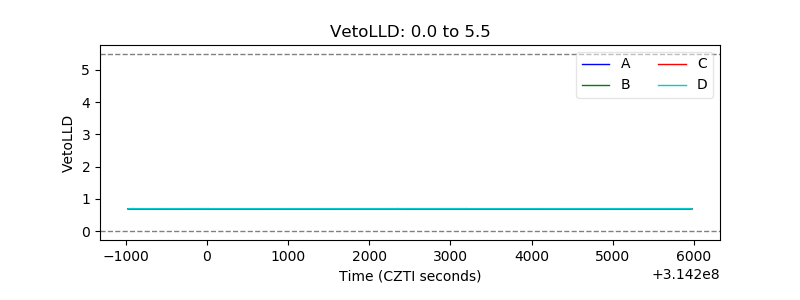 |
| Alpha Counter | 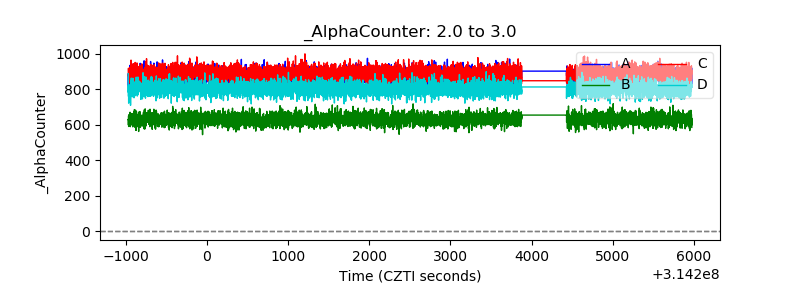 |
| _CPM_Rate | 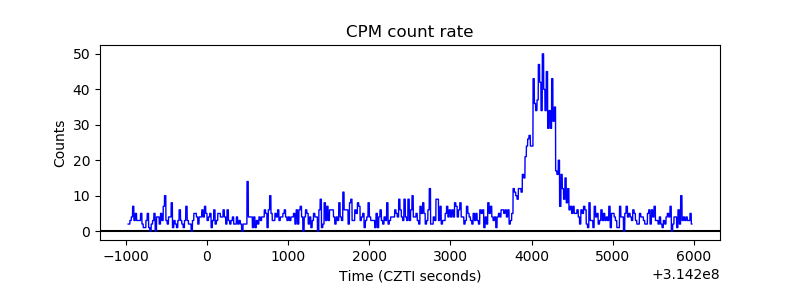 |
| CZT Counter | 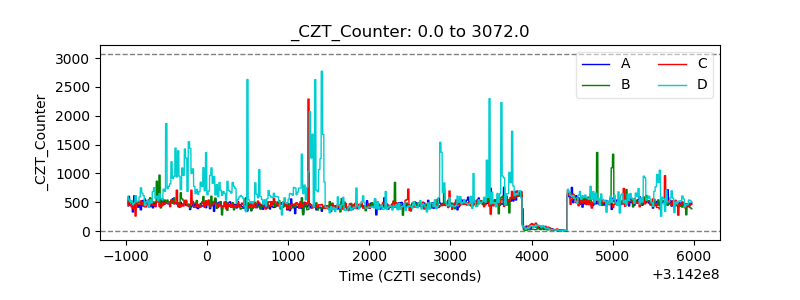 |
| +2.5 Volts monitor |  |
| +5 Volts monitor | 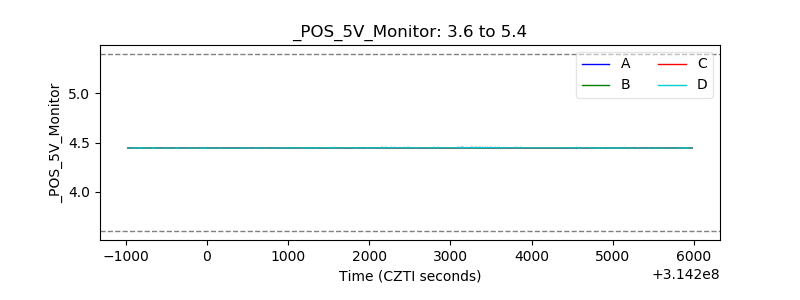 |
| _ROLL_ROT | 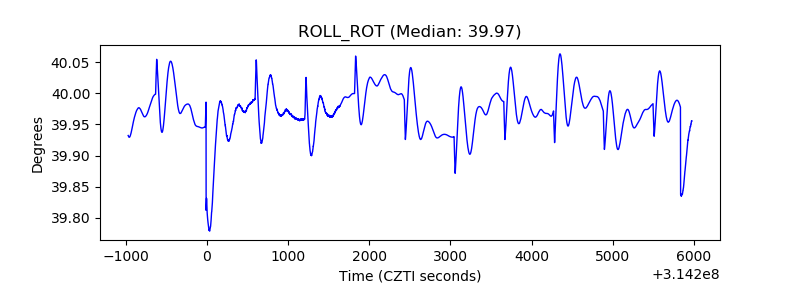 |
| _Roll_DEC | 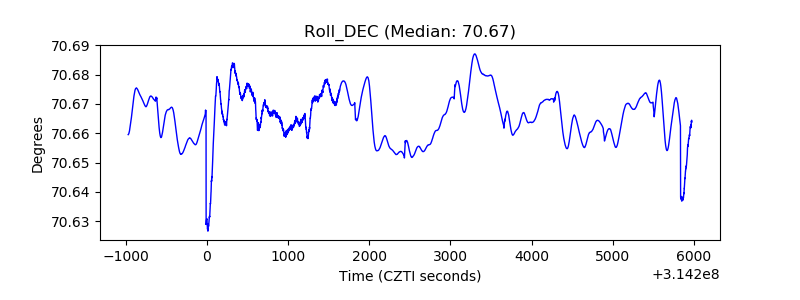 |
| _Roll_RA | 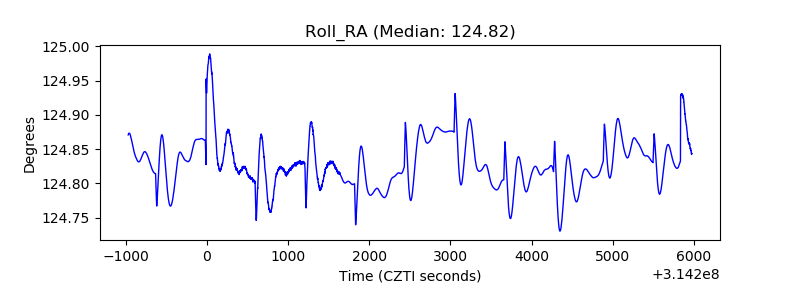 |
| Veto Counter | 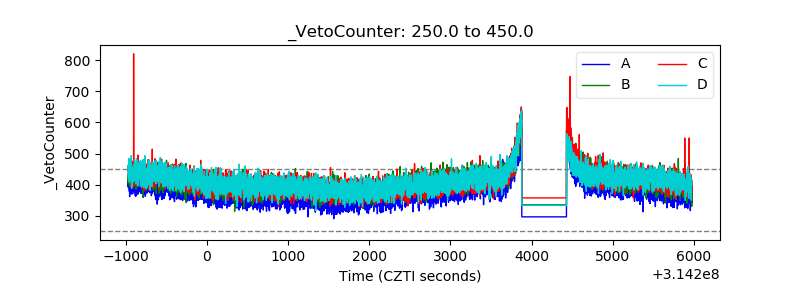 |